StO Price Action - Level ReactionShort-Summary
- Multi-timeframe reaction indicator for M5, M15, M30, H1, H4
- Monitors price interaction with higher timeframe levels (Daily, Weekly, H4)
- Detects whether price touches or breaks choosen levels
- Fully configurable colors, visibility and alerts per timeframe and level type
Full Description
Overview
- Tracks market reaction on significant levels across multiple timeframes
- Designed to identify intraday reactions to higher timeframe structure
- Supports both bullish and bearish reactions, with separate visual cues
- Alerts can be enabled to notify traders of touches or breaks
Core Logic
- Choice between detecting a touch or a break of the level
- Configurable reference level: Open, High or Low
- Lookback period can be set to target specific levels from previous candles
Timeframe Reactions
- Supported intraday reaction timeframes: M5, M15, M30, H1, H4, Daily, Weekly
- Each reaction type can be individually toggled for display
- Bullish and bearish reactions have separate color settings
- Alerts configurable per timeframe and reaction type
Alerting
- Alerts can be triggered for touches or breaks
- Supports separate alerts for each timeframe and each direction (bull/bear)
- Useful for real-time monitoring of key level interactions
Notes
- Intended as a market reaction tool not a standalone entry signal
- Helps traders confirm if price respects or violates higher timeframe levels
Broken

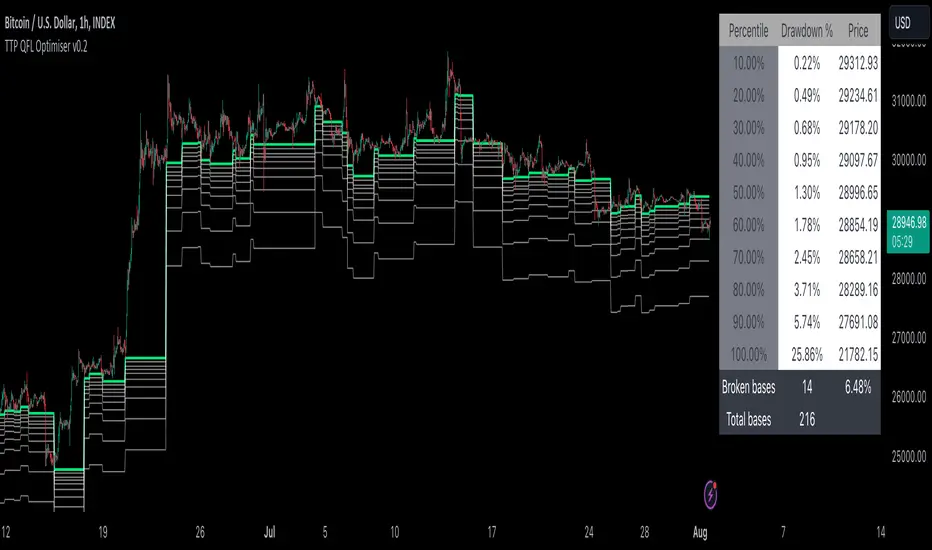
TTP QFL OptimiserThis tool is designed to help finding the best take profit and stop loss levels when trading with QFL bases (Quick Fingers Luc).
You can use it to see the average drawdown among all historic bases broken for an asset and then find the drawdowns that are more frequent using the percentile parameters provided.
For example, by knowing that 98% of the bases got broken with a drawdown of up to 5% can become extremely useful for deciding where to place your take profit or stop loss levels.
It supports QFL 1H, 2H and 4H but make sure to set the chart timeframe to a lower timeframe than QFL to obtain valid results.
Two percentiles are provided to be able to evaluate potential TP and SL at the same time.
Steps:
- Load an asset in the 15min TF
- Select the QFL version: 1H more deals / lower quality vs 4H less deals/ better quality
- Find a percentile that triggers enough deals (example: 70) and then another percentile that doesn't get hit too much (example: 98)
- Confirm the values p1 and p2 provided in the table and the white and grey lines for the results of which drawdown percentages correspond to such selection of percentiles
Once having p1 and p2 use your backtesting and forward testing tools to confirm and adjust accordingly.
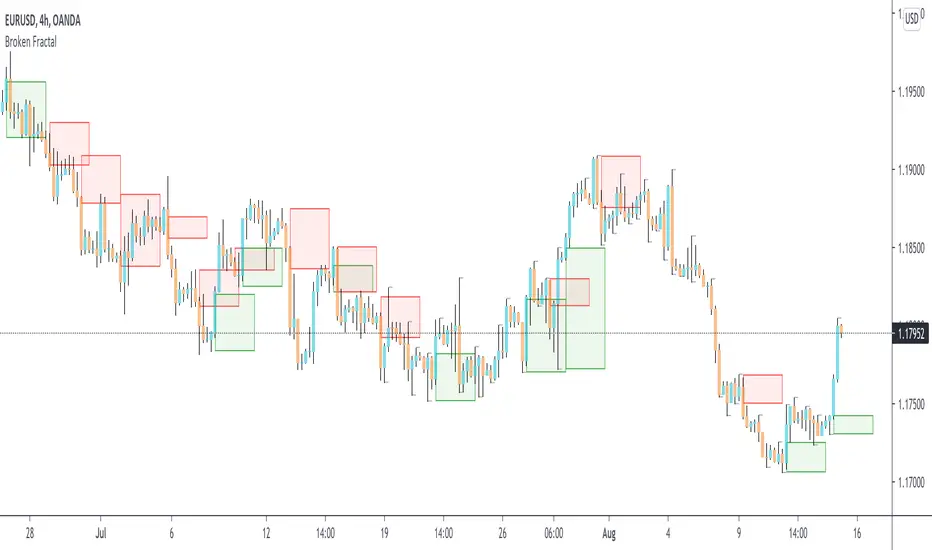
Broken Fractal : Someone's broken dream is your profit!Idea
The idea is simple : when market turns around, it traps a bunch of traders off guard. We trade with them, in the same direction of their exit!
Method
We let the market first create a fractal
We then let the market create an opposite fractal
We then let the market break the first fractal it created, thereby trapping lots of trades in the process
We then patiently wait till the market gives these trapped traders a chance to exit - and we trade in the same direction
How to use?
Green boxes are for long entry, red boxes are for short.
Whenever a box appears, that's the risk criteria - setup limit orders and trade along!
Works on all timeframes
If you like this script, please leave a note on how you are using it.
I personally use it with Higher Timeframe bias.
PS1 : some traders call this Break of market structure, some call it Breaker, I just call it "Broken Fractal"
PS2 : Break of a broken fractal is also very potent. Watch out for those!
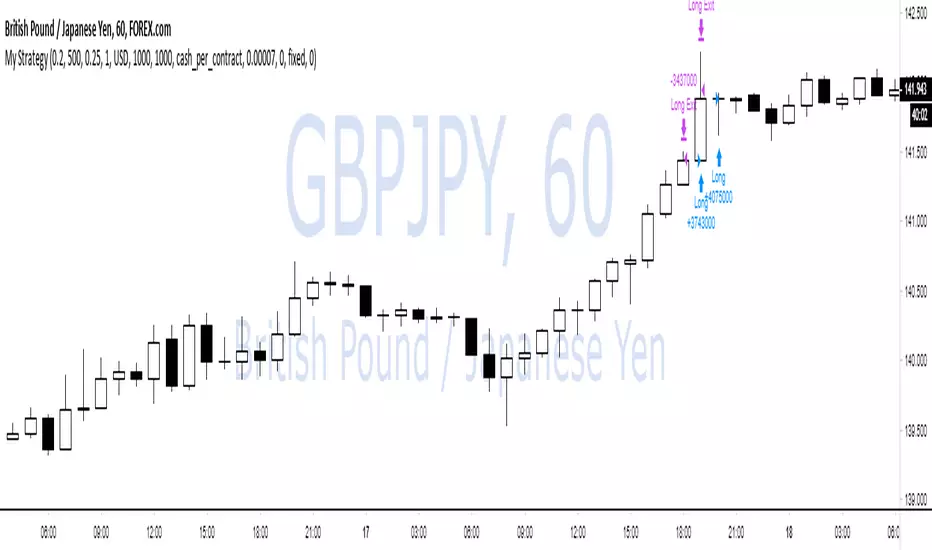
WOW no repainting and no security() call! 100% real results!If you couldn't tell by the title, this is a joke lmao.
TV has an awful backtesting engine and I just wanted to prove this with a super simple script.
We buy when close > open
and sell when close < open.
That's it.
There is also some risk management and trade closing when we reach a certain drawdown, but wait!
TradingView doesn't know what equity drawdown is because they don't use tick data or any lower timeframe data! Wowow!
Ps - all tickdata for Forex & CFD historical data is free from Dukascopy if you want to perform your own backtesting ;)
Dukascopy Data
Enjoy
-DasanC