Options Series - NonOverlay_Technical
⭐ 1. Purpose:
The script is designed to show technical indicators in a non-overlay form using candlestick representations. It combines multiple popular technical analysis tools to gauge the market's bullish or bearish conditions.
⭐ 2. Indicators:
The script uses several indicators across different timeframes: Exponential Moving Averages (EMA) for 5, 20, 50 periods. Simple Moving Average (SMA) for 200 periods. RSI (Relative Strength Index) for momentum. VWAP (Volume Weighted Average Price) for average price evaluation. PSAR (Parabolic SAR) for trend direction. Daily and multi-day (2-day and 3-day) data for broader market context.
⭐ 3. Candlestick Representation:
The script uses color-coded candlesticks to visually represent various indicators and their bullish/bearish states: Green candlesticks for bullish conditions. Red candlesticks for bearish conditions. Neutral/transparent for non-significant conditions.
⭐ 4. Important Conditions:
It calculates bullish and bearish conditions for each indicator: MA20: When the price is above or below the 20-period EMA. RSI: When RSI is above or below 50. VWAP: When the price is above or below the VWAP. PSAR: When the price is above or below the PSAR. 2-day and 3-day Moving Averages: Evaluating the broader trend.
⭐ 5. Bullish vs. Bearish Calculation:
The script sums up bullish and bearish signals to determine the overall market condition: Current_logical_bull: Counts the number of bullish indicators. Current_logical_bear: Counts the number of bearish indicators. The script compares these values to conclude whether the market is more bullish or bearish.
⭐ 6. Visual Plotting:
The script uses plotcandle to display the non-overlay signals at different levels for each condition, stacked vertically from MA20 to PSAR. Additionally, a master candle combines all indicators to show an overall market trend.
⭐ 7. Neon Effect on MA20:
It adds a neon-like effect to the MA20 line, making it visually prominent: A standard plot line with the base color. Two additional neon layers with increasing transparency to enhance the effect.
⭐ 8. Daily Timeframes and Lookahead:
The script fetches daily data using the lookahead feature to get a broader view of the market trend. It tracks the previous day’s and two days' data for comparison.
⭐ 9. Labels and Customization:
The script dynamically adds labels to the chart for the different plotted indicators at the last bar, making it easier to identify which indicator is being represented.
🚀 Conclusion:
The script combines multiple technical indicators, such as EMA, RSI, VWAP, PSAR, and multi-day moving averages, to visually assess bullish and bearish market conditions. It uses color-coded candlesticks to represent each indicator and sums up the signals to determine the overall trend.
Анализ свечей

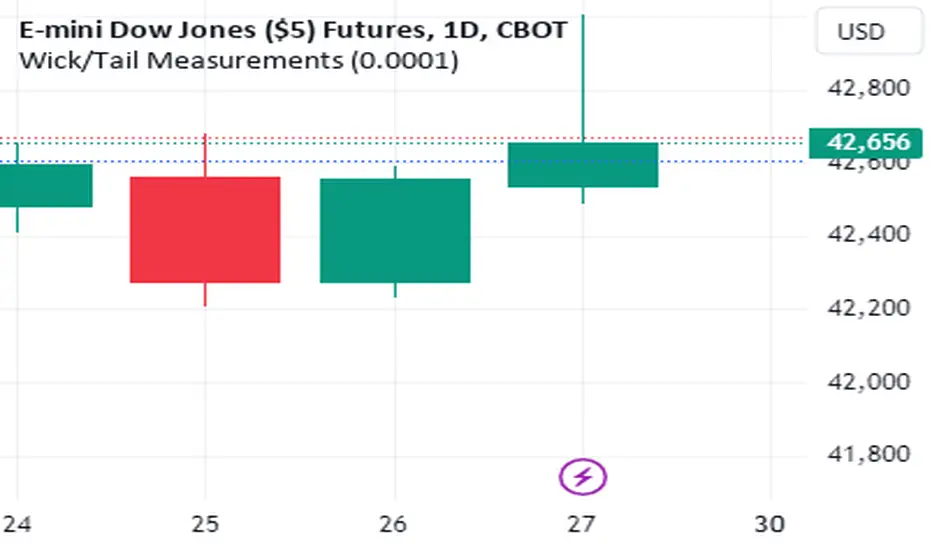
Wick/Tail Candle MeasurementsThis indicator runs on trading view. It was programmed with pine script v5.
Once the indicator is running you can scroll your chart to any year or date on the chart, then for the input select the date your interested in knowing the length of the tails and wicks from a bar and their lengths are measured in points.
To move the measurement, you can select the vertical bar built into the indicator AFTER clicking the green label and moving it around using the vertical bar *only*. You must click the vertical bar in the middle of the label to move the indicator calculation to another bar. You can also just select the date using the input as mentioned. This indicator calculates just one bar at a time.
measurements are from bar OPEN to bar HIGH for measured WICKS regardless of the bar being long or short and from bar OPEN to bar LOW for measured TAILS also regardless of the bar being long or short.
This indicator calculates tails and wicks including the bar body in the calculations. Basically showing you how much the market moved in a certain direction for the entire duration of that Doji candle.
Its designed to measure completed bars on the daily futures charts. (Dow Jones, ES&P500, Nasdaq, Russell 2000, etc) Although it may work well on other markets. The indicator could easily be tweaked in order to work well with other markets. It is not designed for forex markets currently.
Engulfing Candles Alert - Multi Symbol (Miu)This indicator plots triangle shapes on each engulfing candles (bullish or bearish) on current chart.
The main use for this indication is to set alerts on multiple symbols at once.
Please follow steps below to set your alarms:
1) Add indicator to the chart
2) Go to settings
3) Check symbols you want to receive alerts (choose up to 8 different symbols)
4) Check if you want only bullish or bearish alerts or both
5) Once all is set go back to the chart and click on 3 dots to set alert in this indicator, rename your alert and confirm
6) You can remove indicator after alert is set and it'll keep working as expected
What does this indicator do?
This indicator will generate alerts anytime a candle closes and reaches bullish or bearish engulfing condition for any of symbol set.
Alert messages example: "Bullish alert on {Symbol}"
This script requests open and close information for each symbol through request.security() built-in function.
Detailed indicator description:
If current bar open is less than or equal to the previous bar close AND current bar open is less than previous bar open AND current bar close is greater than previous bar open THEN True
bullishEngulfing = (openBarCurrent <= closeBarPrevious) and (openBarCurrent < openBarPrevious) and (closeBarCurrent > openBarPrevious)
The opposite condition will be bearishEngulfing
Feel free to give feedbacks on comments section below. Enhancement suggestions are welcome =).
Enjoy!

Advanced Volume-Driven Breakout SignalsThe "Advanced Volume-Driven Breakout Signals" indicator is a cutting-edge tool designed to help traders identify high-potential trading opportunities through sophisticated volume analysis techniques. This indicator integrates volume flow analysis, moving averages, and Relative Volume (RVOL) to provide a comprehensive view of market conditions, going beyond traditional Volume Spread Analysis (VSA) methods.
Key Features:
Volume Flow Analysis: Distinguishes bullish and bearish volume flows with distinct colors, making it easier to visualize market sentiment and potential breakout points.
Volume Flow Moving Averages: Calculates moving averages for volume using various methods (SMA, EMA, WMA, HMA, VWMA), accommodating different trading strategies. This includes settings for adjusting the type of moving average and its period, as well as thresholds for high, medium, and low volume levels.
Volume Spikes Detection: Identifies significant volume spikes based on user-defined multipliers and moving averages, highlighting unusual trading activity.
Volume MA Cloud Settings: Computes general moving averages of volume to track trends and detect deviations. This feature includes options to select different moving average types and adjust thresholds for detecting high volume activity.
Relative Volume (RVOL): Measures current volume relative to historical averages, triggering signals when RVOL exceeds predefined thresholds, indicating notable changes in trading activity.
Entry Conditions: Provides clear long and short entry signals based on combined volume flow conditions and RVOL, offering actionable trading opportunities.
Volume Visualization:
— Bullish Volume Flow: Light and dark green bars indicate bullish volume flow.
— Bearish Volume Flow: Light and dark red bars denote bearish volume flow.
— High Volume Bars: Highlighted in yellow, and extreme volume bars in orange for additional context. These bars are plotted for visual aid and do not directly influence trade signals, focusing instead on the quality and strength of the volume flow.
Alerts: Allows users to create alert notifications for long and short entry signals when the criteria are met, enabling traders to respond promptly to trading opportunities.
Usage:
Overlay: Apply the indicator directly to your price chart to visualise real-time signals and volume conditions.
Customisable: Adjust settings for moving averages, RVOL, and other parameters to match your trading strategy and preferences.
Comparison to VSA Scripts: The "Advanced Volume-Driven Breakout Signals" indicator extends beyond traditional VSA scripts by incorporating a wider range of analytical features. While VSA primarily focuses on volume spread patterns and price action, this indicator offers enhanced functionality with advanced RVOL metrics, customizable moving averages, and detailed volume spike detection, making it a more versatile tool for identifying breakout opportunities and managing trades. It is particularly effective when used alongside key levels and order blocks.
Acknowledgements: Special thanks to @oh92 and @goofoffgoose for their invaluable scripts, which served as inspiration in the development of this advanced trading indicator.
Notes: The script is continually evolving, with ongoing refinements aimed at enhancing accuracy and performance.

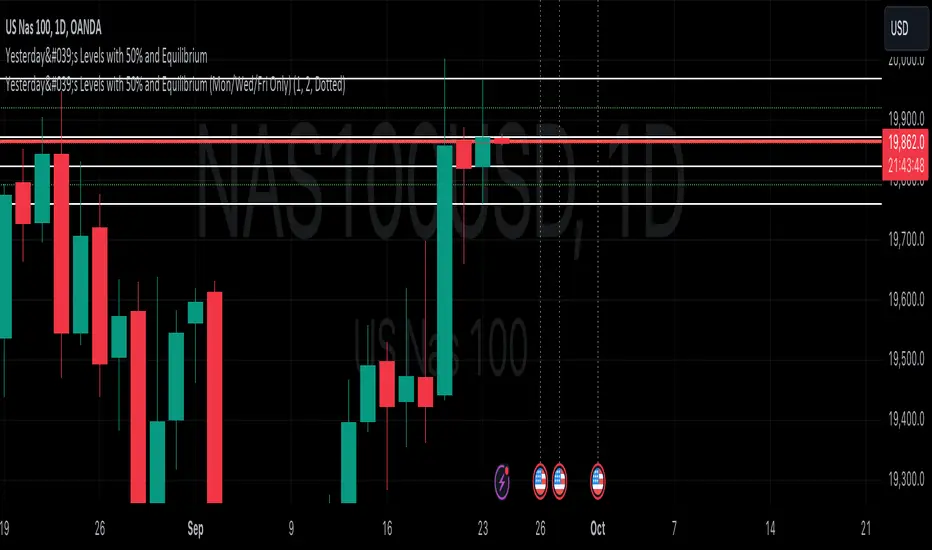
Yesterday's Levels with 50% wick and Equilibrium## Script Description
This Pine Script indicator highlights key levels from the previous day’s daily candle on any timeframe chart. It focuses exclusively on marking the following:
1. **Previous Day’s High, Low, Open, and Close**:
- Horizontal lines are drawn to indicate the previous day's high, low, open, and close prices.
- These lines are white and extend across the chart.
2. **50% of Candle Wicks**:
- If the previous day’s candle has wicks, two additional lines mark 50% of the top wick and 50% of the bottom wick.
- These lines are green and dotted, representing half the wick’s height.
3. **Equilibrium (50% of the Full Candle)**:
- A horizontal red line marks the midpoint (equilibrium) of the entire previous day’s candle, from high to low.
- This line is thicker than the others to emphasize the equilibrium level.
The script works by focusing only on the previous day’s daily candle, ensuring that it doesn’t plot lines for any older candles. These levels are visible on all timeframes.
Optimized Heikin Ashi Strategy with Buy/Sell OptionsStrategy Name:
Optimized Heikin Ashi Strategy with Buy/Sell Options
Description:
The Optimized Heikin Ashi Strategy is a trend-following strategy designed to capitalize on market trends by utilizing the smoothness of Heikin Ashi candles. This strategy provides flexible options for trading, allowing users to choose between Buy Only (long-only), Sell Only (short-only), or using both in alternating conditions based on the Heikin Ashi candle signals. The strategy works on any market, but it performs especially well in markets where trends are prevalent, such as cryptocurrency or Forex.
This script offers customizable parameters for the backtest period, Heikin Ashi timeframe, stop loss, and take profit levels, allowing traders to optimize the strategy for their preferred markets or assets.
Key Features:
Trade Type Options:
Buy Only: Enter a long position when a green Heikin Ashi candle appears and exit when a red candle appears.
Sell Only: Enter a short position when a red Heikin Ashi candle appears and exit when a green candle appears.
Stop Loss and Take Profit:
Customizable stop loss and take profit percentages allow for flexible risk management.
The default stop loss is set to 2%, and the default take profit is set to 4%, maintaining a favorable risk/reward ratio.
Heikin Ashi Timeframe:
Traders can select the desired timeframe for Heikin Ashi candle calculation (e.g., 4-hour Heikin Ashi candles for a 1-hour chart).
The strategy smooths out price action and reduces noise, providing clearer signals for entry and exit.
Inputs:
Backtest Start Date / End Date: Specify the period for testing the strategy’s performance.
Heikin Ashi Timeframe: Select the timeframe for Heikin Ashi candle generation. A higher timeframe helps smooth the trend, which is beneficial for trading lower timeframes.
Stop Loss (in %) and Take Profit (in %): Enable or disable stop loss and take profit, and adjust the levels based on market conditions.
Trade Type: Choose between Buy Only or Sell Only based on your market outlook and strategy preference.
Strategy Performance:
In testing with BTC/USD, this strategy performed well in a 4-hour Heikin Ashi timeframe applied on a 1-hour chart over a period from January 1, 2024, to September 12, 2024. The results were as follows:
Initial Capital: 1 USD
Order Size: 100% of equity
Net Profit: +30.74 USD (3,073.52% return)
Percent Profitable: 78.28% of trades were winners.
Profit Factor: 15.825, indicating that the strategy's profitable trades far outweighed its losses.
Max Drawdown: 4.21%, showing low risk exposure relative to the large profit potential.
This strategy is ideal for both beginner and advanced traders who are looking to follow trends and avoid market noise by using Heikin Ashi candles. It is also well-suited for traders who prefer automated risk management through the use of stop loss and take profit levels.
Recommended Use:
Best Markets: This strategy works well on trending markets like cryptocurrency, Forex, or indices.
Timeframes: Works best when applied to lower timeframes (e.g., 1-hour chart) with a higher Heikin Ashi timeframe (e.g., 4-hour candles) to smooth out price action.
Leverage: The strategy performs well with leverage, but users should consider using 2x to 3x leverage to avoid excessive risk and potential liquidation. The strategy's low drawdown allows for moderate leverage use while maintaining risk control.
Customization: Traders can adjust the stop loss and take profit percentages based on their risk appetite and market conditions. A default setting of a 2% stop loss and 4% take profit provides a balanced risk/reward ratio.
Notes:
Risk Management: Traders should enable stop loss and take profit settings to maintain effective risk management and prevent large drawdowns during volatile market conditions.
Optimization: This strategy can be further optimized by adjusting the Heikin Ashi timeframe and risk parameters based on specific market conditions and assets.
Backtesting: The built-in backtesting functionality allows traders to test the strategy across different market conditions and historical data to ensure robustness before applying it to live trading.
How to Apply:
Select your preferred market and chart.
Choose the appropriate Heikin Ashi timeframe based on the chart's timeframe. (e.g., use 4-hour Heikin Ashi candles for 1-hour chart trends).
Adjust stop loss and take profit based on your risk management preference.
Run backtesting to evaluate its performance before applying it in live trading.
This strategy can be further modified and optimized based on personal trading style and market conditions. It’s important to monitor performance regularly and adjust settings as needed to align with market behavior.

First 5-Minute ORB Levels with Hour Offset### Indicator Overview: First 5-Minute ORB Levels with Hour Offset
This indicator is designed for traders who want to track the high and low of the first 5-minute candle of a trading session, specifically starting at 9:30 am EST (New York time) by default. The lines representing these levels, known as the "Opening Range Breakout" (ORB) levels, are extended across the trading session until the market close at 4:00 pm EST. The indicator provides the following features:
1. **Real-Time Updates**:
- As the first 5-minute candle of the session forms (from 9:30 am to 9:35 am EST), the indicator dynamically updates the high and low lines.
- After the candle completes, the lines are locked in place and extend horizontally across the chart until market close.
2. **Customizable Hour Offset**:
- Users can adjust the start time of the session by specifying an hour offset. This feature is particularly useful for traders operating in different time zones or those who want to analyze custom session times.
- For example, if you trade in a time zone where the session starts at 8:30 am local time instead of 9:30 am EST, you can set the hour offset to `-1` to adjust the start time accordingly.
3. **Visual Labels**:
- The indicator places labels at the end of the lines, clearly marking the "5m ORB High" and "5m ORB Low" levels. These labels are updated in real-time as the first 5-minute candle forms and are fixed in place once the candle closes.
### How to Adjust the Settings:
1. **Hour Offset**:
- **Description**: The hour offset allows you to shift the start time of the session. The default start time is 9:30 am EST, but you can change this using the hour offset.
- **How to Adjust**:
- Open the indicator settings.
- Locate the "Hour Offset" field.
- Enter a positive or negative integer value to shift the session start time.
- **Example**:
- `0` (default): Start at 9:30 am EST.
- `-1`: Start at 8:30 am EST.
- `+1`: Start at 10:30 am EST.
- The indicator will then track the first 5-minute candle starting at the adjusted time and plot the high and low accordingly.
2. **Line and Label Appearance**:
- The lines representing the ORB levels are green by default, and the labels are also green with white text for clear visibility on the chart. The labels are positioned to the right of the lines to avoid cluttering the chart.
### Use Cases:
- **Opening Range Breakout Strategy**: Traders often use the ORB strategy to identify potential breakout points during the trading day. By marking the high and low of the first 5-minute candle, this indicator helps traders quickly identify key levels where price might break out or reverse.
- **Custom Session Analysis**: If you trade in a different time zone or need to analyze a different session (e.g., pre-market or after-hours), the hour offset feature allows you to adapt the indicator to your needs.
This indicator is particularly valuable for intraday traders who rely on the initial volatility of the trading session to make informed decisions.

Multi-Asset Cross Timeframe Divergence Ind. (MACDI) // AlgoFyreThe Multi-Asset Cross Timeframe Divergence Indicator (MACDI) identifies divergences in momentum like RSI across multiple assets and timeframes. It visually highlights lagging correlated asset momentum divergences, helping traders spot inefficiencies and potential trade opportunities in the following asset.
🔶 KEY FEATURES
🔸Average Momentum Trendline for Each Timeframe
The Average Momentum Trendline feature calculates the average momentum of multiple assets over specified timeframes. It uses smoothed values to determine the momentum trend for each timeframe on the average aggregated momentum of both assets. This trendline helps traders identify the overall direction of the market momentum, providing a clearer picture of potential price movements.
🔸Real-time Divergence Indication and Alert Table
The Real-time Divergence Indications and Alert Table feature visualizes detected divergences between the momentum values of the two assets across different timeframes. It identifies both bullish and bearish divergences, signaling lagging reversals in the the following asset and potential trading opportunities. When a divergence is detected, the system generates real-time visual indications on the chart and in an overview table for traders to act promptly. The alert table provides a comprehensive overview of all detected divergences, making it easier for traders to monitor and respond to market changes.
🔸Color and Size Based Labels on Price Chart based on Divergence Type
The Color and Size Based Labels feature visually represents divergences directly on the price chart. Bullish and bearish divergences are marked with distinct colors and sizes, making them easily identifiable at a glance. Larger labels indicate higher timeframes and thus generally more significance.
🔶 INSTRUCTION GUIDELINES
🔸Identify Divergence Clusters
The more divergences align, the higher the probability of a potential trend reversal in the asset. When multiple multi-timeframe divergences occur in both lower and higher timeframes within a local cluster, the probability of a reversal increases. This is valid for both for bullish and bearish divergences.
🔸Spot Low Probability Divergences
To further increase the probability, analyze the current state of the average momentum trendline. For a bullish reversal, a relatively low level of the average momentum trendline is preferred, whereas for a bearish reversal, a relatively high level is preferred.
🔶 INDIVIDUAL CONFIGURATION
🔸Leading Asset
This input allows the user to select the leading asset for the divergence analysis.
🔸Following Asset
This input allows the user to select the following asset for the divergence analysis.
🔸Higher Timeframe
This input sets the higher timeframe for the analysis.
🔸Lower Timeframe
This input sets the lower timeframe for the analysis.
🔸Show RSI Divergence
This input enables or disables the display of RSI divergence signals.
🔸RSI Length
This input sets the length of the RSI calculation.
🔸RSI Source
This input sets the source data for the RSI calculation (e.g., close price).
🔸RSI Smoothing Length
This input sets the length of the smoothing applied to the RSI values.
🔸Smoothing Method
This input sets the method used for smoothing the RSI values.
🔶 CONCLUSION
The Multi-Asset Cross Timeframe Divergence Indicator (MACDI) is a powerful tool for identifying momentum divergences across multiple assets and timeframes. Its visual cues and customizable table make it easy to use and interpret, providing valuable insights for trading decisions.

[ROC3] Rate of Change Candle ColorROC is a statistical indicator which tracks how much a security's price has changed over a certain period, showing whether momentum is picking up or slowing down. It’s a handy tool because it helps traders spot trend changes and understand how strong a trend is.
My ROC3 indicator will color the candlesticks based on the Rate of Change (ROC) and its Exponential Moving Average (EMA). This indicator helps traders visually identify bullish and bearish trends by applying color to the candles, making it easier to spot momentum shifts and trend changes.
How It Works:
Rate of Change (ROC): Calculates the percentage change in the price over a specified number of bars. This indicator measures the speed at which price changes.
EMA of ROC: Applies an Exponential Moving Average to the ROC values to provide a smoothed benchmark. The EMA helps to reduce noise and make trend identification more reliable.
Coloring Logic:
Bullish Candles (Green): When the current ROC is higher than the EMA of the ROC.
Bearish Candles (Red): When the current ROC is lower than the EMA of the ROC.
Settings:
ROC Length (Default: 60): The number of bars used to calculate the Rate of Change. Adjust this parameter to change the sensitivity of the ROC calculation.
ROC EMA Length (Default: 7): The number of bars used to calculate the Exponential Moving Average of the ROC. This length determines how smooth the EMA is. A shorter length reacts faster to price changes, while a longer length provides a smoother, slower response.
How to Use:
Apply the Indicator: Add the Rate of Change Candle Color indicator to your TradingView chart.
Interpret the Colors:
Green Candles: Indicate bullish momentum. The current ROC is greater than its EMA, suggesting upward pressure.
Red Candles: Indicate bearish momentum. The current ROC is less than its EMA, suggesting downward pressure.
Adjust Settings: Customize the ROC Length and ROC EMA Length based on your trading strategy. Shorter ROC lengths may capture more short-term trends, while longer lengths provide a broader view.
Combine with Other Indicators: Use the in conjunction with other technical indicators or chart patterns to enhance your trading analysis.
Example Use Case:
Trend Confirmation: Use the color changes to confirm bullish or bearish trends. Green candles can confirm uptrends, while red candles may signal downtrends or potential reversals.
Momentum Analysis: Monitor how frequently the ROC crosses above or below its EMA to gauge momentum strength and make informed trading decisions.
Note:
This indicator is designed to assist with trend analysis and should be used as part of a broader trading strategy. Always conduct your own research and analysis before making trading decisions.
Cherio...

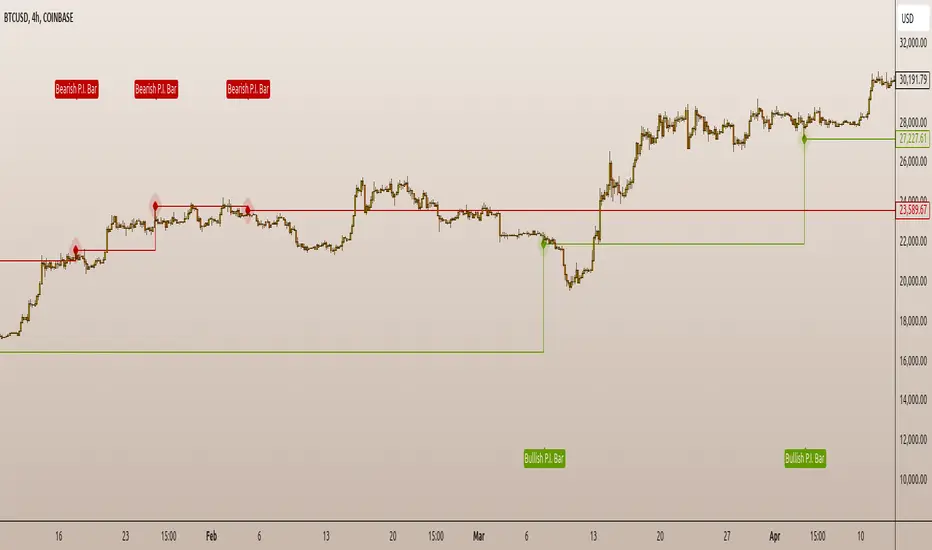
P.I.B. System (Pin Bar | Inside Bar) // AlgoFyreThe "P.I.B. System (Pin Bar | Inside Bar)" identifies bullish and bearish pin bars and inside bars on a price chart. It highlights potential market reversals by plotting labels and colorizing bars, providing traders with visual cues for better decision-making.
Description
The "P.I.B. System (Pin Bar | Inside Bar)" script is designed to help traders identify potential reversal points in the market by detecting bullish and bearish pin bars and inside bars. A pin bar is a candlestick pattern that indicates a potential reversal, characterized by a small body and a long wick. Inside bars are candlestick patterns where the current bar's high and low are within the previous bar's range, indicating potential consolidation before a breakout.
This script allows customization of various parameters to fine-tune the identification of pin bars and inside bars. When a pin bar or an inside bar is detected, the script plots a label on the chart and colorizes the bars to highlight these patterns. This tool is useful for traders looking to identify potential reversal points and make informed trading decisions.
Explanation of All Options
Pin-Wick Size Ratio Minimum Value : The minimum ratio of the wick size to the total candle size for a pin bar to be considered valid. Default is 0.66.
Candle Body Size Ratio Maximum Value : The maximum ratio of the body size to the total candle size for a pin bar to be considered valid. Default is 0.4.
Handle-Wick Wick Size Ratio Maximum Value : The maximum ratio of the opposite wick size to the total candle size for a pin bar to be considered valid. Default is 0.4.
Filter Out Small Candles : Option to filter out small candles based on the previous candle's size. Default is true.
Small Candle Size Ratio : The ratio used to determine if a candle is considered small compared to the previous candle. Default is 2.0.
Identify Inside Bars : Option to identify inside bars following a pin bar. Default is true.
Show Only P.I.B. : Option to show only the bars where a pin bar is followed by an inside bar. Default is true.
Hide Horizontal Rays : Option to hide horizontal rays drawn from the last identified pin bars. Default is false.
How to Use
To use this script, add it to your chart. Customize the input parameters to match your trading strategy. The script will automatically identify and highlight bullish and bearish pin bars and inside bars on the chart. Use the visual cues provided by the labels and colorized bars to make informed trading decisions.
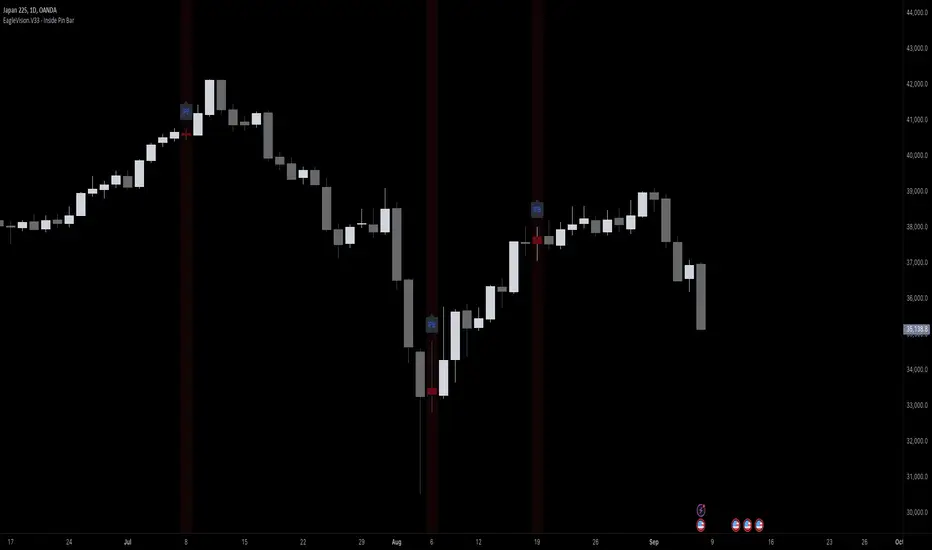
EagleVision.V33 - Inside Pin Bar EagleVision.V33 is a specialized indicator designed for traders who focus on price action. It detects and highlights the Inside Pin Bar candle pattern, a key signal that can indicate potential market reversals or trend continuations. This tool is invaluable for traders who rely on precise candlestick patterns to make data-driven decisions.
Features:
• Customizable Pattern Highlighting: EagleVision.V33 allows traders to choose custom colors to highlight Inside Pin Bar patterns directly on the chart. This makes identifying critical trading signals straightforward, even in busy market conditions.
• Pin Bar Candle Customization: Beyond just highlighting, the indicator enables users to change the color of the detected pin bar itself, ensuring that crucial patterns are immediately visible and easy to track.
• Versatile Timeframe Application: The indicator can be applied across various timeframes, from intraday (1 minute, 5 minutes) to longer-term charts (daily, weekly). Users can easily switch between timeframes within the settings, making it adaptable to different trading strategies.
• Enhanced Visual Clarity with Background Highlighting: For traders who prefer additional emphasis, EagleVision.V33 offers an option to apply a background color that highlights the entire region where the Inside Pin Bar pattern is detected.
How It Works:
• Inside Bar Identification: The indicator first identifies an Inside Bar, where a candle’s high and low fall within the range of the preceding candle (the mother bar). This is a foundational pattern in price action trading.
• Pin Bar Detection: It then checks if the candle is a Pin Bar, characterized by a small body and a prominent wick (either upper or lower), which typically signals potential market turning points.
• Pattern Highlighting & Visualization: Upon detecting both conditions (Inside Bar and Pin Bar), EagleVision.V33 highlights the pattern using customizable shapes and colors, and optionally applies a background shade to further enhance visibility.
Use Cases:
• Reversals at Key Levels: The Inside Pin Bar pattern often appears at significant support or resistance levels, signaling potential reversals. EagleVision.V33 helps traders spot these opportunities early.
• Trend Continuations: In trending markets, this pattern can confirm the continuation of a trend, providing traders with the confidence to hold positions or enter new ones.
Customization Options:
• Pattern Highlight Color: Choose a distinct color for the label or shape that marks the Inside Pin Bar pattern, making it stand out against other chart elements.
• Pin Bar Candle Color: Customize the color of the Pin Bar itself, ensuring that it is immediately recognizable on the chart.
• Background Highlighting: Optionally apply a background color to the chart area where the pattern is detected, further enhancing visual clarity and making it easier to spot potential trading opportunities.
Why EagleVision.V33 Stands Out:
EagleVision.V33 is not just another pattern detection tool; it’s engineered for precision and clarity, with highly customizable features that cater to the unique needs of price action traders. By combining both Inside Bar and Pin Bar detection, it offers a powerful edge, providing traders with actionable insights directly on their charts.
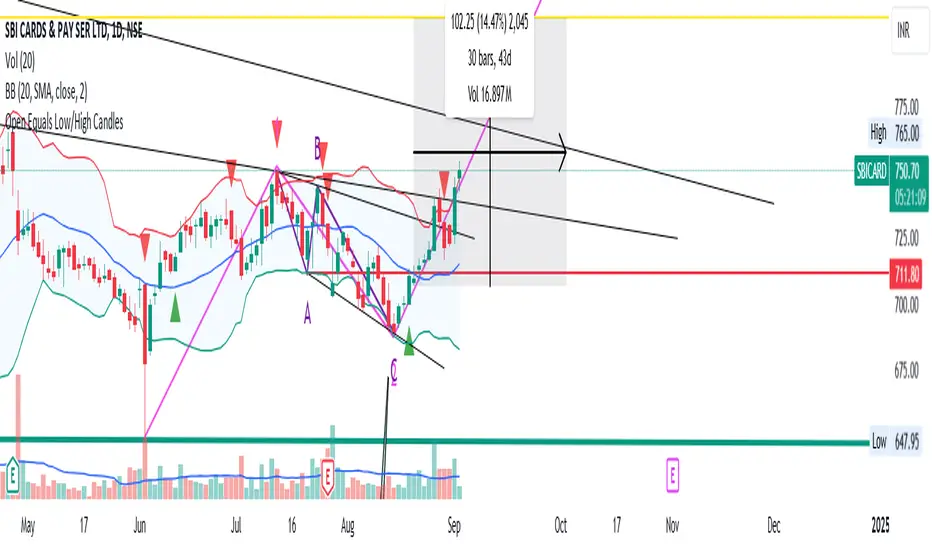
Open Equals Low/High Candles
This Indicator basically helps us to get the candles where Open = Low & Open =High.
Significance:
1) Open = Low Candles
----> Such candles are very powerful, as the Open = Low marks that there aren't any sellers left below the price on that day. Denoting BULLS power and aggression.
2) Open = High Candles
----> Open = High Candles signify that as soon as the markets opened, Bears were very strong, and no buyers left above the opening price for that candle. Denoting Strong BEARISH sentiment and aggression.
PS: This indicator can be used across all timeframes and indices. As it is purely based on Price-Action study.
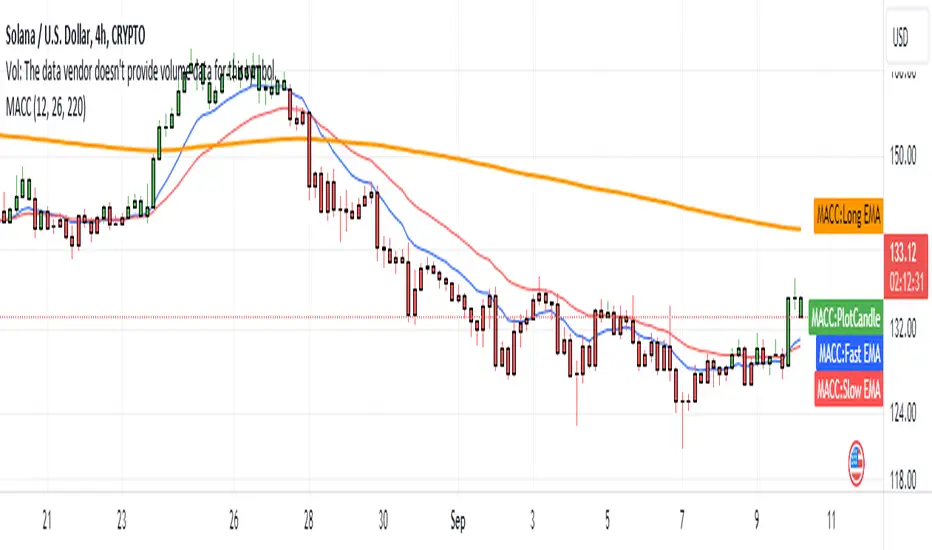
[MACC] Moving Average Candle ColorThe simplest trading framework is using moving average. This indicator is harnessing that very method.
What It Does:
This indicator helps you see market trends at a glance by changing the color of the candlesticks based on the relationship between two Exponential Moving Averages (EMAs). When the 9-period EMA is above the 21-period EMA, candlesticks turn green, suggesting a bullish trend. When the 9 EMA is below the 21 EMA, candlesticks turn red, indicating a bearish trend.
Why You'll Love It:
Easy Trend Visualization: Quickly spot trends and potential reversals with color-coded candlesticks.
Customizable Settings: Adjust the lengths of the EMAs to fit your trading style. Just change the values in the settings panel and watch the indicator update in real-time.
Optional EMA Lines: See the EMA lines plotted on your chart for added context and trend confirmation.
How to Use It:
Green Candlesticks: It’s a sign that the trend is likely upward.
Red Candlesticks: signaling a potential downward trend.
Customization:
EMA Lengths: You can set the lengths for the 9 EMA and 21 EMA to whatever fits your trading strategy best.
Colors: Adjust the colors if you want to match your chart’s theme.
Get Started: Add this indicator to your TradingView chart and tweak the settings to see how it helps you track market trends more effectively.
Cherio...
Custom Opening Price Levels (PO3)This indicator is designed to assist the trader in identifying the Power of Three through the opens of the candles.
-------------------------
The PO3 is a concept introduced by ICT. First, you need to have a directional bias for the month or the specific candle in question. It should be of high time frame (HTF BIAS).
At the open of the specific candle, the market will generate interest in the direction opposite to the HTF BIAS, accumulating positions. It will then manipulate the positions of less informed traders to generate the necessary liquidity to fill informed operators positions.
Finally, positions are distributed in favor of the bias.
-------------------------
The PO3 is a phenomenon that repeats across all timeframes. This indicator is highly customizable and allows the user to choose from a range of timeframes: 3 months, 1 month, 1 week, 1 day, and 3 hours. The indicator displays the last 3 opens for the selected period.
-------------------------
The script is open-source, so feel free to add more timeframes or open levels if you have coding skills.

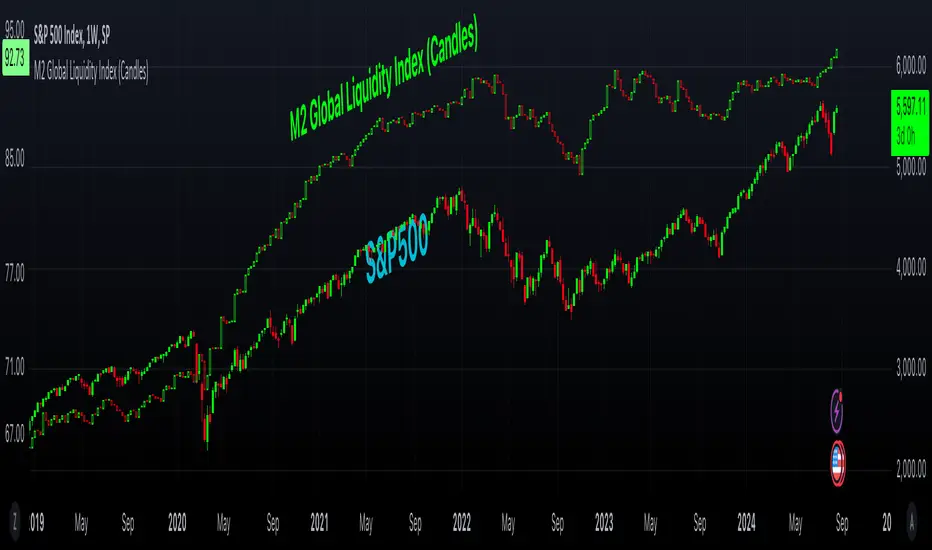
M2 Global Liquidity Index (Candles)M2 Global Liquidity Index (Candles)
In this enhanced version of the original M2 Global Liquidity Index script by Mik3Christ3ns3n , I've taken the foundational concept and expanded its capabilities for more in-depth analysis and user flexibility. This updated script aggregates M2 money supply data from major global economies—China, the U.S., the Eurozone, Japan, and the U.K.—adjusted by their respective exchange rates, into a customizable global liquidity index.
Key Enhancements:
Candlestick Visualization:
• Instead of a simple line chart, I've implemented a candlestick chart, providing a more detailed representation of liquidity trends with open, high, low, and close values for each period. This allows traders to analyze the index with the same technical tools used for price charts.
Customizable Components:
• Users can now select which components (M2 data and exchange rates) to include in the index calculation, giving you the flexibility to tailor the index to specific economic factors or regions of interest.
Dynamic Color Coding:
• Candles are color-coded based on their performance (bullish or bearish), with customized wick and border colors to enhance visual clarity, making it easier to spot liquidity trends at a glance.
Overlay Option:
• This script is designed to be an overlay, allowing you to plot the Global Liquidity Index directly on your price charts, facilitating comparison between liquidity trends and asset prices.
This enhanced script is ideal for traders and analysts who want a deeper understanding of global liquidity trends and their impact on financial markets.
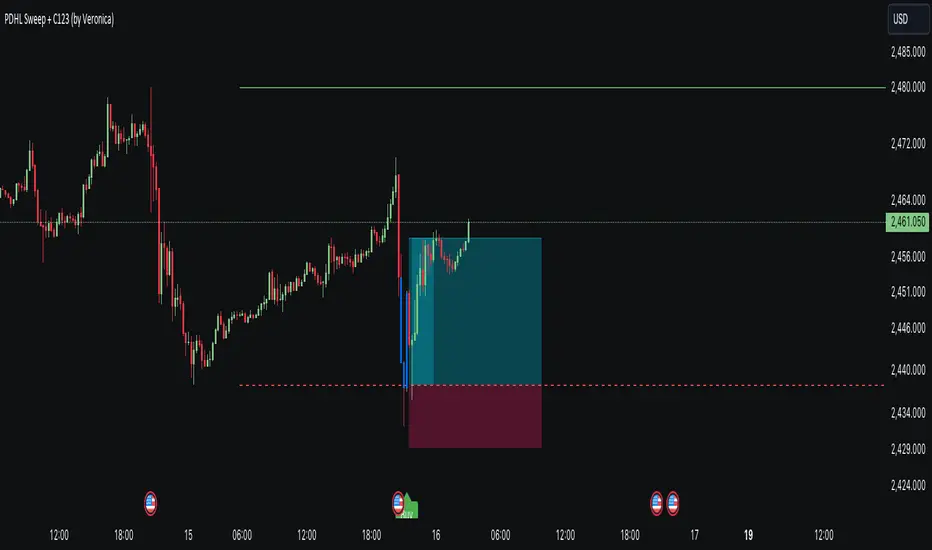
PDHL Sweep + C123 (by Veronica)The "PDHL Sweep + C123" is an indicator to identify potential reversal or continuation patterns in the market by combining key price levels from the previous day with a custom three-candle pattern analysis.
Key Features:
1. Previous Day High/Low Sweep:
The indicator automatically plots horizontal lines marking the previous day's high and low prices.
If the price crosses these key levels, the lines will change from solid to dashed, indicating a potential sweep or breakout.
2. Three-Candle Pattern Analysis:
The indicator identifies specific three-candle patterns that could signal a bullish or bearish setup. The pattern is validated if certain conditions are met, including the relationship between candle bodies and whether the price has crossed the previous day's high or low.
3. Marubozu Condition (Optional):
Users can enable a condition that checks if the Candle 1 and 3 in the pattern is a Marubozu, with a customizable body size percentage.This adds an extra layer of confirmation to the pattern. Default is switch on for both candle 1 and 3.
4. Customizable Alerts:
Users can set alerts for when a "Buy" or "Sell" signal is triggered, allowing them to stay informed of potential trading opportunities without constantly monitoring the charts.
Callout Signals:
When a valid bullish or bearish pattern is identified, the indicator places a "Buy" or "Sell" callout on the chart for clear visual signaling.
5. Customizable colour and text:
Users can customize the color and text of these callouts to suit their preferences.
How to Use:
Bullish Signal: A "Buy" callout will appear when a valid three-candle bullish pattern is detected and the price has crossed below the previous day's low.
Bearish Signal: A "Sell" callout will appear when a valid three-candle bearish pattern is detected and the price has crossed above the previous day's high.
Customize the appearance of the indicator, including line colors, callout colors, and text colors, to match your charting style.
This indicator is ideal for traders who rely on price action and key levels for their trading decisions. It provides clear signals and alerts, helping you stay on top of potential market reversals or continuations.
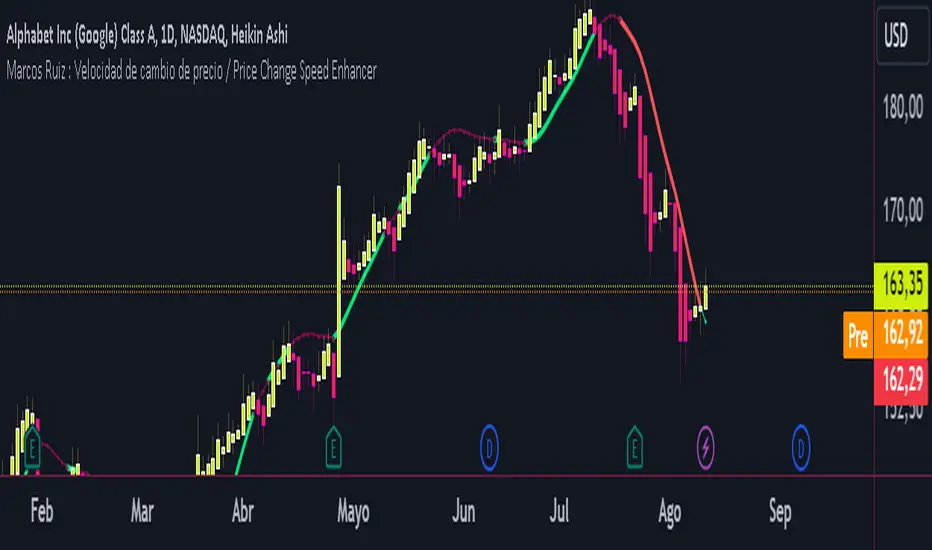
Marcos Ruiz :Price Change Speed Descripción:
Este indicador en Pine Script está diseñado para analizar y visualizar dinámicamente la velocidad de los cambios de precio en un gráfico de TradingView. El indicador permite a los usuarios seleccionar diferentes tipos de medias móviles y fuentes de precios para calcular y mostrar el cambio porcentual en el precio durante un período especificado
Características:
Selección de Fuente de Precio: Elige entre cierre, apertura, alto, o bajo para los cálculos de precios
Tipos de Media Móvil: Selecciona entre SMA, WMA, EMA, HMA, o VWMA para determinar la media móvil utilizada en el cálculo de la velocidad promedio
Coloreado Dinámico: El color de la línea de la media móvil cambia según la velocidad de cambio de precio
Aumento de Velocidad: Cuando la velocidad del cambio de precio está aumentando, la media móvil se colorea según upColor definido por el usuario
Disminución de Velocidad: Cuando la velocidad está disminuyendo, la media móvil se colorea según downColor definido por el usuario
Posición Neutral: Coloreado adicional para escenarios donde el precio está por encima o por debajo de la media móvil, pero no cumple con las condiciones de aumento/disminución
Factor de Refuerzo: Ajusta la sensibilidad del cálculo del cambio de velocidad
Uso:
Parámetros de Entrada:
Define el Período para establecer la ventana de retroceso para calcular la velocidad
Elige la Fuente de Precio para determinar qué datos de precios usar
Selecciona el Tipo de Media Móvil y ajusta la Longitud de EMA para la comparación
Interpretación:
El indicador traza la media móvil seleccionada con colores dinámicos basados en la velocidad calculada del cambio de precio
Los cambios positivos y negativos en la velocidad se indican con diferentes colores, proporcionando una representación visual del momento y la fuerza de la tendencia del precio
Nota: Este script es el resultado de un desarrollo y pruebas extensivas. Se agradecen mucho sus comentarios y contribuciones
Description:
This Pine Script indicator is designed to dynamically analyze and visualize the speed of price changes on a TradingView chart. The indicator allows users to select different moving average types and price sources to compute and display the percentage change in price over a specified period
Features:
Price Source Selection: Choose from close, open, high, or low for price calculations
Moving Average Types: Select from SMA, WMA, EMA, HMA, or VWMA to determine the moving average used for computing average speed
Dynamic Coloring: The moving average line's color changes based on the speed of price change
Increasing Speed: When the price change speed is increasing, the moving average is colored according to the user-defined upColor
Decreasing Speed: When the speed is decreasing, the moving average is colored according to the user-defined downColor
Neutral Position: Additional coloring for scenarios where the price is above or below the moving average but not meeting the increase/decrease conditions
Reinforcement Factor: Adjusts the sensitivity of the speed change calculation
Usage:
Input Parameters:
Set the Period to define the lookback window for calculating speed
Choose the Price Source to determine which price data to use
Select the Moving Average Type and adjust the EMA Length for comparison
Interpretation:
The indicator plots the selected moving average with dynamic colors based on the calculated speed of price change
Positive and negative changes in speed are indicated by different colors, providing a visual representation of price momentum and trend strength
Note: This script is the result of extensive development and testing. Your feedback and contributions are highly appreciated
Swing Trend AnalysisIntroducing the Swing Trend Analyzer: A Powerful Tool for Swing and Positional Trading
The Swing Trend Analyzer is a cutting-edge indicator designed to enhance your swing and positional trading by providing precise entry points based on volatility contraction patterns and other key technical signals. This versatile tool is packed with features that cater to traders of all timeframes, offering flexibility, clarity, and actionable insights.
Key Features:
1. Adaptive Moving Averages:
The Swing Trend Analyzer offers multiple moving averages tailored to the timeframe you are trading on. On the daily chart, you can select up to four different moving average lengths, while all other timeframes provide three moving averages. This flexibility allows you to fine-tune your analysis according to your trading strategy. Disabling a moving average is as simple as setting its value to zero, making it easy to customize the indicator to your needs.
2. Dynamic Moving Average Colors Based on Relative Strength:
This feature allows you to compare the performance of the current ticker against a major index or any symbol of your choice. The moving average will change color based on whether the ticker is outperforming or underperforming the selected index over the chosen period. For example, on a daily chart, if the 21-day moving average turns blue, it indicates that the ticker has outperformed the selected index over the last 21 days. This visual cue helps you quickly identify relative strength, a key factor in successful swing trading.
3. Visual Identification of Price Contractions:
The Swing Trend Analyzer changes the color of price bars to white (on a dark theme) or black (on a light theme) when a contraction in price is detected. Price contractions are highlighted when either of the following conditions is met: a) the current bar is an inside bar, or b) the price range of the current bar is less than the 14-period Average Daily Range (ADR). This feature makes it easier to spot price contractions across all timeframes, which is crucial for timing entries in swing trading.
4. Overhead Supply Detection with Automated Resistance Lines:
The indicator intelligently detects the presence of overhead supply and draws a single resistance line to avoid clutter on the chart. As price breaches the resistance line, the old line is automatically deleted, and a new resistance line is drawn at the appropriate level. This helps you focus on the most relevant resistance levels, reducing noise and improving decision-making.
5. Buyable Gap Up Marker: The indicator highlights bars in blue when a candle opens with a gap that remains unfilled. These bars are potential Buyable Gap Up (BGU) candidates, signaling opportunities for long-side entries.
6. Comprehensive Swing Trading Information Table:
The indicator includes a detailed table that provides essential data for swing trading:
a. Sector and Industry Information: Understand the sector and industry of the ticker to identify stocks within strong sectors.
b. Key Moving Averages Distances (10MA, 21MA, 50MA, 200MA): Quickly assess how far the current price is from key moving averages. The color coding indicates whether the price is near or far from these averages, offering vital visual cues.
c. Price Range Analysis: Compare the current bar's price range with the previous bar's range to spot contraction patterns.
d. ADR (20, 10, 5): Displays the Average Daily Range over the last 20, 10, and 5 periods, crucial for identifying contraction patterns. On the weekly chart, the ADR continues to provide daily chart information.
e. 52-Week High/Low Data: Shows how close the stock is to its 52-week high or low, with color coding to highlight proximity, aiding in the identification of potential breakout or breakdown candidates.
f. 3-Month Price Gain: See the price gain over the last three months, which helps identify stocks with recent momentum.
7. Pocket Pivot Detection with Visual Markers:
Pocket pivots are a powerful bullish signal, especially relevant for swing trading. Pocket pivots are crucial for swing trading and are effective across all timeframes. The indicator marks pocket pivots with circular markers below the price bar:
a. 10-Day Pocket Pivot: Identified when the volume exceeds the maximum selling volume of the last 10 days. These are marked with a blue circle.
b. 5-Day Pocket Pivot: Identified when the volume exceeds the maximum selling volume of the last 5 days. These are marked with a green circle.
The Swing Trend Analyzer is designed to provide traders with the tools they need to succeed in swing and positional trading. Whether you're looking for precise entry points, analyzing relative strength, or identifying key price contractions, this indicator has you covered. Experience the power of advanced technical analysis with the Swing Trend Analyzer and take your trading to the next level.

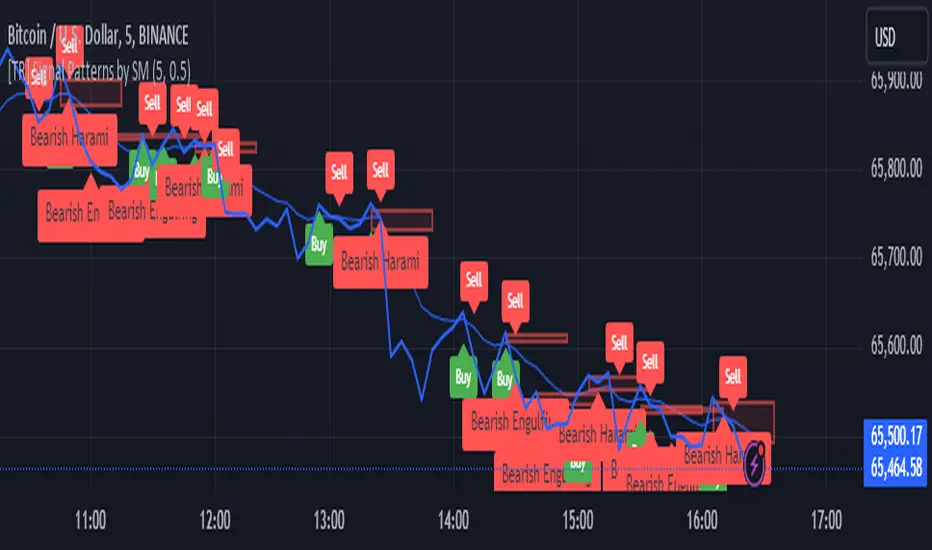
[TR] Engulf Patterns by SM
Engulf Pattern by SM
Overview:
The " Engulf Pattern by SM" script is designed to identify bullish and bearish engulfing candlestick patterns on TradingView charts. Engulfing patterns are significant in technical analysis as they often indicate potential reversals in market trends.
Features:
- Bullish Engulfing Pattern Detection: The script identifies bullish engulfing patterns, which occur when a larger bullish candle completely engulfs the body of the previous smaller bearish candle.
- Bearish Engulfing Pattern Detection: Similarly, it detects bearish engulfing patterns, where a larger bearish candle engulfs the body of the preceding smaller bullish candle.
- Body Size Filtering: The script includes a feature to filter patterns based on the size of the candle bodies, allowing for more precise marking of significant patterns.
- Visual Markers: The script plots visual markers on the chart to highlight the detected engulfing patterns, making it easy for traders to spot them.
How It Works:
1. Bullish Engulfing Pattern:
- The script checks for a smaller bearish candle followed by a larger bullish candle.
- The body of the bullish candle must completely cover the body of the bearish candle.
- The size of the bullish candle's body must meet a specified threshold to be considered significant.
2. Bearish Engulfing Pattern:
- The script looks for a smaller bullish candle followed by a larger bearish candle.
- The body of the bearish candle must completely engulf the body of the bullish candle.
- The size of the bearish candle's body must meet a specified threshold to be considered significant.
Usage:
- Add the Script: Apply the " Engulf Pattern by SM" script to your TradingView chart.
- Configure Settings: Customize the script settings to suit your trading strategy, including visual marker styles and body size thresholds.
- Monitor Visual Markers: Keep an eye on the visual markers to identify potential trading opportunities based on engulfing patterns.
Disclaimer:
This script is not intended to be used as a direct entry signal. It should be used as a confluence in your overall trading plan. Always conduct your own analysis and consider multiple factors before making any trading decisions.
Feel free to customize this writeup further to match your specific needs! If you have any other requests or need additional details, just let me know.
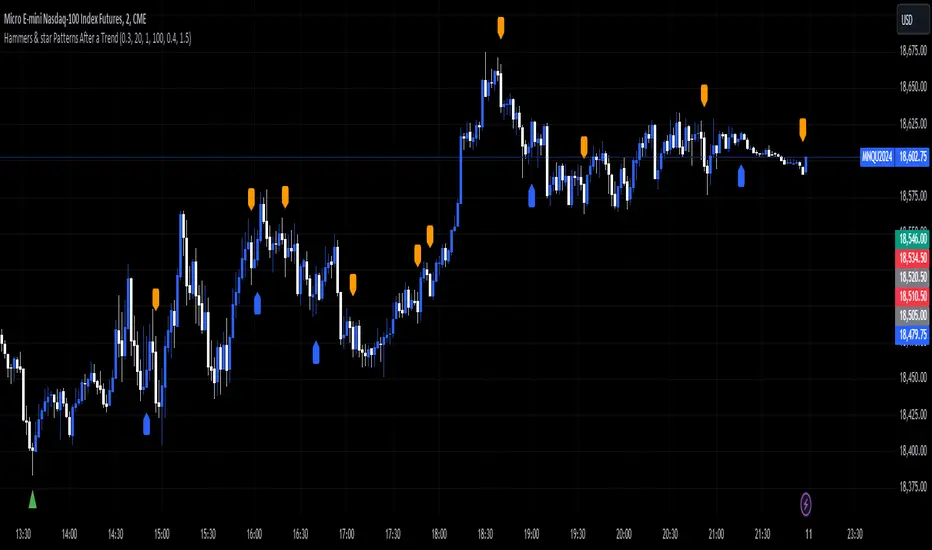
Hammers & star Patterns After a Trend
1. **Candlestick Patterns Detection:**
- **Hammers** and **Inverted Hammers** are specific candlestick patterns that can indicate potential reversals in the market.
- **Hammer**: A candle with a small body and a long lower wick, showing a possible reversal after a downtrend.
- **Inverted Hammer**: A candle with a small body and a long upper wick, indicating a possible reversal after an uptrend.
2. **Volume Consideration:**
- The script checks if these patterns occur with **high trading volume**. If the volume is significantly higher than the average volume over a certain period, the pattern is highlighted.
3. **Trend Detection:**
- The script looks for a significant trend before the pattern appears:
- **Downtrend**: A significant downward movement in price is required before a Hammer is considered.
- **Uptrend**: A significant upward movement is required before an Inverted Hammer is considered.
4. **Additional Patterns:**
- **Morning Star** and **Evening Star** patterns are also detected:
- **Morning Star**: A three-candle pattern where the first candle is a large bearish candle, followed by a small-bodied candle, and then a large bullish candle, indicating a potential reversal from downtrend to uptrend.
- **Evening Star**: The opposite pattern, signaling a potential reversal from uptrend to downtrend.
5. **Visual Indicators:**
- The script **plots arrows** and **labels** on the chart to show where these patterns occur:
- **Hammers** and **Inverted Hammers** are marked with triangle arrows.
- **Morning Stars** and **Evening Stars** are marked with labels.
In summary, this script helps traders identify key candlestick patterns that may signal potential reversals in price trends, with special emphasis on patterns that occur with high volume and after significant price movements.
Bias Finder [UAlgo]The "Bias Finder " indicator is a tool designed to help traders identify market bias and trends effectively. This indicator leverages smoothed Heikin Ashi candles and oscillators to provide a clear visual representation of market trends and potential reversals. By utilizing higher timeframes and smoothing techniques, the indicator aims to filter out market noise and offer a more reliable signal for trading decisions.
🔶 Key Features
Heikin Ashi Candles: The indicator uses Heikin Ashi candles, a special type of candlestick that incorporates information from the previous candle to potentially provide smoother visuals and highlight potential trend direction.
Oscillator: The indicator calculates an oscillator based on the difference between the smoothed opening and closing prices of a higher timeframe. This oscillator helps visualize the strength of the bias.
Light Teal: Strong bullish trend.
Dark Teal: Weakening bullish trend.
Light Red: Strong bearish trend.
Dark Red: Weakening bearish trend.
Standard Deviation: The indicator can optionally display upper and lower standard deviation bands based on the Heikin Ashi high and low prices. These bands can help identify potential breakout areas.
Oscillator Period: Adjust the sensitivity of the oscillator.
Higher Timeframe: Select a timeframe for the Heikin Ashi candles and oscillator calculations (must be equal to or greater than the chart's timeframe).
Display Options: Choose whether to display Heikin Ashi candles, market bias fill, standard deviation bands, and HA candle colors based on the bias.
Alerts: Enable/disable specific alerts and customize their messages.
🔶 Disclaimer
Use with Caution: This indicator is provided for educational and informational purposes only and should not be considered as financial advice. Users should exercise caution and perform their own analysis before making trading decisions based on the indicator's signals.
Not Financial Advice: The information provided by this indicator does not constitute financial advice, and the creator (UAlgo) shall not be held responsible for any trading losses incurred as a result of using this indicator.
Backtesting Recommended: Traders are encouraged to backtest the indicator thoroughly on historical data before using it in live trading to assess its performance and suitability for their trading strategies.
Risk Management: Trading involves inherent risks, and users should implement proper risk management strategies, including but not limited to stop-loss orders and position sizing, to mitigate potential losses.
No Guarantees: The accuracy and reliability of the indicator's signals cannot be guaranteed, as they are based on historical price data and past performance may not be indicative of future results.

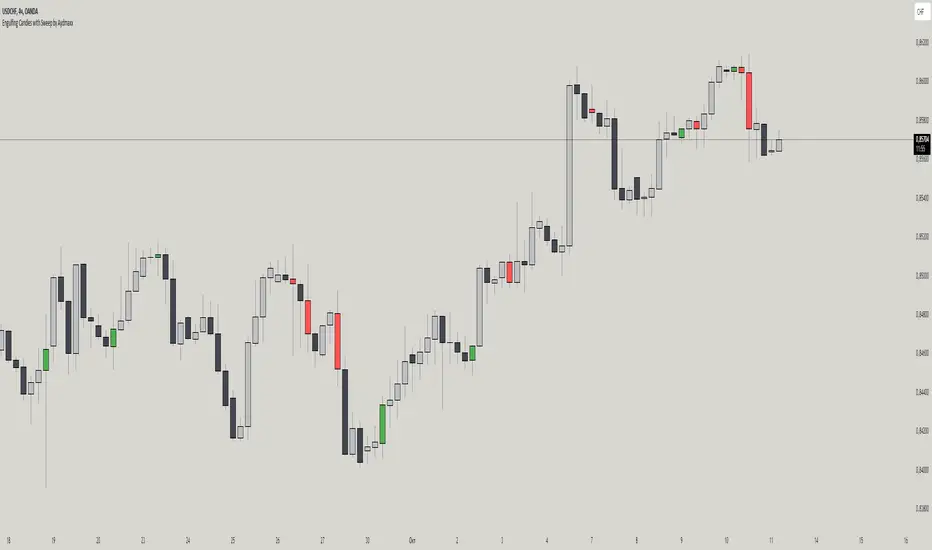
Engulfing Candles with Sweep by AydmaxxEngulfing Candles with Sweep Indicator
The "Engulfing Candles with Sweep" indicator identifies bullish and bearish engulfing candles that exhibit liquidity sweeps. It marks these significant candlestick patterns and draws a 50% Fibonacci retracement line from the high to low of the engulfing candle. The indicator helps traders spot potential reversal points where large market players might be accumulating or distributing positions.
Key Features:
Bullish Engulfing Candle with Sweep:
Identifies when a bullish candle (closing higher than it opened) engulfs the previous bearish candle (closing lower than it opened).
Ensures that the bullish candle’s low is lower than the previous candle’s low, indicating a sweep of liquidity.
Marks the identified bullish candle with a symbol below the candlestick.
Draws a 50% Fibonacci retracement line from the high to the low of the bullish engulfing candle.
Bearish Engulfing Candle with Sweep:
Identifies when a bearish candle (closing lower than it opened) engulfs the previous bullish candle (closing higher than it opened).
Ensures that the bearish candle’s high is higher than the previous candle’s high, indicating a sweep of liquidity.
Marks the identified bearish candle with a symbol above the candlestick.
Draws a 50% Fibonacci retracement line from the high to the low of the bearish engulfing candle.
Customizable Settings:
Fibonacci Line Color: Allows customization of the Fibonacci retracement line color for both bullish and bearish engulfing candles.
Fibonacci Line Style: Provides options to choose the line style (solid, dotted, dashed).
Fibonacci Line Width: Enables adjustment of the line width for better visibility.
Toggle Fibonacci Lines: Option to enable or disable the display of Fibonacci retracement lines.
How to Use:
Apply the indicator to your chart.
Look for symbols below or above the candlesticks, indicating bullish or bearish engulfing candles with liquidity sweeps.
Utilize the 50% Fibonacci retracement lines to identify potential support or resistance levels.
Benefits:
Helps in identifying key reversal patterns in the market.
Provides visual aids with Fibonacci retracement levels for potential entry and exit points.
Enhances trading decisions by confirming engulfing patterns with liquidity sweeps.
Brooks Always In [KintsugiTrading]Brooks Always In
Overview:
The "Brooks Always In Indicator" by KintsugiTrading is a tool designed for traders who follow price action methodologies inspired by Al Brooks. This indicator identifies key bar patterns and breakouts, plots an Exponential Moving Average (EMA), and highlights consecutive bullish and bearish bars. It is intended to assist traders in making informed decisions based on price action dynamics.
Features:
Consecutive Bar Patterns:
Identifies and highlights consecutive bullish and bearish bars.
Differentiates between bars that are above/below the EMA and those that are not.
Customizable EMA:
Option to display an Exponential Moving Average (EMA) with user-defined length and offset.
The EMA can be smoothed using various methods such as SMA, EMA, SMMA (RMA), WMA, and VWMA.
Breakout Patterns:
Recognizes bullish and bearish breakout bars and outside bars.
Tracks inside bars and prior bar conditions to better understand the market context.
Customizable Display:
Users can display or hide the EMA, consecutive bar patterns, and consecutive bars relative to the moving average.
How to Use:
Customize Settings:
First, I like to navigate to the top right corner of the chart (bolt icon), and change both the bull and bear body color to match the background (white/black) - this helps the user visualize the indicator far better.
Next, Toggle to display EMA, consecutive bar patterns, and consecutive bars relative to the moving average using the provided input options.
Adjust the EMA length, source, and offset as per your trading strategy.
Select the smoothing method and length for the EMA if desired.
Analyze Key Patterns:
Observe the highlighted bars on the chart to identify consecutive bullish and bearish patterns.
Use the plotted EMA to gauge the general trend and analyze the relationship between price bars and the moving average.
Informed Decision Making:
Utilize the identified bar patterns and breakouts to make informed trading decisions, such as identifying potential entry and exit points based on price action dynamics.
Good luck with your trading!
