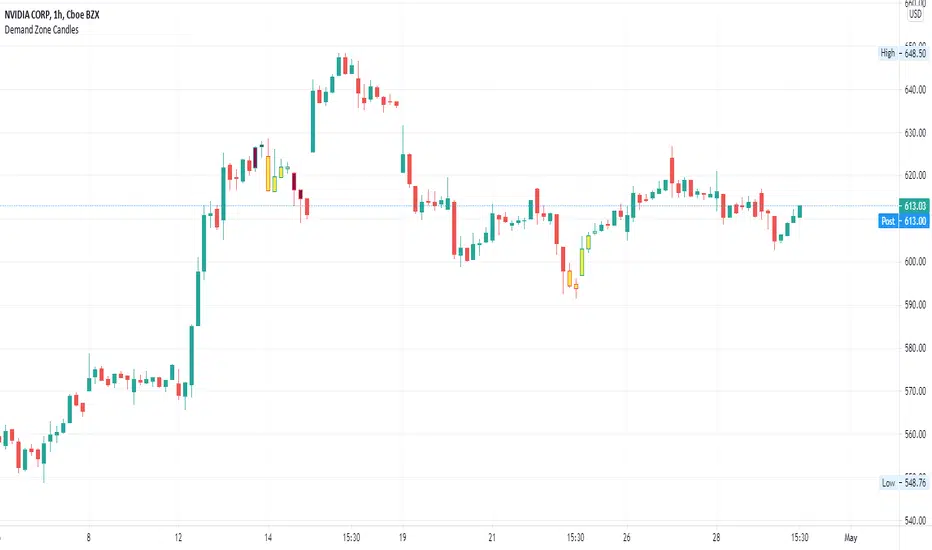
Supply/Demand Zone CandlesThis is a Pine Script to do a basic scan for demand zones and supply zones based on a Leg-Base-Leg-Base pattern. Yellow candles define a Demand Zone. Maroon candles define a Supply Zone. Индикатор Pine Script®от skbohler264
Session Breaks by KrisWatersThis indicator draw vertical lines on session break dates. There are 1H, 4H, D, W, M, 3M, 12M options. You can change line colors and style as you wish. If you are using this indicator please drop me comment and like also.Индикатор Pine Script®от kriswaters1010308
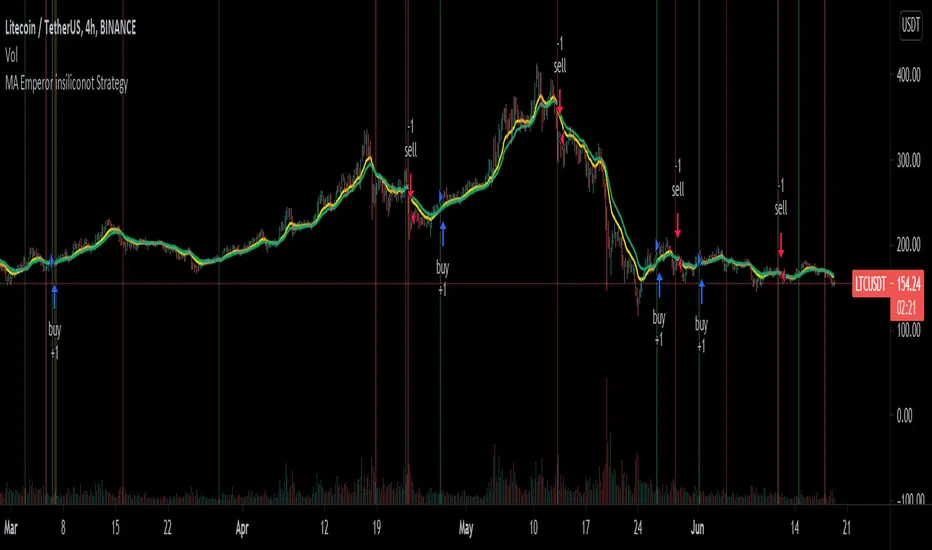
MA Emperor insiliconot StrategyConverted EmperorBTC's EMA crossover indicator for easy backtesting and added ability to: Specify time period for backtesting Specify order quantity Toggle original indicators (default off) Quoting EmperorBTC: Entry is to be made when the 1. Cross over gives a P(Positive Sign) and the candle completely closes above the cross-over 2. When the Heikin Ashi turns green and the next green HA candle goes above the previous green HA candle. 3. The price should be at-least above the 0.236 Level from the Swing high. Kindly note that the strategy only attempts to do check number 1, where it ensures the entry opens above the cross-over.Стратегия Pine Script®от shawnteohОбновлено 3636648
Hammers & Stars StrategyOverview This script trades basic hammer and shooting star candlestick patterns. It's an extremely simple strategy with minimal filters, and according to my personal manual backtesting and automated trading results, performs best on the Daily chart on certain forex pairs. It is intended to be traded on the forex markets but theoretically should work on all markets (especially if you optimize the settings). The script also comes with complete AutoView automation for Oanda. Make sure you've connected AutoView to TradingView and Oanda, then simply set an alert using the "alert() function calls only" condition and it will automatically execute trades based on whatever settings you've selected (only recommended for experienced traders - use at your own risk!) If you're not sure how to set up AutoView, search "The Art of Trading AutoView Guide" on YouTube to find my detailed video guide. Check out my website and YouTube channel for more information, scripts, resources and free Pine Script & trading lessons (link in my profile). Best of luck with your trading! - Matt / The Art of Trading Settings Menu Tooltips are included explaining what the various settings do, but here's a quick summary: Strategy Settings >= ATR Filter: Minimum size of entry candle compared to ATR <= ATR Filter: Maximum size of entry candle compared to ATR Stop Loss ATR: Stop loss multiplier (x ATR) R:R: Risk:Reward profile Fib Level: Used to calculate upper/lower third of candle. (For example, setting it to 0.5 will mean hammers must close >= 50% mark of the total candle size) Start Date Filter: Date & time to begin trading from End Date Filter: Date & time to stop trading AutoView Oanda Settings Use Oanda Demo: If turned on then oandapractice broker prefix will be used for AutoView alerts (demo account). If turned off then live account will be used Use Limit Order: If turned on then AutoView will use limit orders. If turned off then market orders will be used (recommended to use limit order to mitigate spread issues) Days To Leave Limit Order: This is your GTD setting (good til day) Account Balance: Your account balance (used for calculating position size) Account Currency: Your account balance currency (used for calculating position size) Risk Per Trade %: Your risk per trade as a % of your account balanceСтратегия Pine Script®от ZenAndTheArtOfTradingОбновлено 2828 4.8 K
MA Strategy Emperor insiliconotThe Script offers 9 different EMAs with 14 different MA types. The make use of the script is to find the entry on the 1-4 hour altcoins while using the in-built 13/21 crossover strategy to be used in sync with Heikin Ashi cross-over with Fib levels of 0.236 Fib level. How to use it. Entry is to be made when the 1. Cross over gives a P(Positive Sign) and the candle completely closes above the cross-over 2. When the Heikin Ashi turns green and the next green HA candle goes above the previous green HA candle. 3. The price should be at-least above the 0.236 Level from the Swing high. All the Best. EmperorBTCИндикатор Pine Script®от EmperorBTC9090 6.6 K
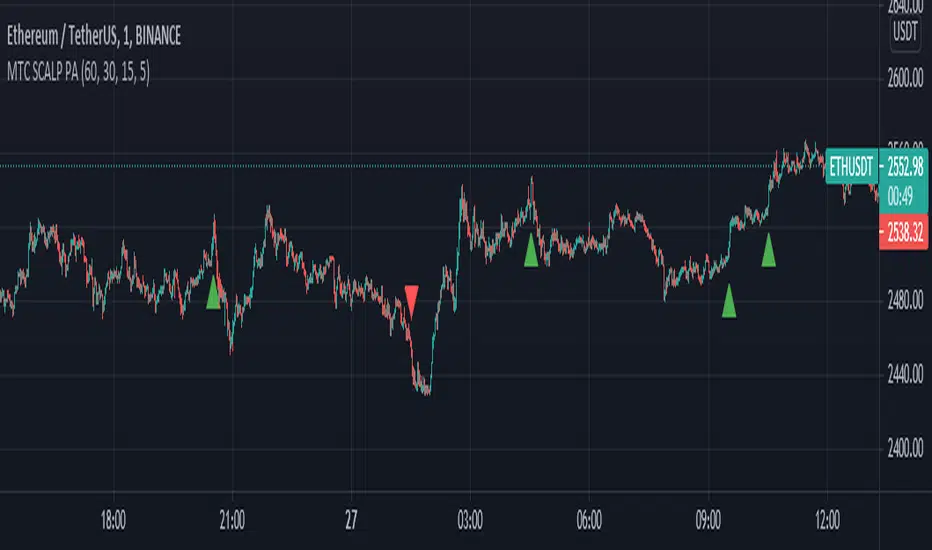
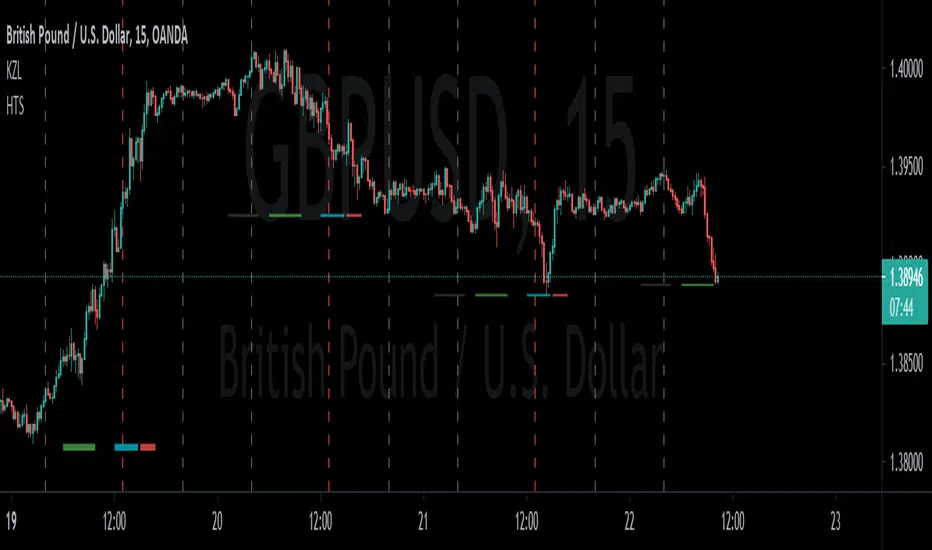
MTF SCALP Price Actionits just for personal use of my own. if you want to use this indicator, use it at your own responsibility. but just remember its a SCALP strategy and must be used on 5M timeframe. Long/Short Conditions : last 1H,30M,15M and 5M candle close on same direction. I will back test this indicator and if it worth it i will write turn it to a strategy. PS: i'm new to pinescript coding . so, sorry for my bad coding. if you have any suggestions to improve my coding skills i will be very thankful if you share it with me.Индикатор Pine Script®от itsleonericОбновлено 11118
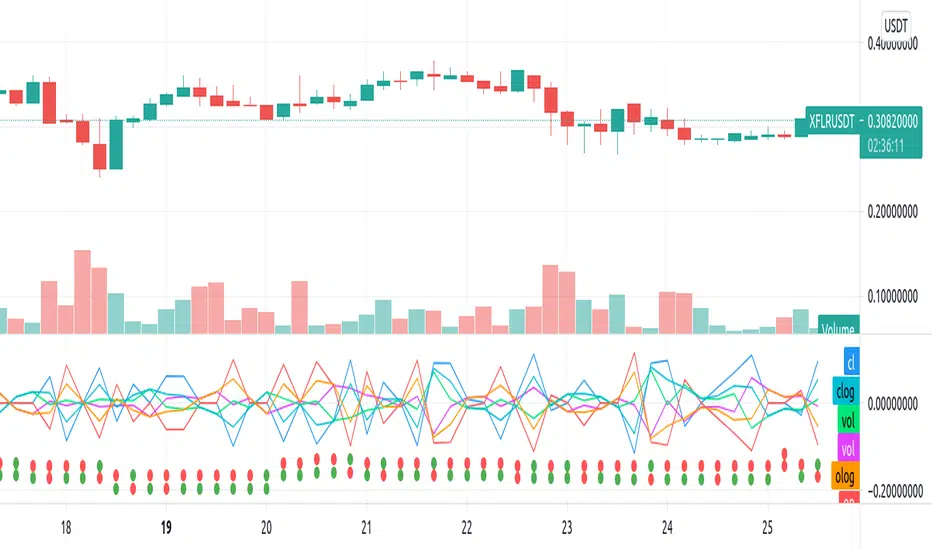
Repulsion: Price & Volume 1Repulsion: Price & Volume 1 www.quantamagazine.org Proof of concept using the above link and comparisons of price and volume, and one of a series stemming from the so-called Repulsion Engine, now also open sourced, and other indicators from the workbench. Traffic lights are not accurate. Like it if you use it, drop a line if you update it -- or if you have comments about how to improve it. Индикатор Pine Script®от latticephreak39
Day of month gain-lossSince March 2014 to date, on the 24 of each month, the crypto market has: - lost more than 1% 30 times - gained more than 1% 32 timesИндикатор Pine Script®от givanse14
Hourly Time SeparatorI made this indicator mostly for personal use but there may be few others who would like to have vertical lines occur every day in specific our on chart. I am no developer and all I did was copy @allanster's work and delete few lines and duplicate few others. Code will be open for anyone to edit since it was not my code to start with after all. Hopefully this one helps to someone.Индикатор Pine Script®от caktasninoОбновлено 1414679
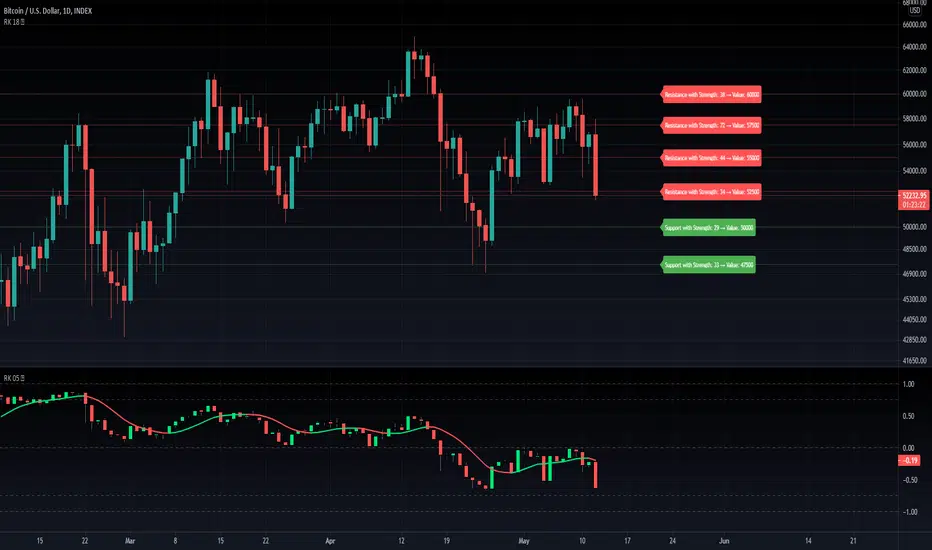
RK's 18 ∴ All Sources Auto Support and Resistance IndicatorThis indicator will do a logarithmic base round in any of traditional Trading View Sources to get the Support and Resistance values, then will draw lines in the most repeated prices levels. Higher values in "Precision Digit" input will make it more precise. Индикатор Pine Script®от RodrigoKazumaОбновлено 1313 1.2 K
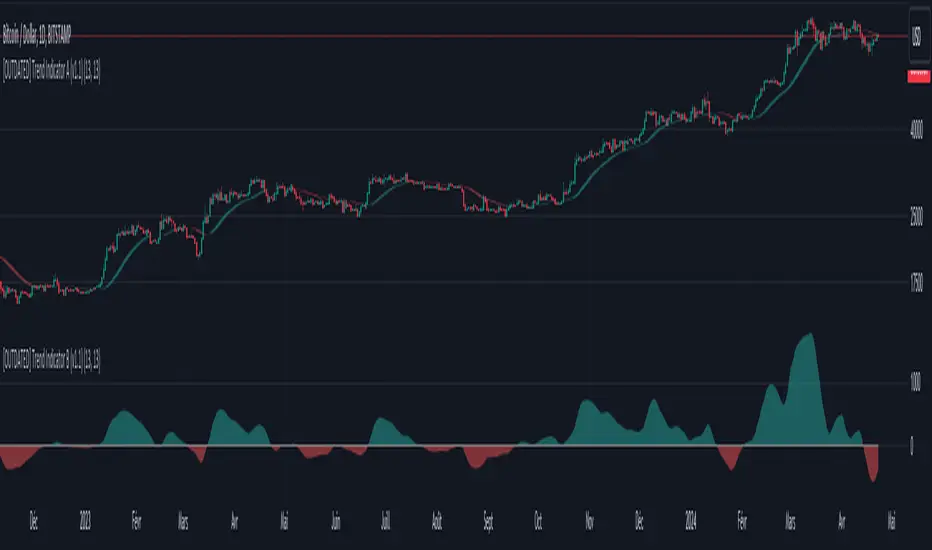
Dziwne Trend Indicator B (EMA + Heikin Ashi) V1Based on my own "Dziwne Trend Indicator A (EMA + Heikin Ashi cloud)" , I tweaked the original script to display and "measure" the overall trend.Индикатор Pine Script®от DZIVОбновлено 11312
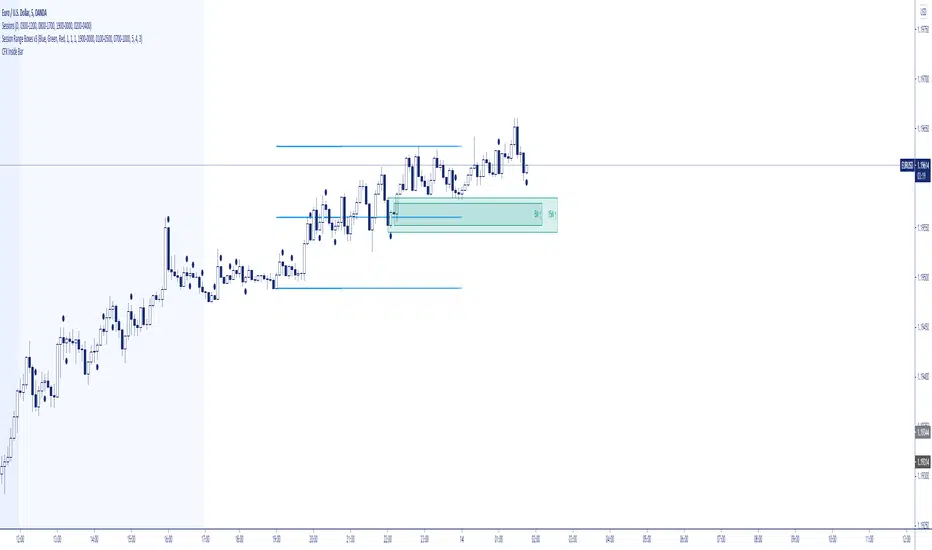
CFX Inside Bar V1Inside bar indicator for monochromatic chartsИндикатор Pine Script®от BigCheese20Обновлено 95
FirstBarRangeFirstBarRange study displays lines for the high and low of the first bar/candle of the trading day, along with shaded areas for the range on top of the first bar high and below the first bar low. This study is very useful for intraday traders to see when stocks trade above the first bar high, it shows strength, and many times the high of the first bar is also good support. On the contrary, below the first bar high tends to be good area of weakness and many times it becomes a good resistance level. Many times when the stock trades inside the first bar range, price will be choppy and range bound.Индикатор Pine Script®от pgodel77165
*All Candlestick Patterns* Tiny VersionThis is just the *All Candlestick Patterns* script with tiny labels. Also an excuse to test the script publication .. but you will find this version much less annoyingИндикатор Pine Script®от AkliBaitiche251
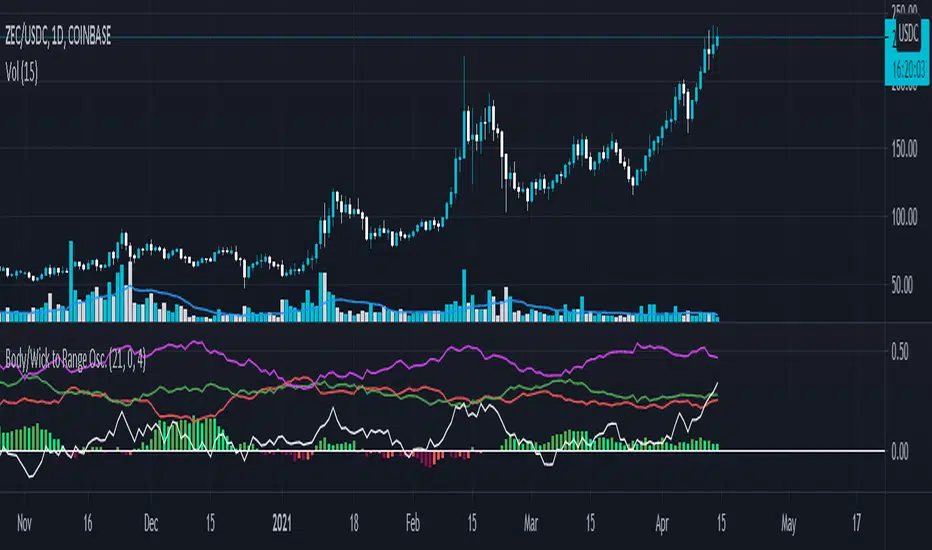
Body/Wick to Range Osc.This script is meant to be a form of pure candlestick analysis. Terminology in the description used below is as follows: - numcands = Number of candles specified by the user to be used for sampling in each moving average. This script plots moving average (SMA/EMA specified by the user ) of the percentage of the high-low range that the previous {numcands} candles the upper wicks, lower wicks, and the body take up. The user may specify if the absolute value of the body percentage is to be used (true by default). To account for this, a horizontal line is also plotted at 0 to show when the body percentage moves above or below 0. The values that all of these moving averages plotted will oscillate between 0 and 1 (-1 and 1 for the body percentage if the absolute value of candles is not used). Other notes: The user may select the colors used (colorblind support, as the defaults are red and green). Cross overs and cross unders are accounted for in alertconditions (as is if the body % moves above and below 0% if absolute values are not used). An interpretation of the use of this script may be: If the upper wicks begin to take up a larger portion of the high-low range, it may signal downward selling pressure (and vise-versa for lower wicks). However, this may be open to interpretation based upon the specified {numcands} used.Индикатор Pine Script®от SolCollectorОбновлено 22146
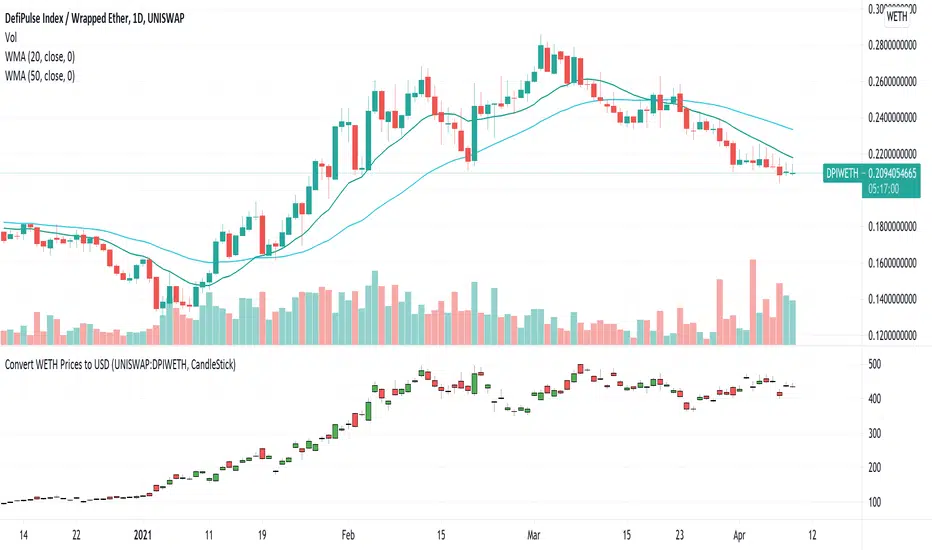
USD Prices for Uniswap Token/WETHUniswap instrument prices are in WETH. This indicator translates the series to USD prices and plots the series as candles or as a line. Data is translated by using corresponding series data for ETHUSD. The reference ETHUSD price is from Coinbase. Any token listed as a ETH/WETH pair could be specified as an input parameter. The default instrument value is set to UNISWAP: DPIWETH, an index created by indexcoop and tracking the DEFI basket. The script is simple and easy to understand. It allows for quick conversion and comparisons and something we had to do in a custom way prior to this script. The crypto and DEFI community would benefit from it immensely. There is even a feature request for something like this on the tradingview subreddit.Индикатор Pine Script®от elliptic-capital178
Adam centrosymmetryAuto-generate future bars based on the previous bars.Индикатор Pine Script®от CJ-gnuser33116
Trend ResumptionWe again keep it really simple. This indicator just plots the combination of RGRR and GRGG candlesticks. (R = Red / Bearish, G = Green / Bullish) When either pattern occurs, trade the combined high and combined low of recent 2 RR or recent 2 GG candles. I.e., Buy above GG's high with SL at GG's low. Sell below RR's low with SL at RR's high. Refer the shared chart for example. The signals were plotted on both the sides, and wherever triggered - gave rewards. Only 1 at 05-Apr, 10:50 a.m. did not trigger, but that must then be ignored. Do not hurry to enter the trade, wait for breakout / breakdown above combined high / low.Индикатор Pine Script®от SushilKothawade1616447
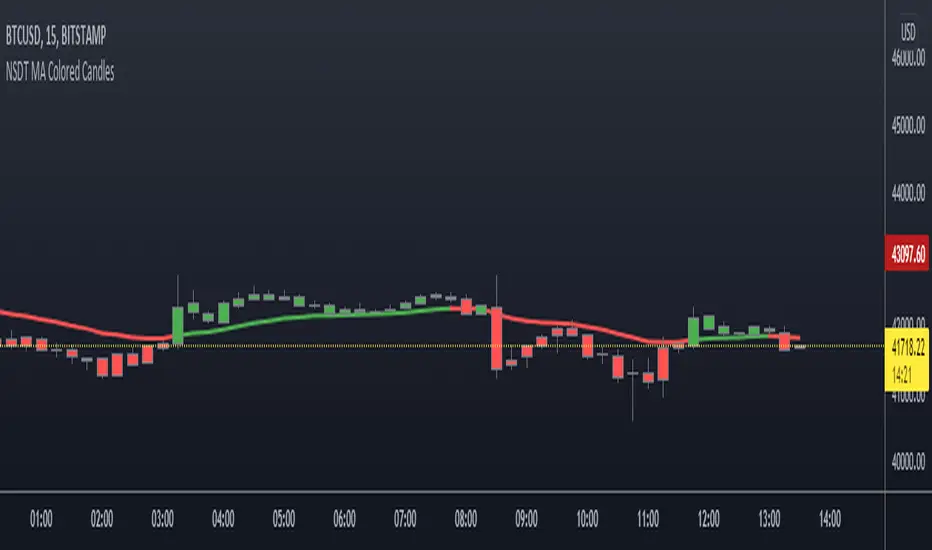
NSDT MA Colored CandlesA simple script that will change the color of the candle if it closes over/under the designated Moving Average. This makes it very easy to identify trends based on your selected Moving Average line length. You can choose EMA, SMA, or WMA and of course the length is adjustable as well. To see these candles, be sure to go into the Chart Settings and uncheck the candle Borders, Colors, and Wicks.Индикатор Pine Script®от NorthStarDayTradingОбновлено 1818429
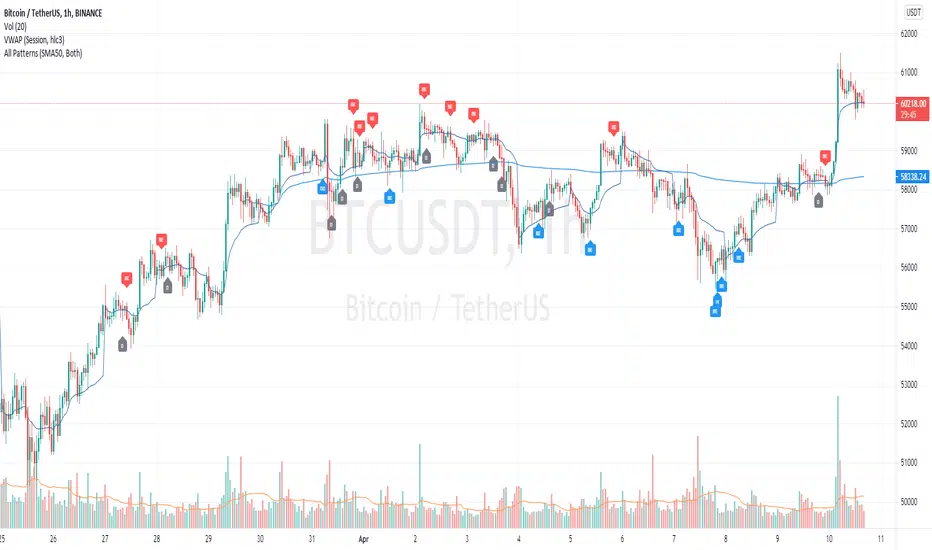
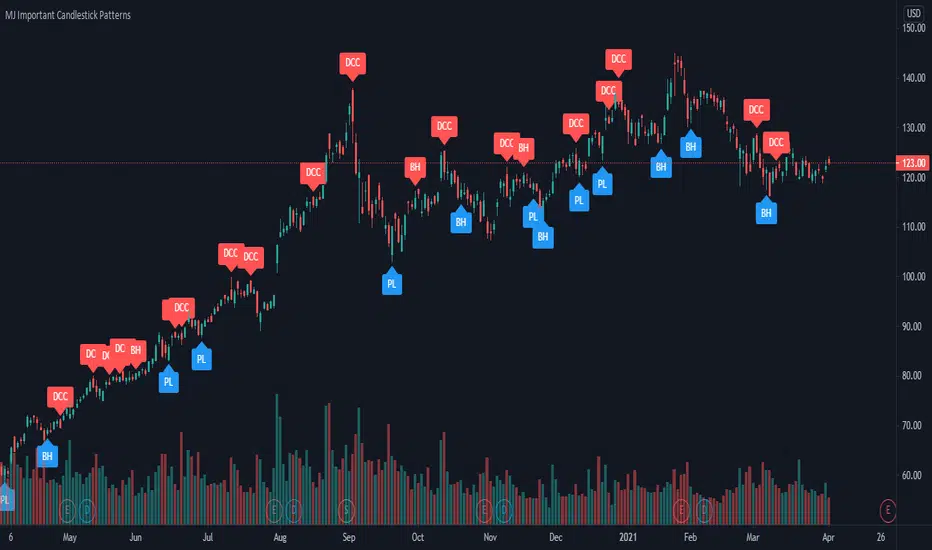
MJ Important Candlestick Patterns + Smart TrendThis script detects 6 important candlestick patterns defined by the author and puts chart labels on your chart for your attention. It also includes a smart trend checking algorithm to detect trends. The six candlestick patterns covered are: Bullish Engulfing Bearish Engulfing Piercing Line Dark Cloud Cover Bullish Harami Bearish Harami *** Smart feature of this indicator is that it can detect uptrends or downtrends before alerting you regarding the bullish or bearish reversal candlestick pattern. This is achieved by comparing the typical price (high+low+close divided by 3) of today's candle versus three days ago.Индикатор Pine Script®от TheInvestingCloud11351
3 Types of Doji StarDoji types: 1. Standard Doji 2. Dragonfly Doji 3. Gravestone Doji Input: 1. EMA 2. Proportion (%) of Dragonfly & Gravestone Doji Индикатор Pine Script®от JasonKurniawan68