Equilibrium╭━━━╮╱╱╱╱╱╱╭╮╱╭╮
┃╭━━╯╱╱╱╱╱╱┃┃╱┃┃
┃╰━━┳━━┳╮╭┳┫┃╭┫╰━┳━┳┳╮╭┳╮╭╮
┃╭━━┫╭╮┃┃┃┣┫┃┣┫╭╮┃╭╋┫┃┃┃╰╯┃
┃╰━━┫╰╯┃╰╯┃┃╰┫┃╰╯┃┃┃┃╰╯┃┃┃┃
╰━━━┻━╮┣━━┻┻━┻┻━━┻╯╰┻━━┻┻┻╯
╱╱╱╱╱╱┃┃
╱╱╱╱╱╱╰╯
Overview
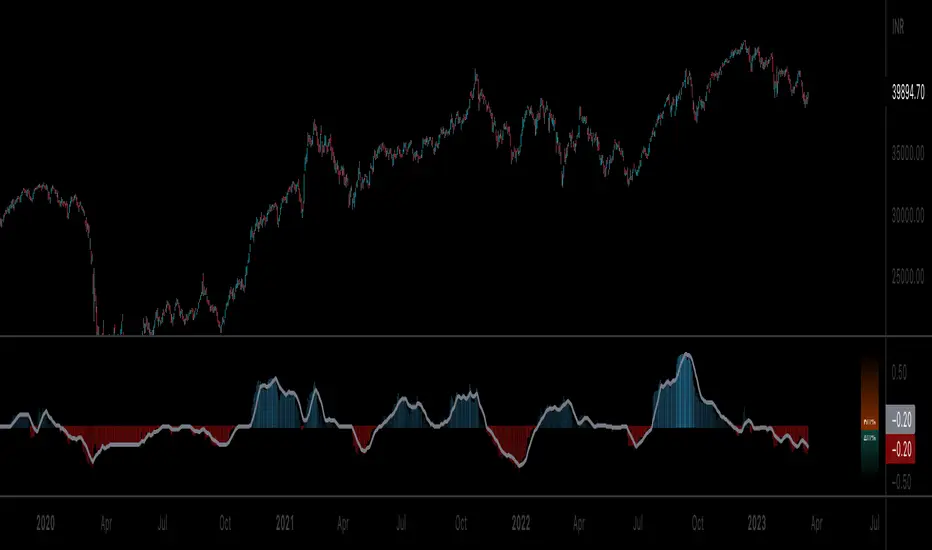
Equilibrium is a tool designed to measure the buying & selling pressure in the market. It is depicted as a “pressure gauge” that automatically adjusts as new candles are formed, providing a real-time indication of who's on top right now, buyers or sellers?
Background
Supply & demand is considered to be the main driving force of our modern economies, where the interaction between the two parties(sellers & buyers) leads to the determination of the fair price for a given product. Stock markets are no exception, they operate very much based around the idea of supply & demand.
In simple terms, supply refers to the availability of a product, and demand is the willingness of consumers to buy that product at a given price. It is obvious that different vendors may sell the same product at slightly different prices, and similarly, different customers may choose to buy the same product from different vendors at varying prices. The idea is that the price is allowed to fluctuate from time to time, but in a free & fair market, the price will eventually settle down to a value that makes both the parties happy. Such a state is known as the “Price-Equilibrium”, and this process is also referred to as the market mechanism.
This is the basic assumption around which this tool is based, the market is always trying to move towards a state of equilibrium.
Calculations
This tool takes a simplistic approach to estimate the degree of imbalance between buyers & sellers, here’s a brief summary of how the pressure is calculated:
- We compute the total lengths of red & green candles for a given period, i.e. price range multiplied by the volume for that candle.
- Then the distribution of each type of candle is calculated.
- Assuming more red candles denote more selling pressure, and green candles denote buying pressure, the gauge is populated cell by cell.
- As the pressure on one side increases, the intensity of the cell color also increases, signifying the extent to which one side is dominating.
How to use it
- The indicator is designed as a pressure gauge that moves up(vertical alignment) or to the right(horizontal alignment) as the buying pressure increases, and moves down or to the left as the selling pressure increases. How it is to be used & applied, that completely depends on your trading methodology. But, the general idea is that we expect the market to be in a state of equilibrium, and if that is not the case the tool will highlight that, and this is also where the opportunity lies to find suitable trades.
- Just by having an idea about who’s dominating the market currently, a trader can also pick sides wisely. Remember, the market is always striving to come back a state of equilibrium, and a slight imbalance can indicate the current trend, and more importantly, who’s more likely to make the next move.
User Settings
The tool offers some minimal configurations for the end user:
- You can choose to display the actual percentage value in the gauge(Show Text).
- You can adjust colors that denote buyers & sellers.
- You can change the layout of gauge, default is vertical(right side of the screen).
- Last, and most important, you can adjust the number of candles to traverse for calculating the pressure. Default is 50, can go upto 1000.
Candlestickanalisys
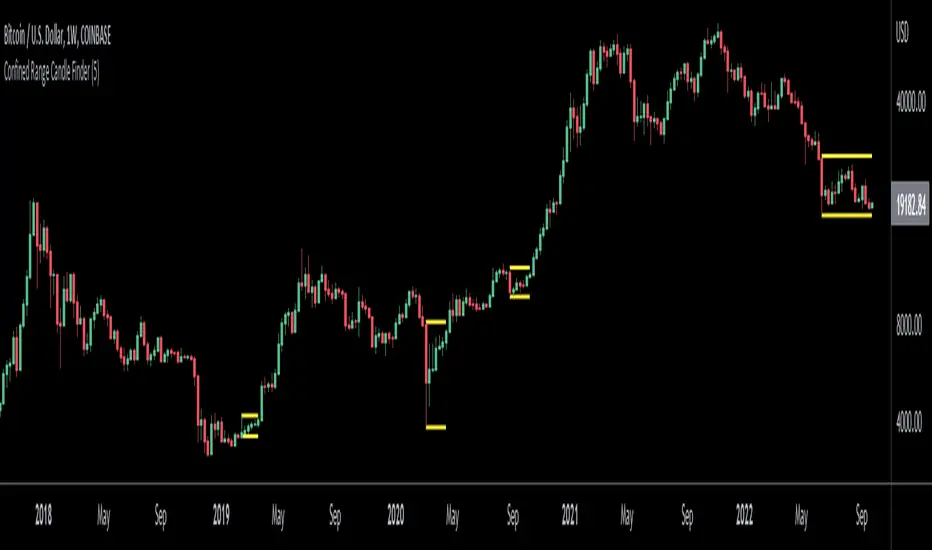
Confined Range Candle FinderThis indicator finds candlesticks which are confined within the range of a previous candlestick. This indicates volatility contraction which often leads to volatility expansion, i.e. large price movements.
While every confined range will contain at least 1 inside bar, this indicator differs from the Inside Bar Finder which only finds consecutive inside bars.
This indicator includes options such as:
- The minimum number of candlesticks confined within the range of a previous candlestick to trigger the indicator
- Labels to indicate the number of confined candles
- Signal lines to indicate the high and low of the containing candlestick
Try out this indicator with different options on different timeframes to see if confined ranges increase the probability of identifying the direction of price movements. Breaks or closes outside signal lines can be used to trigger trade signals.
HTF Candles: 3x Multi-Timeframe Candle Boxes #Pip-Whisperer
- Modify 3 Timeframes to display Candle Boxes over your Chart
- Thats it.
- Enjoy!
- If anyone implements candlestick pattern detection to this before me, please send me link, that would be sick!

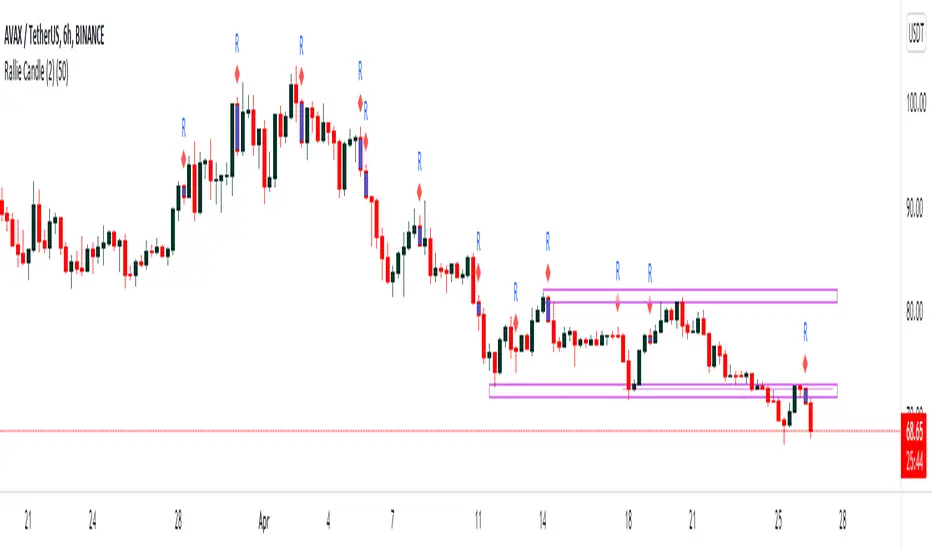
Rally HTF Candle (Candlestick Analysis) Guaranteed WinnersRally Candle will signal when price is at the end of a Rally to the upside and thus entering a balance phase in the market (works on all markets)
This candle works very efficient when the market is either trending downwards or in range markets where price is at resistance. (i would avoid in uptrends but depends on the trader)
Also we can expect this candle to form when price is overextended as the theory of this script is when there is a turning point in momentum - this candle will appear and we can look long from this signal.
This candle will only work in Swing High areas and appear when below an moving average which can be changed in the settings.
This candle will work only work pn the HTF as it provides very good rexpectancy whereas the LTF has a slightly less expectancy (i will be publishing an intraday Rally candle)
This candle can be alerted to signal the Rally Candle when the bar is confirmed and not during.
The way i trade this candle is
1) Candle signal must be in probably area to increase efficiency.
2) Enter on the second candle after candle IS CONFIRMED
3) Set stop loss below Rally Candle or use ATR value
4) Trade with the trend ie only Bearish price action
5) This candle can catch extreme points in the market ie this candle projected when ETH hit aths $4841
6) Trading with a confluence along with the Rally is better than solely trading this candle
Please leave a comment.
If we get to 100 likes i will publish the script.

Rally Candle (End Game ) 26/04/2022 Few Months ago I started wanted to code a candle which alerts me when a Rally may be over in Bearish Conditions and today I have created a candle which is 1. subjective but more importantly appears in areas where buying pressure is at either a climax or in the process of a decline and this is where the Rally Candle signals. This shows momentum may be shifting and these can provide some good entries.
They will only working when price is below the 200ema and in overextended markets - VERY IMPORTANT!!!
Works on all timeframe with HTF providing more price percentage than LTF
They aren’t a specific candle size however they will repaint when we see 4 higher close candles followed by a candle which has closed lower than the previous 4th.
//Candle Conditions
This candle has to be in a swing high area to be valid and on 1H and 6H but the 1H will repaint a lot of candles so when we have a point system of +20 we can assume this setup is a good setup.
//Candle Operators
You can change the color of the bar to your liking
There is a ema filter so if you want to candle to not show candles of the 50ema this operator will do the command.
Please post requests and any potential implementations I could port to pine script.
Hope you Enjoy :)