Intraday Institutional Buy/Sell Detector (5 Min) + AlertsWorks with O=L daily 5 min candle within first 20 mins of market opening
Candlestick analysis

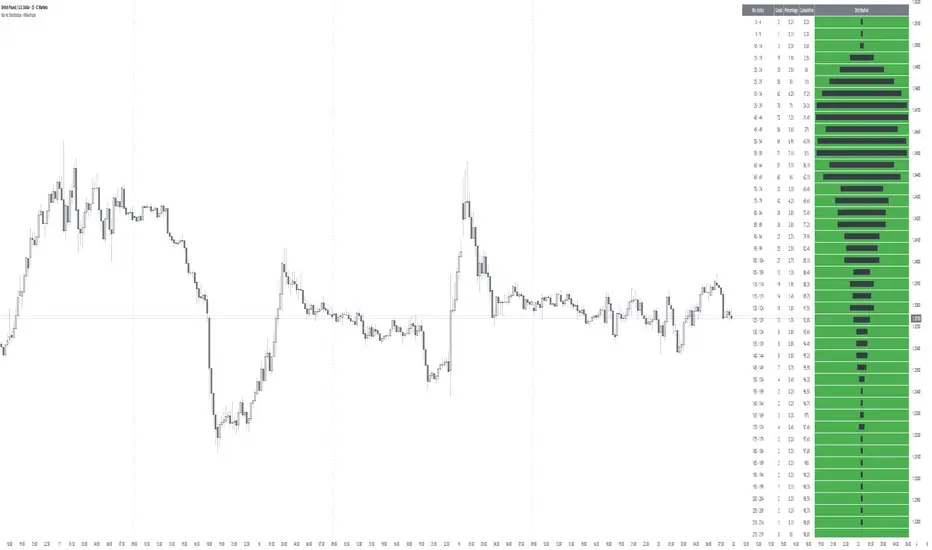
Bar HL Distribution - XWiseTradeBar HL Distribution - XWiseTrade
Analyze the distribution of High-Low ranges over the last N bars.
This indicator groups candle ranges (in ticks) into bins and displays:
• Count per bin
• Percentage and cumulative %
• Visual histogram bars
Perfect for understanding typical volatility, setting realistic targets/stops, and spotting unusual bar sizes.
Features:
• Adjustable lookback and bin size
• Clean table with truncation warning
• Lightweight and always up-to-date
More premium indicators and strategies coming soon at:
xwisetrade.com
Be Wise. Trade X.
CRT 4H-DAY (Candle Range Theory)CRT 4H-DAY (Candle Range Theory) is a clean, price-based analytical tool designed to help traders contextualize market structure across multiple time horizons.
The indicator highlights key reference levels derived from recent market ranges and visualizes them directly on the chart in a minimal, non-intrusive way.
Its purpose is to improve spatial awareness of price behavior rather than generate direct trading signals.
CRT Trading is built for discretionary traders who prefer to combine contextual levels with their own analysis, price action, and risk management rules.
Key characteristics:
Multi-timeframe contextual reference levels
Clean and customizable visual layout
Works across crypto, forex, indices, and stocks
Designed for intraday and swing analysis
No repainting
No buy/sell signals
No future data usage
This indicator does not provide financial advice and should be used strictly as a supplementary analytical tool.
This indicator is for educational and analytical purposes only.
It does not provide trading signals or investment advice.
All trading decisions remain the sole responsibility of the user.

Pips Measure & OHLC Table - XWiseTradePrecise pips calculation and OHLC info for every candle.
This indicator provides:
• H-L and O-C pips on bar labels
• Hover tooltip with full OHLC table
• Optional static table for the last bar
• Customizable price digit display
Features:
• Accurate pip sizing (mintick-based)
• Three display modes (labels, tooltip, static table)
• Clean, professional formatting
Essential for forex traders tracking precise price movement and candle structure.
More premium indicators and strategies coming soon at:
xwisetrade.com
Be Wise. Trade X.

Thick Wick Highlight - XWiseTradeMake candle wicks pop with customizable thickness and color!
This lightweight overlay draws bold lines over upper and lower wicks on every candle—ideal for:
• Crowded charts with multiple indicators where thin wicks get lost
• Cleaner screenshots and printed analysis
• Making long wicks more visible at a glance
Features:
• Adjustable wick color and thickness (1-10)
• Works on all symbols and timeframes
Note: Due to TradingView's line object limit (~50 lines per script), thick wicks are visible on the most recent ~25 candles.
More premium indicators and strategies coming soon at:
xwisetrade.com
Be Wise. Trade X.

Performance with Okuninushi Line Area Determinations**Performance Indicator with Market Structure Analysis**
Building upon TradingView's official Performance indicator, I've added a custom column to assess current market structure using my Okuninushi Line methodology, which visualizes the AB structure concept.
**What is the AB Structure?**
The AB structure identifies equilibrium levels based on recent price action. The Okuninushi Line calculates the 50% midpoint between the highest high and lowest low over a specified lookback period. In this implementation, I use a 65-day period on the daily timeframe (representing one quarter: 13 weeks × 5 trading days), though this is fully customizable.
**Market Structure Classification:**
- **Above Okuninushi Line** → "upper to okuni" → Price is in the **Premium Area** (bullish structure)
- **Below Okuninushi Line** → "down to okuni" → Price is in the **Discount Area** (bearish structure)
This additional column provides an instant visual reference for whether each asset is currently trading above or below its equilibrium level, complementing the traditional performance metrics with structural context.
---

AI Market Barometer ProAI Market Barometer Pro - Professional Trading Indicator
Overview
AI Market Barometer Pro is an advanced multi-timeframe trading system that combines artificial intelligence algorithms with proprietary technical analysis to deliver high-confidence trading signals. This professional-grade indicator analyzes market conditions across multiple timeframes simultaneously, providing traders with clear directional bias and signal strength ratings.
Core Features
🎯 Core AI Barometer System
- Multi-Timeframe Analysis: Monitors different timeframes simultaneously
- AI Confidence Score: Proprietary algorithm calculates signal confidence from 0-100%
- Three-Level Signal Strength: Basic, Medium ★, and Strong ★★ signals
- Dynamic Background Coloring: Visual market sentiment at a glance
- Real-Time Information Panel: Customizable position with live market metrics
⚡ Three AI Accelerator Systems
- Accelerator 1: Original multi-timeframe momentum system with 27 dimensions
- Accelerator 2: Five-star selection algorithm with 32 AI parameters
- Accelerator 3:
- Each accelerator provides independent AI support lines and signal zones
- Highly selective signals ensuring maximum accuracy
📊 Advanced Visualization
- Color-Coded Signals:
- Green zones indicate bullish conditions
- Red zones indicate bearish conditions
- Gray indicates neutral/ranging markets
- Smart Labels: Auto-positioned signal labels displaying confidence percentages
- Background Intensity: Three levels showing signal strength
- Customizable Display: Adjustable panel position and visibility options
Configuration Options
Display Settings
- Panel Position: 9 position options (corners, edges, center)
- Show Labels: Toggle signal labels on/off
- Show Background Color: Toggle background coloring on/off
- Show Info Panel: Toggle real-time information table on/off
- Background Display Days: Control how many days of coloring to display (1-30 days)
Channel Settings
- Enable Channel: Optional channel
- Channel Width: Adjustable deviation multiplier
Accelerator Settings
- Enable Accelerator 1: Original accelerator system
- Enable Accelerator 2: Five-star selection system
- Enable Accelerator 3: Advanced buy filtering system
- Each can be toggled independently
Alert System
Pre-configured alerts include:
- AI Long Signal activation
- AI Short Signal activation
- AI Ranging Signal activation
- Accelerator 1 Bull/Bear zones
- Accelerator 2 Bull/Bear zones
- Accelerator 3 Bull/Bear zones
Information Panel Metrics
Real-time display includes:
- Current Timeframe
- Active Signal (Long/Short/Ranging)
- AI Confidence Percentage
- Current Price
- Change Percentage
- Momentum Status (Bullish/Bearish/Mixed)
- Signal Strength Rating
Recommended Timeframes
- Scalping: 1-minute charts
- Day Trading: 5-minute, 15-minute charts
- Swing Trading: 1-hour, 4-hour, Daily charts
- Position Trading: Daily, Weekly charts
Technical Requirements
- TradingView Pro, Pro+, or Premium account (required for multi-timeframe functionality)
- Compatible with all markets: Forex, Crypto, Stocks, Indices, Commodities
- Works on all timeframes from 1-minute to Monthly
Disclaimer
This indicator is a tool to assist with trading decisions. Past performance does not guarantee future results. Trading involves substantial risk of loss. Always use proper risk management and never risk more than you can afford to lose. The AI algorithms and confidence scores are based on historical price patterns and technical analysis, not predictive guarantees.
What Makes This Different?
Unlike simple trading systems, AI Market Barometer Pro:
- ✅ Analyzes multiple timeframes simultaneously
- ✅ Calculates dynamic confidence scores
- ✅ Provides three-tier signal strength ratings
- ✅ Includes three independent accelerator systems
- ✅ Delivers highly selective, low-noise signals
- ✅ Features professional-grade visualization
- ✅ Adapts to all market conditions
Join thousands of traders using AI-powered analysis to gain their edge in the markets.
🌤️ Perfect Companion Indicator
Enhance your trading with AI Market Weather Forecast Pro
Transform complex market analysis into intuitive weather forecasts. Get instant market temperature readings from -50°C to +50°C and know whether you're trading in a heatwave or a blizzard.
Why use them together:
Barometer → Precise entry/exit signals with AI confidence scores
Weather → Overall market climate and trend temperature
Combined → Complete market picture for optimal timing
👉 Get AI Market Weather Forecast Pro
Know the market climate before you trade. Two indicators, one complete trading system.
© 2024 AI Market Barometer Pro. All rights reserved. Proprietary algorithms and methodologies protected.

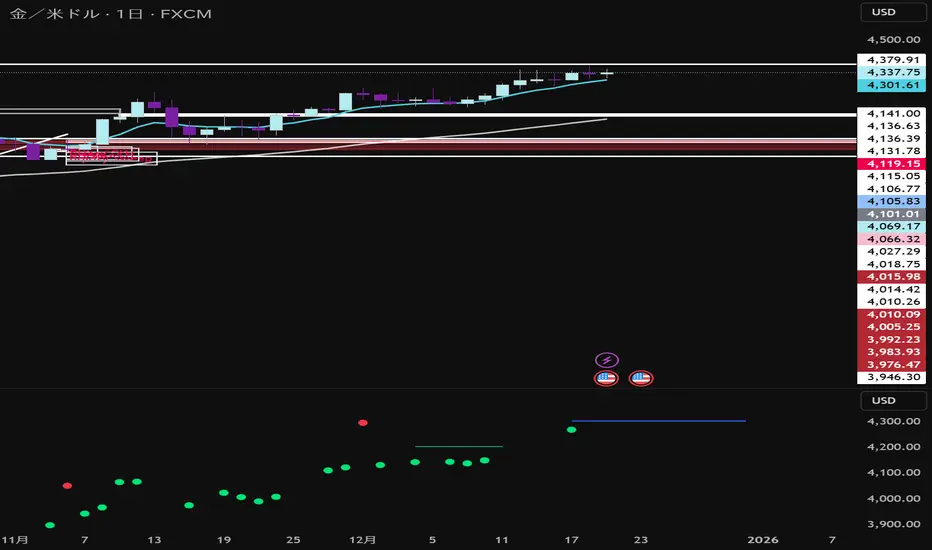
Gann Levels by Acharya JiThis Pine Script indicator is designed to help traders quickly identify **key intraday levels** based on the **first candle of the trading day**. It performs three main functions:
1. **Marks the First Candle’s High and Low**
- Blue circles are plotted at the high and low of the first candle each day.
- These serve as the baseline reference points for calculating targets.
2. **Plots Upside Targets (Green Lines)**
- Six horizontal green lines are drawn above the first candle’s high.
- Each line represents a percentage increment: **+0.09%, +0.18%, +0.36%, +0.72%, +1.44%, +2.88%**.
- These levels act as potential resistance or profit-taking zones.
3. **Plots Downside Targets (Red Lines)**
- Six horizontal red lines are drawn below the first candle’s low.
- Each line represents a percentage decrement: **-0.09%, -0.18%, -0.36%, -0.72%, -1.44%, -2.88%**.
- These levels act as potential support or stop-loss zones.
---
Purpose
- Provides a **structured intraday roadmap** based on the first candle.
- Helps traders visualize **target ladders** both above and below the market.
- Useful for scalpers, intraday traders, and strategy testing around **breakouts or reversals**.
---
👉 Rahul, would you like me to also add **labels (like +0.09%, -0.18%)** directly on the chart next to each line so you can instantly recognize which target level is which without checking the legend?

ORB 2R Retest Volume Entry (1m) - v6gJdsfjs kdfg s jdslzi gdsjzg SJFds SJKdls dsjzgfjdkzl GDMKls gndsmzgSfgndmsKF fdnsioGLfs


SekakitaMoneyZone本インジケーターは、製作者Sekakitaが実際のトレードで使用している
「相場の波形(Wave Structure)」に基づき、利確候補(TP)を見極めることを目的として開発されました。
相場の流れを視覚的に捉えることで、無駄なエントリーや早すぎる決済を防ぎ、再現性の高いトレード判断を可能にします。
This indicator is developed based on the wave patterns essential to Sekakita’s trading strategy, with the primary goal of identifying potential take-profit (TP) areas.
By visualizing market wave structures in real time, it enables more consistent and disciplined trade management.
Sessions + EMAS + Nube (Mini Table)This indicator is designed to help traders analyze market trends and identify potential trading opportunities.
It provides clear visual signals based on price behavior and technical calculations, allowing traders to better understand market structure, momentum, and direction.
The indicator can be used on any market and timeframe, making it suitable for both intraday and swing trading.
It is intended as a decision-support tool and should be used in combination with proper risk management and other forms of analysis.

ENTRY SL TARGETS]Entry sl target use 3 min time frame intraday use only,long and short trades can do with sl

Maestro 4hThis indicator is designed to help traders analyze market trends and identify potential trading opportunities.
It provides clear visual signals based on price behavior and technical calculations, allowing traders to better understand market structure, momentum, and direction.
The indicator can be used on any market and timeframe, making it suitable for both intraday and swing trading.
It is intended as a decision-support tool and should be used in combination with proper risk management and other forms of analysis.

True Session Opens [TakingProphets]True Session Opens
- Description
- True Session Opens plots “true” session open levels (horizontal) for major trading windows
- Optional vertical session boundary markers and bottom session labels
- Built to keep charts clean with a timeframe visibility filter and lookback pruning
- What This Is (In Plain English)
- When a session starts (New York time), the script captures that candle’s open price
- A horizontal line is drawn from the session start and extended bar-by-bar to the current bar
- Optional vertical lines mark session start and end boundaries
- Optional bottom labels show ASIA, LONDON, NY.AM, and NY.PM near the midpoint of each session
-----------------------------------------------------------------------------------------------
Sessions Tracked (New York Time)
-----------------------------------------------------------------------------------------------
- ASIA - 20:00 to 00:00
- LONDON - 02:00 to 05:00
- NY.AM - 09:00 to 11:30
- NY.PM - 13:00 to 16:00
- IMPORTANT
- Session detection is anchored to America/New_York
- Adjust session windows in Session Definitions if your instrument requires different killzones
-----------------------------------------------------------------------------------------------
How To Use
-----------------------------------------------------------------------------------------------
- Add this indicator to intraday charts for clean session reference levels
- Use session opens as reaction levels, anchors, or confluence with your model
- Enable verticals for timing context, disable them for a minimal chart
- Recommended Workflow
- Keep ASIA and LONDON enabled during London / NY overlap
- Keep NY.AM and NY.PM enabled for New York session context
- Lower timeframes (1m–15m) are recommended for best clarity
-----------------------------------------------------------------------------------------------
Settings Guide
-----------------------------------------------------------------------------------------------
- General
- Lookback
- Controls how far back session verticals remain visible
- Options: 1 Day, 3 Days, 5 Days, 1 Week, 1 Month
- Older session markers are pruned automatically for performance and cleanliness
- Highest Timeframe Visibility
- Prevents session visuals from displaying on higher timeframes
- Example: if set to 15m, sessions will not appear on 30m, 1H, or higher
- When exceeded, existing visuals are removed to keep the chart clean
- Session Definitions
- Defines session time windows (New York time)
- Modify these inputs if you want custom session ranges
- Session Opens
- Individual toggles for ASIA, LONDON, NY.AM, and NY.PM
- Custom color per session
- Adjustable line style and line width
- Configurable open label size
- Session Verticals
- Toggle vertical lines at session start and end
- Customize vertical line color and style
- Toggle bottom session name labels
-----------------------------------------------------------------------------------------------
Visual Output
-----------------------------------------------------------------------------------------------
- Horizontal Open Lines
- Plotted at the opening price of each session
- Right-pinned labels using short codes
- asia.open
- lo.open
- nyam.open
- nypm.open
- Vertical Session Lines (Optional)
- Vertical markers at session start and end
- Managed by lookback pruning
- Bottom Session Labels (Optional)
- Session names printed at the bottom of the chart
- Positioned near the midpoint of each session window
-----------------------------------------------------------------------------------------------
Best Practices
-----------------------------------------------------------------------------------------------
- Use 1m–15m for clean intraday session structure
- Disable verticals if you only want

CAHOLD / CBLOHDCAHOLD (Close Above Highest Low Day) and CBLOHD (Close Below Lowest High Day)
The logic is based on identifying pullbacks followed by strength in the direction of the trend, making it useful as a trend-continuation entry signal rather than a reversal tool.
⸻
How CAHOLD Works (Bullish)
1. A sequence of red candles forms (a pullback).
2. The first green candle appears.
3. The script identifies the highest high of the prior red-candle sequence (HOLD).
4. A CAHOLD signal triggers when a green candle closes above that HOLD level.
5. A small green arrow is plotted below the candle.
⸻
How CBLOHD Works (Bearish)
1. A sequence of green candles forms (a bounce).
2. The first red candle appears.
3. The script identifies the lowest low of the prior green-candle sequence (LOHD).
4. A CBLOHD signal triggers when a red candle closes below that LOHD level.
5. A small red arrow is plotted above the candle.
⸻
Optional Filters
• EMA / SMA Trend Filter
Only shows CAHOLDs in uptrends and CBLOHDs in downtrends.
• Minimum Pullback Depth
Requires a minimum number of red/green candles before a signal can trigger.
• ATR Breakout Filter
Requires price to break the level by a volatility-adjusted amount.

RSI(Crypto Market)Indicators applicable to multiple
This is a multi-period RSI indicator combined with a histogram, providing a visually intuitive presentation.

1st 15min 🚦First Candle 🟢🔴🤡
1. Timeframe
• This indicator is designed to be used on the 1-minute (1m) chart.
2. Purple range
• From 9:30 to 9:45 NY time, it records the high and low.
• After 9:45, it locks two purple lines (top and bottom).
3. Activation
• Nothing happens until price breaks above or below the purple range.
4. FVG detection
• Bullish FVG: current candle’s low is above the high from two candles ago.
• Bearish FVG: current candle’s high is below the low from two candles ago.
5. Signals & drawings
• Draws FVG zones with entry and stop-loss levels.
• Trigger candles are colored green (bullish) or red (bearish).
6. Alerts
• Alerts fire for new FVGs, entry hits, and stop-loss hits.

Fractal Reversal Stage 2Fractal Reversal Stage - is a high-precision trend-following and reversal indicator designed to capture market exhaustion points with mathematical accuracy. It utilizes a multi-timeframe analysis approach, combining momentum filtering with price action confirmation.
The indicator is built on a Non-Repainting Algorithm. Once a candle closes and a signal (BUY/SELL) is printed, it is fixed and will not disappear or shift. This makes it a reliable tool for both manual trading and alert-based strategies. The system includes a built-in state machine to manage trades, trailing trend lines, and a re-entry (averaging) system to optimize positions during deep pullbacks.
Main Features
Anti-Repaint Shield: Signals are confirmed only after the candle closes.
MTF Momentum Filter: Uses a higher timeframe RSI to filter out market noise.
State Machine Logic: Automatically tracks your trade from entry to exit.
Dynamic Re-entry: Provides signals to add to a position during extreme volatility.
Manual: Arguments & Settings
1. Timeframes / Таймфреймы
Working TF (Candles): The timeframe where you look for entry patterns and where the trend line is drawn.
RSI Filter TF: The timeframe for the momentum filter. Usually set higher than the Working TF to identify the global trend.
2. RSI Settings / Настройки RSI
RSI Length: The period for RSI calculation. Lower values are more sensitive; higher values are smoother.
Auto-Adjust Levels: When enabled, the script automatically tightens or loosens entry levels based on the RSI period.
Manual OB/OS Levels: Manually set the "Pale Zone" levels where the indicator starts looking for a trade.
3. Logic & Filters / Логика
Re-entry Dist (ATR Mult): Controls how far the price must move against you before an "Add" (▲/▼) signal appears. Uses ATR for volatility adjustment.
ATR Period: The lookback period for volatility calculation.
Min. Body %: A filter for candle strength. It requires the candle body to be a certain percentage of the total candle range to validate a signal.
4. Visuals / Визуал
Trend Line Width: Adjusts the thickness of the tracking line.
Colors: Customizable colors for exit dots and overbought/oversold background zones.
BUY/SELL Labels: Primary entry signals confirmed at the close of the candle.
Chevrons (▲/▼): Averaging points (Re-entry). These appear when the price moves against the initial trade into extreme zones, signaling an opportunity to optimize the position.
Black Dots: Trade Closure. These dots at the end of the trend lines mark the final exit point where the position should be fully closed.
Trend Lines: Visual tracking of the current active trade.
💡 Recommended Settings for Ethereum (ETH/USDT)
This specific configuration is optimized for the cyclical nature of Ethereum, aiming for "peak-to-peak" trade management:
Working TF: 15 min
RSI Filter TF: 2 hours
RSI Length: 10
Re-entry Dist: 1.5
ATR Period: 14
Min. Body %: 0.6
Note: Markets are diverse. You MUST adjust these settings for each specific coin or asset to account for different volatility and liquidity levels.
For questions regarding setup or optimization, please send a private message.
//______________________________________________________________________________//
Fractal Reversal Stage — это высокоточный трендовый и разворотный индикатор, разработанный для фиксации точек истощения рынка с математической точностью. Он использует мультифрактальный анализ, сочетая импульсную фильтрацию с подтверждением ценового действия.
Алгоритм индикатора не перерисовывает график. Как только свеча закрывается и появляется сигнал (BUY/SELL), он фиксируется и больше не исчезает. Это делает его надежным инструментом как для ручной торговли, так и для стратегий на основе алертов. Система включает в себя встроенную логику управления состоянием сделки, линии сопровождения тренда и систему усреднения (Re-entry).
Основные характеристики
Защита от перерисовки: Сигналы подтверждаются только после закрытия свечи.
MTF Фильтр: Использование старшего таймфрейма RSI для фильтрации рыночного шума.
Логика состояний: Автоматическое ведение сделки от входа до выхода.
Динамическое усреднение: Сигналы для добора позиции при экстремальной волатильности.
Мануал: Аргументы и Настройки
1. Timeframes / Таймфреймы
Working TF (Candles): Рабочий таймфрейм свечей, на котором ищутся паттерны и строится линия тренда.
RSI Filter TF: Таймфрейм для RSI фильтра. Обычно ставится выше рабочего для определения глобального тренда.
2. RSI Settings / Настройки RSI
RSI Length: Период расчета RSI. Меньшие значения более чувствительны, большие — более плавные.
Auto-Adjust Levels: При включении скрипт сам корректирует уровни входа в зависимости от периода RSI.
Manual OB/OS Levels: Ручная настройка уровней «бледной зоны», где начинается поиск сделки.
3. Logic & Filters / Логика
Re-entry Dist (ATR Mult): Определяет, как далеко цена должна уйти против вас, чтобы появился сигнал «Add» (▲/▼). Использует ATR для подстройки под волатильность.
ATR Period: Период усреднения волатильности.
Min. Body %: Фильтр силы свечи. Требует, чтобы тело свечи составляло определенный % от всего диапазона свечи.
4. Visuals / Визуал
Метки BUY/SELL: Основные сигналы на вход, подтвержденные закрытием свечи.
Шевроны (▲/▼): Точки для усреднения (Re-entry). Появляются, когда цена идет против сделки в экстремальные зоны, давая сигнал на добор позиции.
Чёрные точки: Закрытие сделки. Эти точки на концах линий тренда обозначают место выхода, где позиция должна быть полностью закрыта.
Линии тренда: Визуальное сопровождение активной сделки.
💡 Пример настройки для Ethereum (ETH/USDT)
Данная конфигурация оптимизирована для цикличного движения Эфира и нацелена на максимально точный выход на пиках:
Рабочий ТФ: 15 мин
ТФ Фильтра RSI: 2 часа
Период RSI: 10
Dist. Re-entry: 1.5
ATR Period: 14
Мин. тело свечи: 0.6
Важно: Рынки различаются. Вы ДОЛЖНЫ подбирать индивидуальные настройки для каждой монеты или актива, учитывая их волатильность и ликвидность.
По вопросам настройки и оптимизации пишите в личные сообщения.

Candles by Day of WeekCandles by Day of Week
Candles by Day of Week (INLINE) is a lightweight visual indicator that colors price candles based on the day of the week.
It helps traders quickly recognize weekly patterns, market behavior differences, and day-specific tendencies directly on the chart.
🔹 Key Features
Candle coloring for Monday through Sunday
Enable or disable each weekday individually
Custom color selection for every day
Day enable toggle and color input are combined in one line for cleaner settings
Uses barcolor() — no candle shifting or overlay issues
Compatible with all markets: Forex, Crypto, Stocks, Indices
Works on all timeframes
🔹 How It Works
The indicator detects the day of the week for each candle and applies the selected color if that day is enabled.
Disabled days keep the chart’s default candle colors unchanged.
This approach ensures:
No interference with price data
No displacement from the main chart
Full compatibility with other indicators
🔹 Practical Use
Analyze weekday-based market behavior
Spot recurring patterns or volatility by day
Improve discretionary and session-based strategies
Enhance chart readability and visual clarity
🔹 Notes
Saturday and Sunday candles are mainly relevant for Crypto markets
Forex traders may choose to disable weekend days
The indicator is purely visual and does not affect calculations or signals
🔹 Customization
All settings can be adjusted in the indicator’s Inputs:
Toggle individual days on or off
Select custom candle colors per day
Instantly adapt the indicator to your trading style
🔹 Disclaimer
This indicator is intended for visual analysis only and should be used as a supportive tool alongside other forms of technical analysis.
It does not provide buy or sell signals.

Opening Range Manipulation DetectorBasic indicator that checks the 15m opening candle to see if it's a manipulation candle or not. You can use aq threshold of 20 to 25% for indices like NQ, ES, YM, or RTY.


Jpi for LIFEEEEhmm like idk it kinda just marks out with a veritcal line 8am nyc 10:30 nyc and 10am nyc idk why but like ye ig its comfortable
