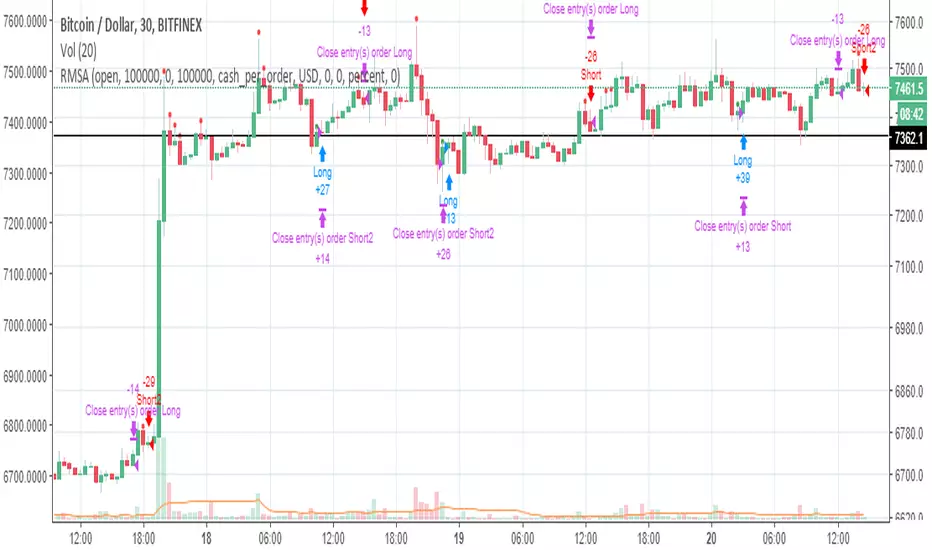
RMSA - Strategy - BTC/IOT/BCH/EOS - no repaintHey just build this strategy that uses multiple indicators to set buy and sell orders. If you want access just write a comment.
I tested only BTCUSD, IOTUSD, BCHUSD, EOSUSD and EOSBTC. Use the checkbars to select the pair, only 1 checkbar should be used.
Works only in 30 Min.
2 Strategys for BTC und IOT available.
If you want other pairs wirte a comment I'll try to get some good parameters.
Have fun trading and testing.
By the way its not using indicators of higher timeframes, so its not repainting.
Центральные осцилляторы
GPS_Strategy_V01Momentum based strategy. This is work in development, not really applicable for real trading yet. Looks great on 4H BTCUSD, or 1H ETCUSD lol. Generally should give really reliable entry points, exits, not so much. Will try to finish it up, when I find the time.

MACD_CM_MTF_RSI_WaveTrend [PlungerMen]hello!
This Script version I made for a friend named Huu Trung
this Script version have:
MTF MACD, wave trend Cross, sri
you can change everything and hide in the setting plot

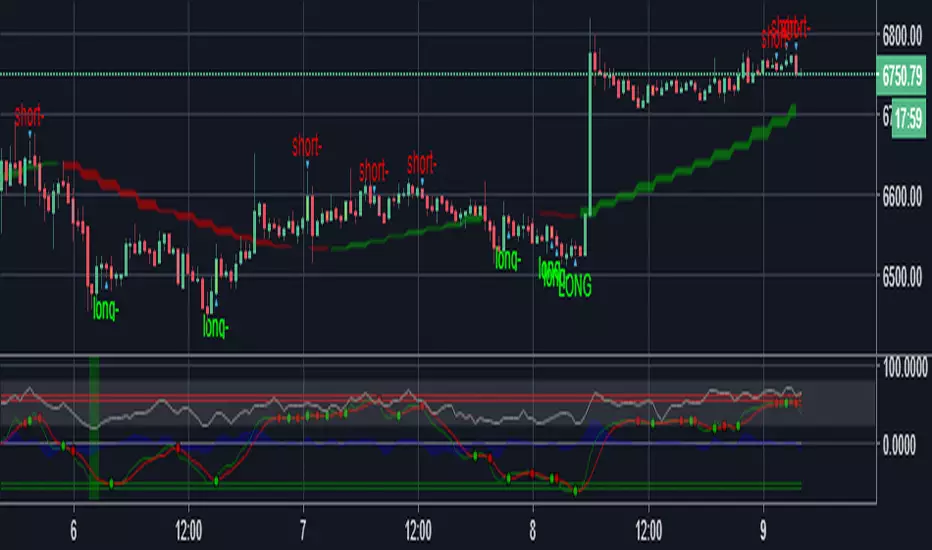
Bitmex Scalping PRO [PlungerMen]Hello!
Bitmex Scalping PRO can use for every coin
Bitmex Scalping PRO Available option for all frames
This Script is very well used as it works by itself and very well used in conjunction with the "Bitmex Long Short" script, both compliment for each other. the "Bitmex Long Short" script is Free, you can find it
If you want to be more accurate and more efficient, more comfortable when you do not want to see too many other indicators, you can register for our Professional edition.
- The Professional Edition supports Level 1 and Level 2 commands ( display at chart : LONG+, long-, SHORT,+,short- ), which are very effective in allocating funds and optimizing your profits
Besides that,You will be supported by personal preferences, profit maximization
- Register for a Professional version will be used 2 Script,Bimex Scalping Pro and Bitmex Long Short Pro
- We will invite you to the signal channel Telgram with the announcement of the bottom and the peak of the BTC -0.13% ,the big variable variable has exists
**We hope you enjoy this script. Your support will help us develop more good quality scripts in the future to serve the community **
**Remember, Like this script and posivite feedback if you are satisfied**
if you have any questions, post a comment ... below here
*********** Guide:
+ option for all frames : Click setting and input high and low for time inteval
+ hide wave trend : Click setting -> click Style --> Up trend Fill or Down trend fill
******
We have the Script free for the user pass, search keyword " Bitmex Scalping PlungerMen"
-->> 0.2 eth/1 month will be used 2 Script: Bimex Scalping Pro and Bitmex Long Short Pro <--
Thanks !
Bimex Scalping [PlungerMen] 15mHello!
This free community edition is very good for a 15 minute time frame
This Script is very well used as it works by itself and very well used in conjunction with the "Bitmex Long Short" script, both compliment for each other. the "Bitmex Long Short" script is Free, you can find it
If you want to be more accurate and more efficient, more comfortable when you do not want to see too many other indicators, you can register for our Professional edition.
- The Professional Edition supports Level 1 and Level 2 commands, which are very effective in allocating funds and optimizing your profits
Besides that,You will be supported by personal preferences, profit maximization
- Register for a Professional version will be used 2 Script,Bimex Scalping Pro and Bitmex Long Short Pro
- We will invite you to the signal channel with the announcement of the bottom and the peak of the BTC ,the big variable variable has exists
We hope you enjoy this script. Your support will help us develop more good quality scripts in the future to serve the community
**Remember, Like this script and posivite feedback if you are satisfied**
if you have any questions Plz post a comment ... below here
******
Thanks


Bands + RSIThis strategy uses the RSI indicator together with the Bollinger Bands to sell when the price is above the upper Bollinger Band (and to buy when this value is below the lower band). This simple strategy only triggers when both the RSI and the Bollinger Band indicators are at the same time in a overbought or oversold condition.

Silver Trading SignalNOTE 1: Only for S
NOTE 2: Only for timeframe : 30 Minute
Gold and Silver both trade the same way, opposite of DXY but silver fluctuations are higher and different from Gold. This script has been optimized for Silver only, not for gold.
How to trade:
Just see the signals for buy and sell on the chart.
Give your feedback after testing this strategy. :)


Omni Trader Accompanying Backtesting StrategyVersion 1.0
Purpose
This backtesting strategy indicator is a accompanying tool for use with my popular trading and alert indicator: Omni Trader | RMI EMA RSI VOL | Margin Focused Indicator
Reference Indicator Link:
Features
This strategy has been programmed to act exactly how the accompanying indicator would be used with an automated strategy such as Autoview or through manual trading
Has identical coloured signals with correct icons for reference with the indicators standard alert conditions (LONG/SHORT)
The ability to toggle on or off all the logic and UI presets you could previously use to enhance the standard indicator
Fully customisable in the settings regarding trading strategy to match exactly how you have the reference indicator set up with alerts or how you are trading manually with it.
Ability to choose a timeframe, want to ignore the crypto boom at the latter stages of 2017? Sure you can, change the time frames in the settings to see a more recent representation of your trades.
Stop Loss & Take Profit enabled in this back tester for fine tuning of your strategy, especially useful for automated users to refine the most profitable settings for your style.
Access
This indicator is free for existing owners of my Omni Trader | RMI EMA RSI VOL | Margin Focused Indicator linked above as an accompanying tool to improve their strategy and net more profit. If you would like access to any of my indicators or would like to know more please find me on my community discord channel where you can find indicator details/documentation and general help:
Discord Link: discord.gg
Thank you for the immense support everyone, happy trading!
- Falco

[STRATEGY]Kagi Emulator OCC & SLTP V3It is a Kagi candle emulator without resolution multiplier.
Also with take profit and stop loss.
Modify the value of "reversal" according to current symbol.
It's the backtest, coming soon, same script but with no-repainting alerts
Enjoy!

Wave & Trend Accompanying Backtesting StrategyVersion 1.0
Purpose
This backtesting strategy indicator is a accompanying tool for use with my popular trading and alert indicator: Wave & Trend Autoview Advanced Indicator & Alerts
Reference Indicator Link:
Features
This strategy has been programmed to act exactly how the accompanying indicator would be used with an automated strategy such as Autoview or through manual trading
Has identical coloured signals with correct icons for reference with the indicators standard alert conditions (BUY/SELL)
The ability to toggle on or off all the logic and UI presets you could previously use to enhance the standard indicator
No short / longs for the most accurate representation of buys and sells, The strategy will keep buying on every optimal signal (+1 order quantity each time) and then sell all assets on a met sell condition (-all quantity), matching exactly how the reference indicator is used to buy/sell on eg. Binance and also give the most accurate statistics.
Fully customisable in the settings regarding trading strategy to match exactly how you have the reference indicator set up with alerts or how you are trading manually with it.
Ability to choose a timeframe, want to ignore the crypto boom at the latter stages of 2017? Sure you can, change the time frames in the settings to see a more recent representation of your trades.
Access
This indicator is free for existing owners of my Wave & Trend Indicator linked above as an accompanying tool to improve their strategy and net more profit. If you would like access to any of my indicators or would like to know more please find me on my community discord channel where you can find indicator details/documentation and general help:
Discord Link: discord.gg
Thank you for the immense support everyone, happy trading!
- Falco

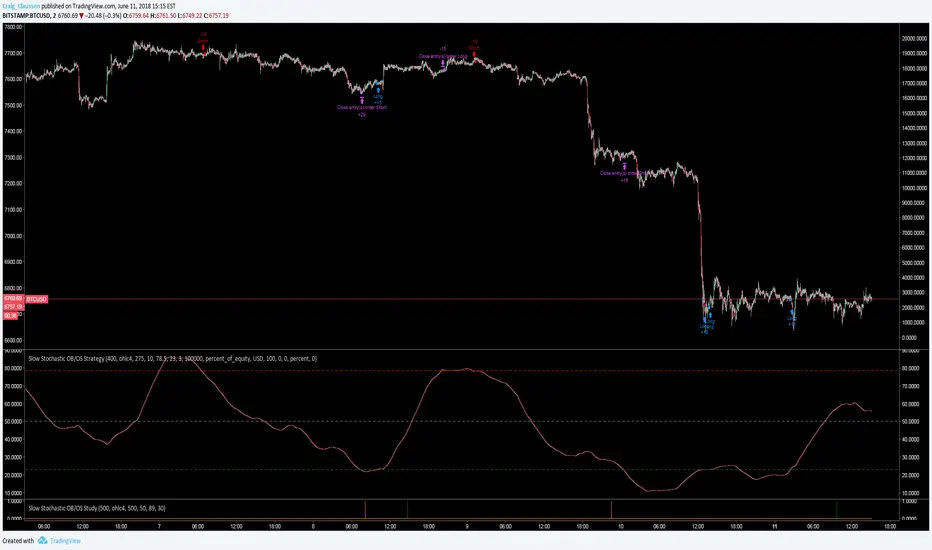
Slow Stochastic OB/OS StrategySame concept as my Slow RSI strategy script
But in Stoch format
I'm finding that i like Slow Stoch better than Slow RSi
This chart also includes exit guards.
It's up to you to decide if you want to pyramid or not. This chart is set at pyramid = 3
Dynamic Momentum Index (DMI) Backtest This indicator plots Dynamic Momentum Index indicator. The Dynamic Momentum
Index (DMI) was developed by Tushar Chande and Stanley Kroll. The indicator
is covered in detail in their book The New Technical Trader.
The DMI is identical to Welles Wilder`s Relative Strength Index except the
number of periods is variable rather than fixed. The variability of the time
periods used in the DMI is controlled by the recent volatility of prices.
The more volatile the prices, the more sensitive the DMI is to price changes.
In other words, the DMI will use more time periods during quiet markets, and
less during active markets. The maximum time periods the DMI can reach is 30
and the minimum is 3. This calculation method is similar to the Variable
Moving Average, also developed by Tushar Chande.
The advantage of using a variable length time period when calculating the RSI
is that it overcomes the negative effects of smoothing, which often obscure short-term moves.
The volatility index used in controlling the time periods in the DMI is based
on a calculation using a five period standard deviation and a ten period average
of the standard deviation.
You can change long to short in the Input Settings
WARNING:
- For purpose educate only
- This script to change bars colors.

Simplex Trend ShifterThis indicator identifies the tops and bottoms within the specific time frame; good for market reversals. Long and Short entry position specially for day traders.
HOW TO USE
1. Buy when the background color turns to green - represents an uptrend
2. Sell when the background color turns to red - represents a downtrend or to lock in your profits
3. No color means Flat market/Squeeze
You are free to customize the time frame as you want, depends upon the user trading style.
For more details and samples. You can check the link here sellfy.com
Happy Trading! :)


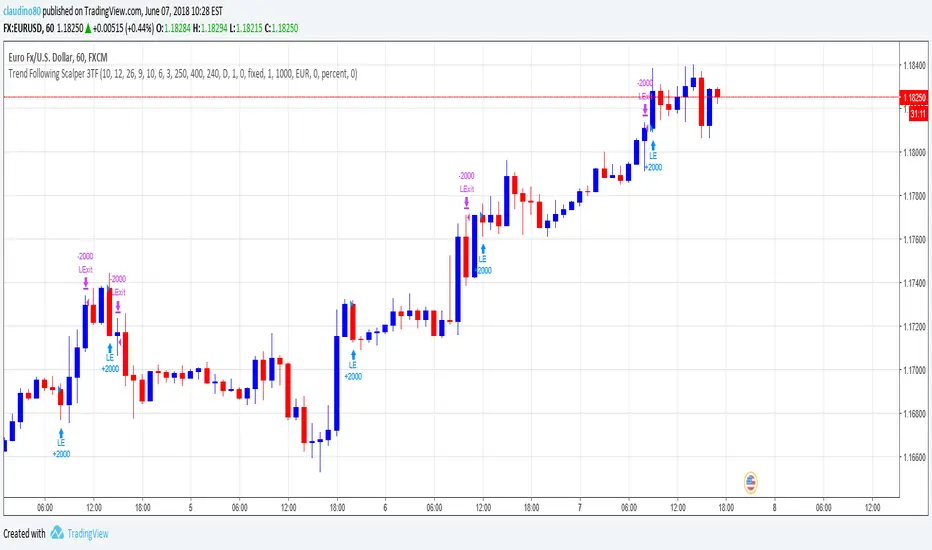
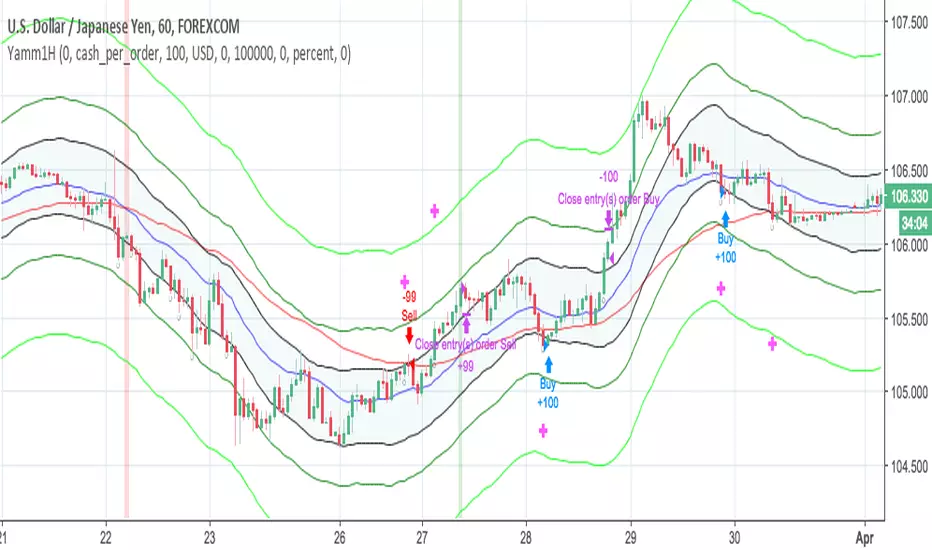
Trend Following Scalper 3 Time FramseDo you think it is a good idea to use the Stochastic / MACD / EMA and cross check THREE timeframes to detect a new trend?
If you think that it would be a good idea, this is the script that you are looking for.
The Trend Following Scalper (3 Time Frames) script has been developed to automate the trading activity by detecting a new trend and by scalping a fixed amount of pips each trade. That is why it is called Trend Following Scalper.
How does the script detect the new trend?
The beginning of the new trend is detected on the lower timeframe (1H is the suggested one) by joining the information of the Stochastic, MACD and Exponential Moving Average.
Once a potential trade has been detected on lower timeframe, the script confirms it by looking the upper timeframe (e.g. Daily + H4) by gathering the same indicator / parameter information.
If the threes timeframes are moving in the same direction, the script open a new trade.
Why do we need to merge lower and higher timeframe before open the trade?
The lower timeframe shows a shorter Price Action context. The short price action context has a short life! By looking at the higher time frames context the script tries to exclude the short life counter-trend moves. At the end, a new trade is open only if the higher timeframe context supports the lower timeframe indication.
What about the Risk-Reward (following RR) ratio?
The RR is set by default as 1.6 (stop loss 25 pips and take profit 40 pips).
This configuration has been heavily tested on multiple crosses and it has shown a good Equity Line with a low Drawdown.
(Note: the stop loss and take profit can be changed by the user via the parameter pages. Suggest RR > 1.5)
What about the accuracy of the Script?
The average script accuracy is > 55% on the H1 time frame (tested with various crosses).
With this accuracy, and by risking 0.6% of the capital each trade, your capital will grow > 25% every 100 trades.
What about the drawdown?
It depends on the capital and the size of the position used on each trade.
For example, with an initial capital of 1000 Euros and by risking 0.6% of the capital each trade, the drawdown is close to 3%.
(The strategy tester result has been calculated starting from January 2017. The strategy produced 527E (i.e. 52% gain) starting from a 1000E capital and risking 0.5% each trade)
Do you want to try the script? Please write me!
Do you have some question? Please write me!