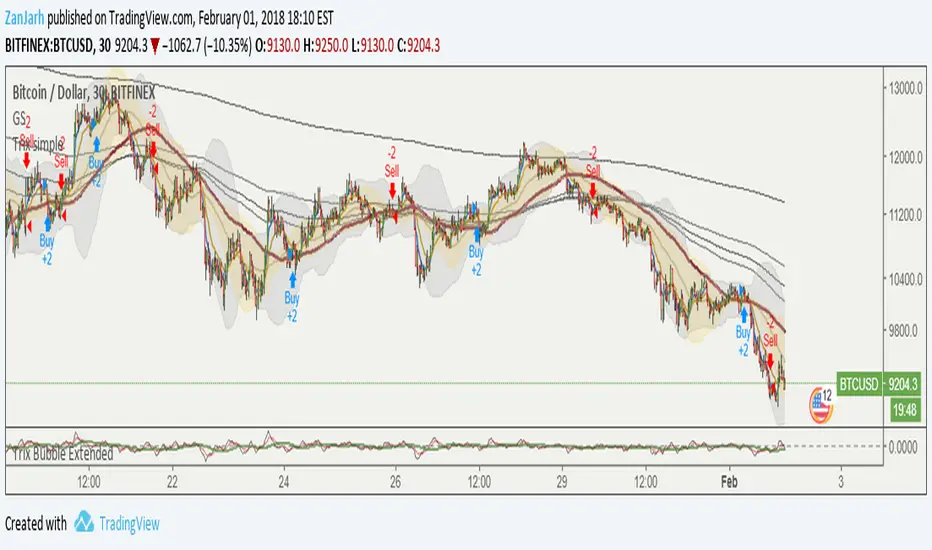
Trend'n Stuff_(MA's and Trix)It's a simple trend following system. Play with the setups. Works best on 30min and up timeframes. Look at the code for better understanding.
Центральные осцилляторы
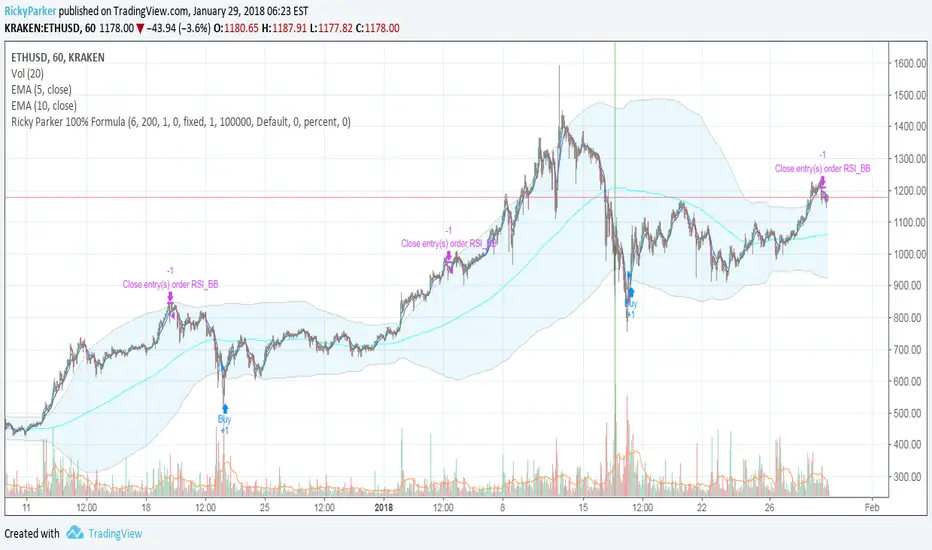
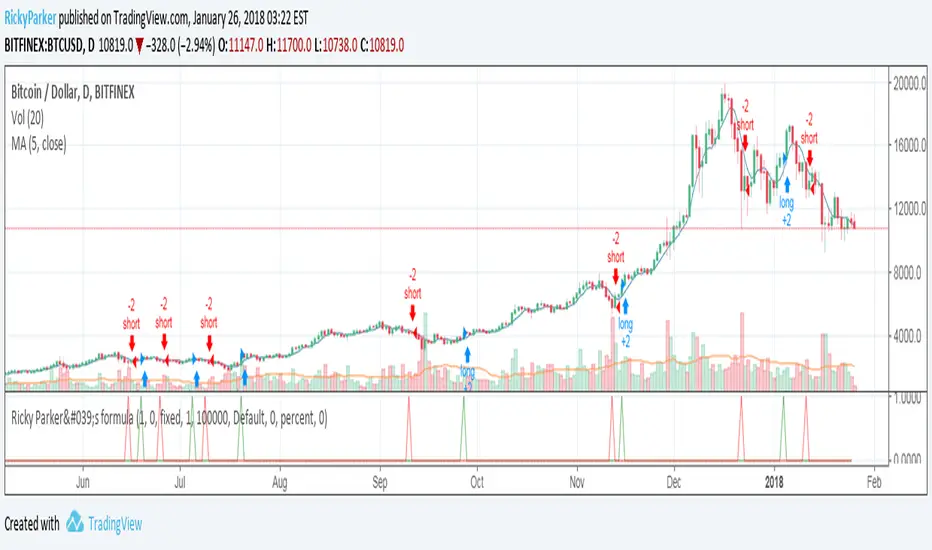
Ricky Parker Day Chart 100% Earn Formula for Bitcoin 4 Hr ChartRicky Parker Day Chart 100% Earn Formula for Bitcoin 4 Hr Chart

Strategy Testing Advanced Buy/Sell SignalsThis is strategy testing my Advanced Buy/Sell Signal script found here
TradingView is limited to strategy testing based on close price, so this is actually buying/selling a day later than each arrow. This does not repaint- arrows appear in realtime on the actual script, which is nice because that makes it useful.


HA+I strategy by C.Molti fix sopratutto al riconoscimento del trend. non ci siamo ancora ma credo si tratti solo di fine tuning dei parametri ;)

Smoothened Williams Accumulation/Distribution (Williams AD) Accumulation is a term used to describe a market controlled by buyers;
whereas distribution is defined by a market controlled by sellers.
Williams recommends trading this indicator based on divergences:
Distribution of the security is indicated when the security is making
a new high and the A/D indicator is failing to make a new high. Sell.
Accumulation of the security is indicated when the security is making
a new low and the A/D indicator is failing to make a new low. Buy.
You can change long to short in the Input Settings
WARNING:
- For purpose educate only
- This script to change bars colors.

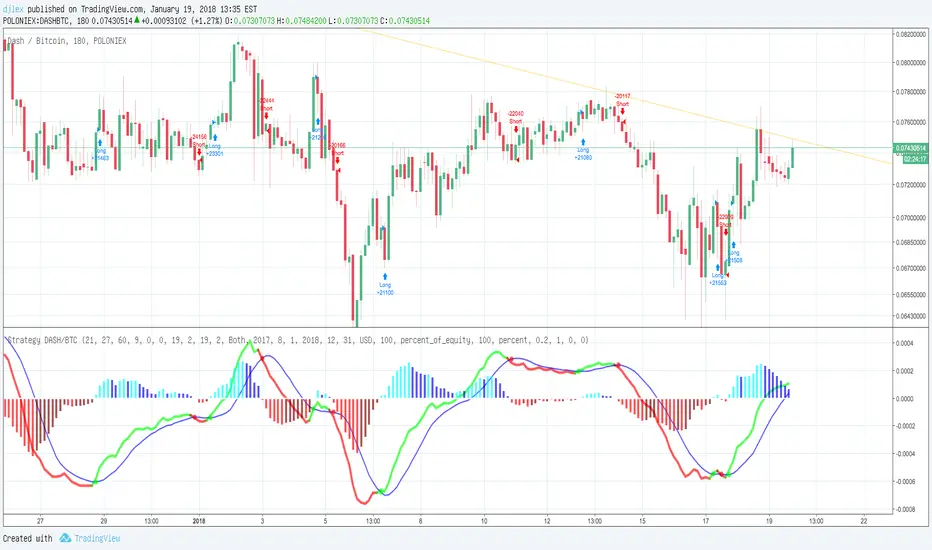
MACD Strategy V2.0 DASH/BTC 3H
MACD STRATEGY Calculate for DASH/BTC 3H with 100 Dollar and FEE? s (0.2%)
Autoview qualified Study Script
For Margin Trading (Poloniex)
ULTIMATE PINE INJECTOR V1.2 INSERT
MACD Created by user ChrisMoody
NO REPAINT
With Stopp Loss and Trailing Stopp and Backtest
6 Mon = 600%
LFH/ Long positions using MACD histogram, long EMA and short EMADisclaimer: I'm a noob.
Hey there!
I'm trying to implement a script which enter market long position when long EMA crossover short EMA and MACD histogram is positive and histogram at T time is lesser than histogram at T-1.
And when short EMA crossover long EMA, plus MACD histogram is negative and histogram at T is greater than histogram at T-1, I want the script to exit market long position.
Now, I have something pretty close to what I am looking for. What I am missing and can't figure out yet is:
How to moderate entries, ie. I would like it to enter positions when trends are really interesting not just every time the conditions are fulfilled (same for exits) as there is way too much positions
I need to find a way to exit appropriated positions.

Parabolic SAR Strategy with good parametersI tested it on EURUSD with 2% profit:
Set input parameters like here: screenshots.firefox.com

Williams Accumulation/Distribution (Williams AD) Backtest Accumulation is a term used to describe a market controlled by buyers;
whereas distribution is defined by a market controlled by sellers.
Williams recommends trading this indicator based on divergences:
Distribution of the security is indicated when the security is making
a new high and the A/D indicator is failing to make a new high. Sell.
Accumulation of the security is indicated when the security is making
a new low and the A/D indicator is failing to make a new low. Buy.
You can change long to short in the Input Settings
WARNING:
- For purpose educate only
- This script to change bars colors.

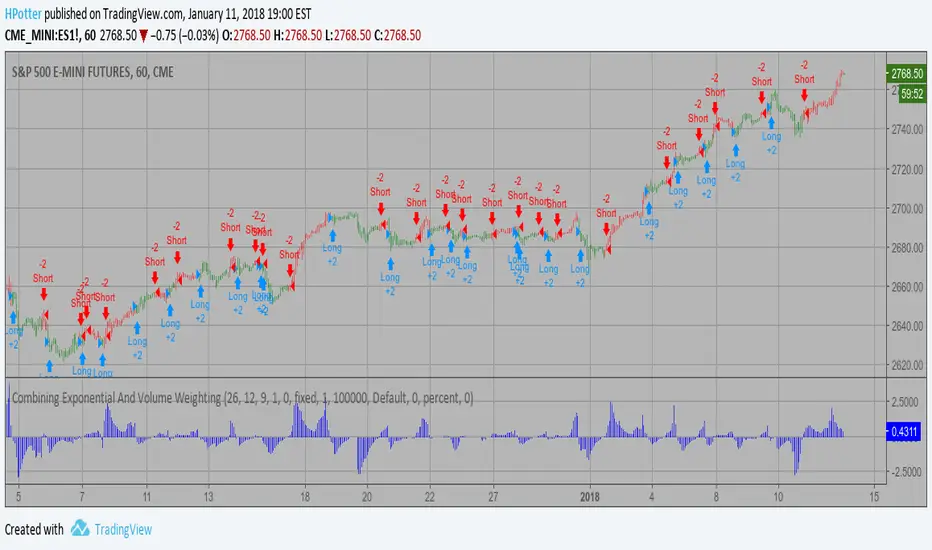
Combining Exponential And Volume Weighting Backtest The related article is copyrighted material from Stocks & Commodities 2009 Oct
You can change long to short in the Input Settings
WARNING:
- For purpose educate only
- This script to change bars colors.

CM Chris MACD - Strategy - Modified by FrancisRosarioThis one utlized " MacD Custom Indicator-Multiple Time Frame " By Chris Moody, I've turned it to strategy.
Additional Features will be added soon like utilizing Parabolic SAR..
Next feature I'll filter the bad signals..
All Credits to Chris Moody.

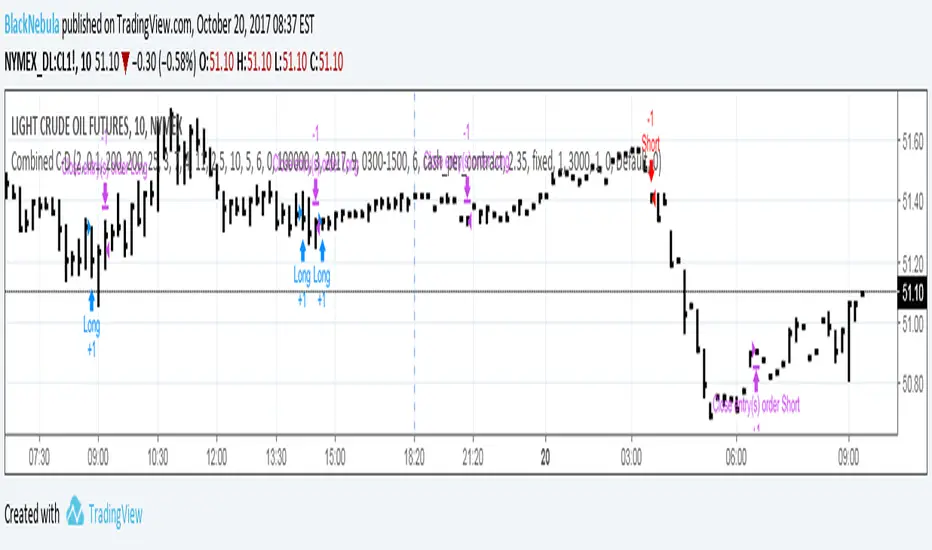
CB: CCI & MFI StrategyCustom Development for a Backtest Rookies professional services customer. Published for customer testing and acceptance.
backtest-rookies.com

PST - Protege Swing TradingThis is my most powerfull indicator to date.
Best results on 4h.
Buy at signal and hold for a couple of days.

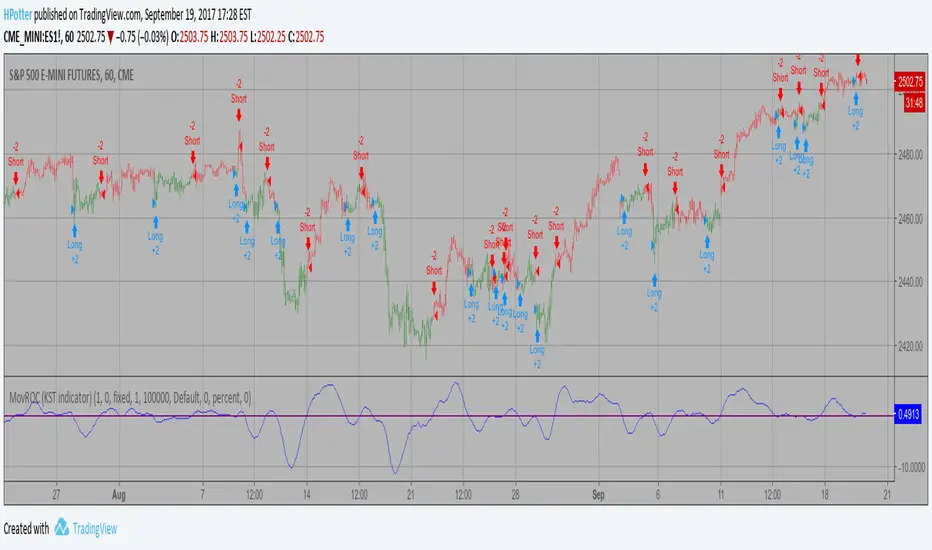
MovROC (KST indicator) Backtes This indicator really is the KST indicator presented by Martin Pring.
the KST indicator is a weighted summed rate of change oscillator that
is designed to identify meaningful turns. Various smoothed rate of change
indicators can be combined to form different measurements of cycles.
You can change long to short in the Input Settings
WARNING:
- For purpose educate only
- This script to change bars colors.
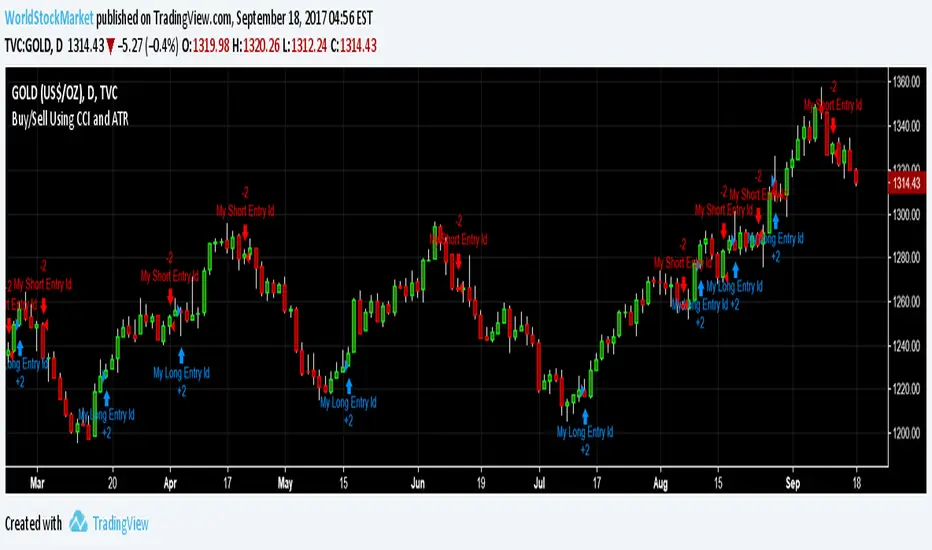
Buy/Sell Using CCI and ATRDetermining Buy/Sell Entries by Crossover of two CCI and Wave analysis by ATR.