4hr chart Moving Average Ribbon in daysUse this for the 4hr chart view.
Adapted from the MMAR standard so that I can see daily MA/SMA's directly from the 4hr chart. regular counts included and day counts shown in titles.
I use this with the 50ma, 14 daily, 30 daily, 50 daily, 100 & 200 daily active, the rest disabled.
Enjoy.
Chart

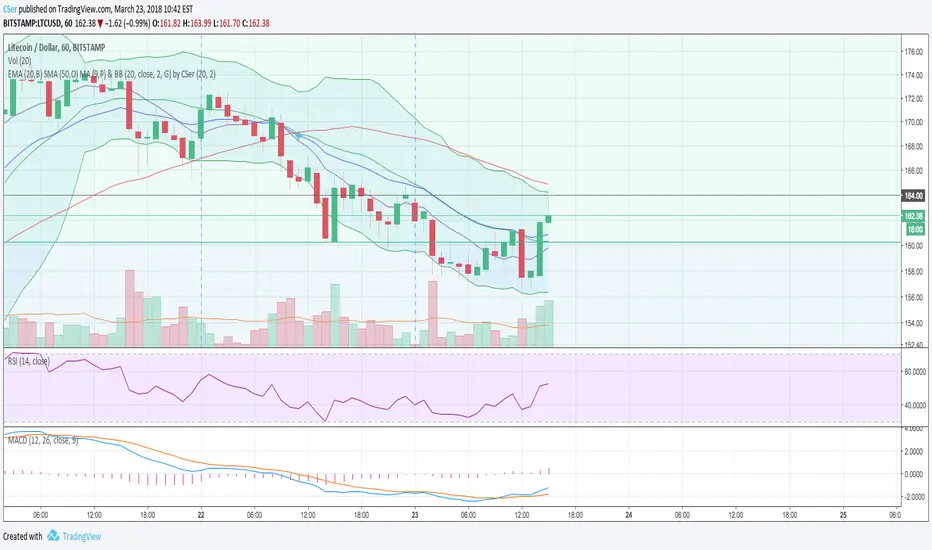
Moving Averages & Bollinger Bands by CSerCombination of Bollinger Bands (20, close, 2) and EMA (20), SMA (50) and the default MA (9) with the addition of crosses for EMA and SMA for quick decisions. Let me know your thoughts, corrections and/or additions.
EMA / SMA / MA by CSerCombination of EMA (20), SMA (50) and the default MA (9) with the addition of crosses for EMA and SMA for quick decisions. Let me know your thoughts, corrections and/or additions.
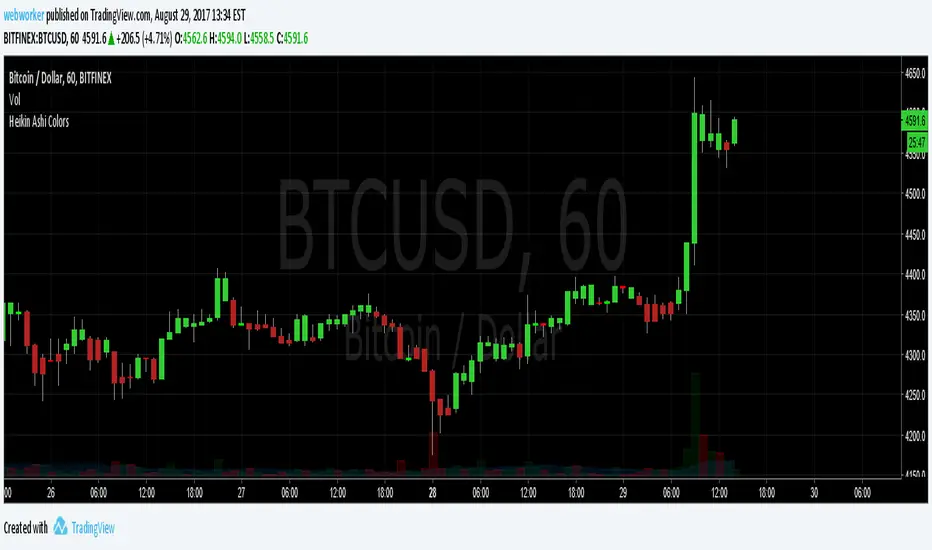
Heikin Ashi ColorsThis script simply changes the colors on your candle and hollow candle charts to Heikin Ashi style colors without changing the values of the bars.
Great for visualizing trends, but getting an accurate picture of prices!
cooltoyz: shadow candlesAnother tool for the cooltoyz series :)
tired of having to look at multiple time frames for a ticker, and having to mentally mix them to try to guess/visualize trends, or support/resistance levels? so was i, and with this tool i let the chart do the heavy lifting :)
with this, upper time frames are visualized as shadows imposed on the chart itself. there are two levels:
level 1 - represented with strong green/red for candle body, and a thin line for the candle wicks
level 2 - light green/red for the candle body, lighter still for the wicks
it was the best visually appealing representation i could come with, if you find a better one share it in comments, please :)
basically works the same as the previous tool, the ghost candle, but with two levels of time frames superimposed. the same notes and warnings from the ghost candle apply, so go read them, too lazy for a copypasta :)
you can find the ghost candle here:

Double Bottom Chart Pattern with alertDouble bottom is a very common chart pattern, as its name indicates, it consists of two bottoms, and these two bottoms need to be in a relative flat price level. One of the bottom can't be much higher or lower than the other.
This indicator will detect and highlight double bottom pattern automatically on chart and alert you via SMS, email and sound.
Features:
Adjust the threshold between two bottoms.
Adjust the number of bars used to form each bottom.
Check if the first bottom is the highest in a given number of bars
Adjust the number of bars between two bottoms.
Switch of alert.
It works on all timeframes and any symbol.
You can also load more than one with different inputs to get more results on chart.

cooltoyz: ghost candleThis is a tool. Do with it what you like :)
The ghost candle works by drawing a bigger time frame candles in ghost mode over a chart. The time frame is default of 4h, can be changed in the "format" pop-up.
What we see in a time frame as the "wick", is really a set of candles when looked at lower resolutions/timeframes, that info is crunched into the OHLC format. But, when we look at a represntation of the "internals" of a candle, the wicks are not just a single candle that "walked out of the reservation".
So, in this ghost mode, a wick makes no sense visually. In this case, the OHLC is represented as a darker area for the main candle body, and lighter zones for the wicks. Just another way to sing the same song...
Note 1: the ghost candles are skewed, due to the way that TV plots a line. It's most visible when a chart is very zoomed.
Note 2:As result of the TV real time engine, the last candle presents sometimes mixed colors. There's no easy way to fix it, so until the candle closes, if you see weird colors, well, that's life :)

reallifetrading.com DeanMA + vwap w/ 50+200 smaThis script functions in 2 modes, "intraday" & daily/weekly/monthly.
By changing your chart to any "intraday" timeframe, this mode will automatically switch based on which timeframe you are view on your TradingView charts.
INTRADAY: the script will show the "Dean Moving Average" (10ema on 15/min). NOTE: This 10ema on 15/min will calculate correctly even if using a 5 min chart.
DAILY/WEEKLY/MONTHLY: the script will show the 50 sma in green and 200 sma in purple. If you are viewing a daily chart, it will show the 50-daily sma, if you are viewing a weekly chart, it will show the 50-week sma, etc.
Any questions: DM me

HiLo high low bar chart type, patternsmartThis is the HiLo style bar type, it's a built-in chart type in some other platfomrs.
//For any custom programming task on any platform, please contact us

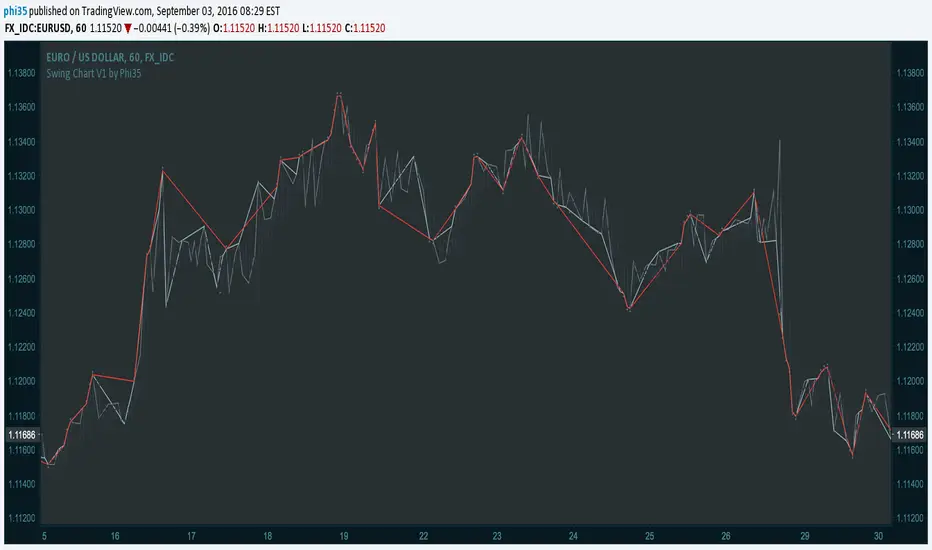
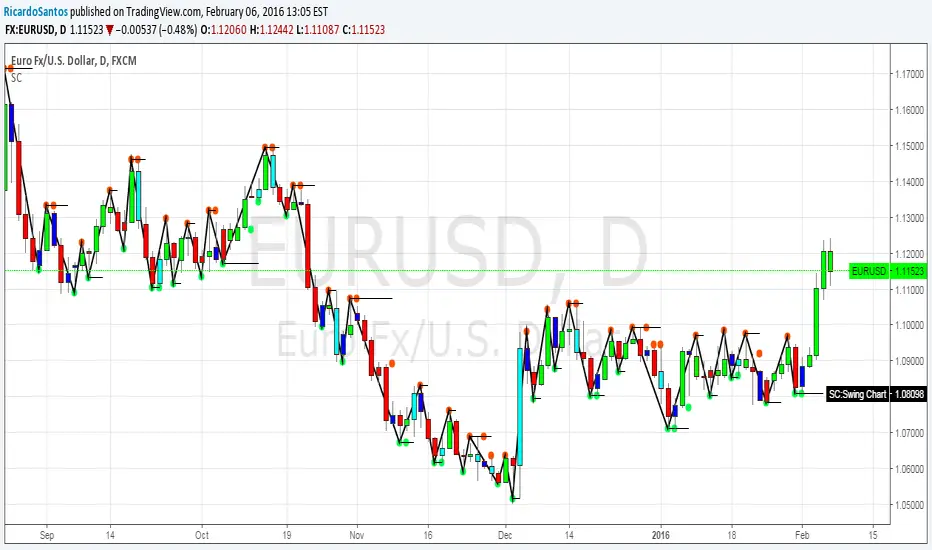
Swing Chart V1 by Phi35 © With this indicator, which plots the swing chart of the 3 degrees, swing traders can automate their work of tracking the right bars.
How it works:
Minor Degree (one bar) (gray)= If the current high is higher than the previous high or the current low is lower than the previous low.
Intermediate Degree (two bar) (baby blue)= If the current high is higher than previous and the penultimate high etc.
Main Degree (three bar) (red)= If the current high is higher than the previous, the penultimate and the high before penultimate high etc.
Alert:
On crossover there will be an alert (popup with a message) and in addition you will see "diamonds" on the place where the crossover took place
If there is an issue or any suggestions, feel free to contact me. Do not modify the code without permission.
Swing Chart V1 by Phi35 ©

Value Chart [TMC]*** April 20, 2015 - NEW UPDATE ***
Added classic color scheme and additional lines. Updated source: pastebin.com
April 10, 2015 - Updated version of Value Chart - candles draw correctly now.
Requires cover layer to be set as same color as your background. (white in default)
I hope you will enjoy it. :)
