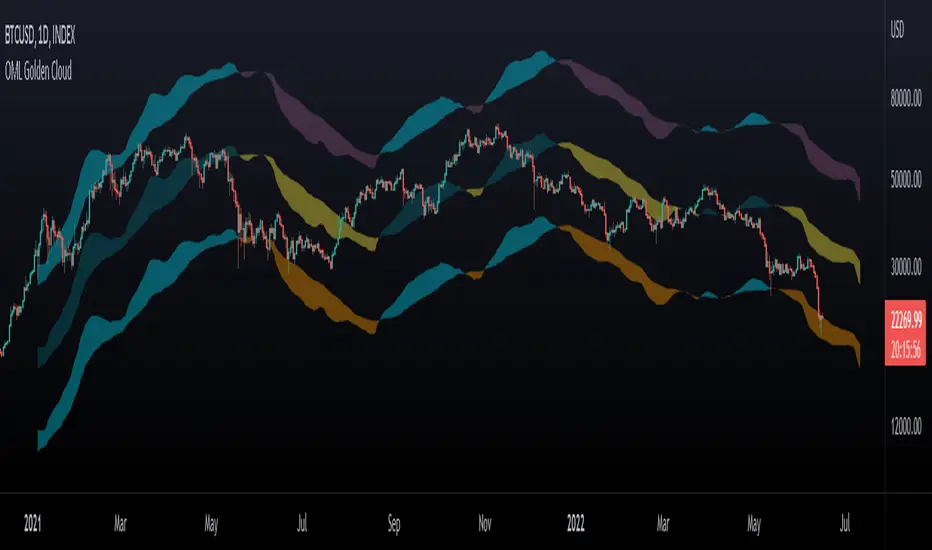
OhManLan Golden CloudThis indicator is a modification of the popular Ichimoku indicator, build high/low channels using the Golden Ratio, Volume-weighted average price allows smoother components.
high/low channels moves based on Fibo Levels (Golden Ratio: 1.618).
- Settings -
The indicator can be adjusted to your needs.
- How to use -
OhManLan Golden can be used a Support/Resistance , Stop loss, Trailing stop and Price target.
Volume-weighted average price allows smoother components.
Can be used with other indicators such as Moving Average Convergence Divergence (MACD).
Cloud
Double Ichimoku Cloud with drop-down selectable lookback periodsThis script will display two Kumo Clouds. The overlap between the clouds can be areas of high support or resistance. I've included a drop-down selector for a variety of common lookback periods. Experiments show that the 10-30-60-30 settings can be more applicable to the FOREX and Crypto markets.
Bogdan Ciocoiu - CoordinatorDescription
The Coordinator is an indicator developed on the back of the RSI algorithm, modified substantially to form a cloud. In addition, the Coordinator uses EMA/SMA to compare the location of the RSI cloud with the chosen moving averages (EMA vs SMA).
This indicator is helpful as it confirms when a trader should enter a position or exit based on the proximity of the RSI cloud to the relevant MA.
Uniqueness
The Coordinator provides unique benefits, including:
It shows the strength of the RSI in the shape of the RSI cloud, using two sets of dimensions (one more long term and one more short-term oriented).
It indicates the positioning of the RSI cloud in conjunction with the relevant moving averages to help traders remain in positions for longer.
It shows the RSI 14 (useful when spotting divergences aligned with the price action).
Open-source
The Coordinator uses the following open-source scripts:
www.tradingview.com

Ichimoku VariationsThe Ichimoku cloud is traditionally constructed from the highest high and lowest low for a number of periods. This script allows for it to be transformed and calculated like more traditional moving averages (e.g. simple moving average, exponential moving average). Since the Ichimoku is normally a system of moving average-like lines, maybe someone out there will learn something from being able to switch to sma, ema, etc etc.
In general, I think no TA indicator is a magic bullet, and you should just use what you like!
Credit: This script utilizes the "Color Gradient Framework" tutorial by LucF (PineCoders) to create gradient visuals, which are also customizable for the user.
Recommended modes:
default
SMA
EMA
SMMA
WMA
VWMA
Tillson T3
Not Recommended (These moving averages are too fast, and probably will require adjusting settings to something like the 20-60-120-30 to make more sense):
HMA
EHMA
TEMA
ALMA
LSMA

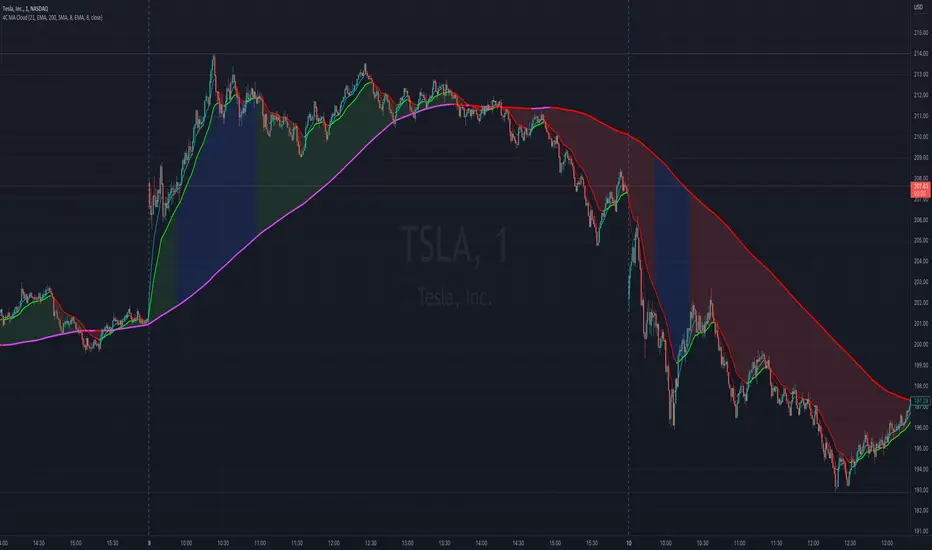
4C Moving Avg CloudThis indicator plots 2 moving averages with a cloud filling the area between the two.
It has the unique ability to choose between multiple moving average types, AND also paints the average based on slope direction, all in one indicator.
Most of the available moving average cloud indictors only allow one type of moving average for both averages together (e.g. 21 EMA with 200 EMA; or 21 SMA with 200 SMA)
The 4C Moving Avg Cloud features the ability to choose a different average type for each of the moving averages, and can be mixed and matched (e.g. 21 EMA with 200 SMA; or 21 RMA with 200 EMA; etc...)
Offers a selection for each of the moving averages to choose between: EMA, SMA, RMA, WMA
Credit: Some aspects of this part of the 4C moving avg cloud indicator were adapted from the "Best Cloud All MA" indicator @author=Daveatt
Another unique aspect of this moving avg cloud indicator is that is paints the moving average lines based on slope direction.
If the slope direction of the avg is up, it is painted one color, and if the avg is sloping down, it is painted another color (default: red).
This slope coloring is based on a 1 period lookback, and cant be adjusted.
Momentum CloudThis is a modified Ichimoku Cloud:
-The default Lookback-Length and Displacement settings have been modified to operate optimally on 24/7 markets - which is popular among Crypto analysts.
-The Lagging Span, Base Line, and Conversion Line have been removed - leaving just the bare cloud.
-Additionally, the Cloud's color will shift blue when it is compressed. (More specifically - when Leading Span A retreats to Leading Span B, the color changes.)
This allows the user to easily identify when the Cloud is "thinning", either to the upside, or the downside.
Being that the "spread" or "width" of an Ichimoku Cloud generally gauges it's efficacy as potential Support or Resistance, this tool is particularly useful for highlighting when momentum is weakening.
*This script will be updated in the future to allow the user to view the Momentum Cloud of alternate time-frames! (e.g, Viewing the 1D Momentum Cloud on the 1H timeframe)

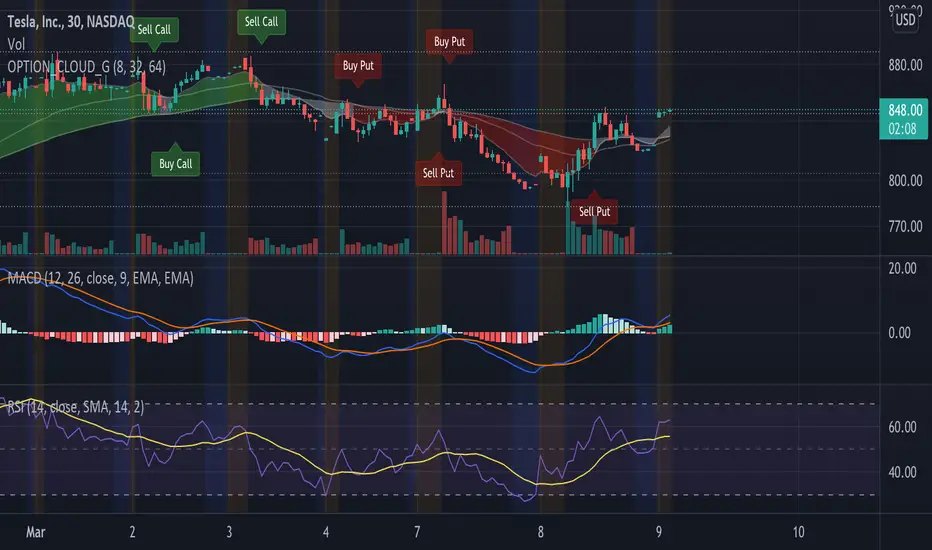
EMA Options Clouds With SignalsEMA Clouds for Options!
This indicator can help you confidently open and close options positions. Note that you should set stop a little below midline EMA . Risk reward for good signals is fairly consistent in profit. Most of the simulations I ran got between 1:2 and 1:4 profits. The losers usually can be avoided by making sure you are not in a choppy trading channel. Wait for EMAs to start separating and don't blindly follow every buy/sell.
3 wave EMA + Clouds:
Defaults:
EMA 8/32/64
Signals (off by default - turn on in settings):
Buy Call/Sell Call (open/exit call positions)
Buy Put/Sell Put (open/exit put positions)
Enter signals bullish:
Close over Middle EMA AND Short EMA > Middle EMA > Long EMA
Exit signals bullish:
Close under Middle EMA OR trend turns bearish (Short EMA < Middle EMA < Long EMA )
Enter signals bearish:
Close under Middle EMA AND Short EMA < Middle EMA < Long EMA
Exit signals bearish:
Close over Middle EMA OR Short EMA > Middle EMA > Long EMA
Cloud Colors (Default)
Green: Bullish
Red: Bearish
White: Chop/Transition
Average True Range (VStop) Cloud SignalsThis indicator extends the built-in Volatility Stop indicator to a visual signals type indicator based on the crossover of a small VStop value (default 1.5x ATR) and a larger VStop value (default 3x ATR). The two values form a "cloud" with default coloring based on RSI/strength of trend.

Price Clouds Oscillator (PCO)This is the oscillator version of Price Clouds (PS). Use this with (PS) for best results.
This indicator shows you over bought and over sold regions similarly to to rsi or stochastic. This indicator centers a moving average around the hl2 of the price. This is calculated as the difference of four moving averages. The signal line shows you how much momentum in any given direction you have. You can also see how much volatility there is by the band width. Just like the Bollinger band high volatility comes before low volatility and visa versa. You can also see what the market is doing based on the signal crosses. If the fast line is above the slow line you are going up and visa versa. This indicator works in most markets, especially crypto. There is a tool tip for every aspect of this indicator explaining how everything works.
Key Feature:
>See where the price is relative to a mean price
>Measure volatility
>Clean global settings
>Normalization feature lets you scale the band from 0 to 1. You loose some information but its easier to use if you aren't measuring volatility.
I hope you are very profitable with this one!
If you find this indicator is useful to you, Star it, Follow, Donate, Like and Share.
Your support is a highly motivation for me.
PCO
----------------------/\-----
-------------/\----/----\---
\----------/----\/--------\-
--\------/------------------
----\_/---------------------

INDIGO - Cloud System ©INDIGO Cloud System ©
This script shows the monthly dip and peak zones and the daily highs & lows.
The green zone is the dip zone. It's the place to enter a long position if you think there is or will be a reversal.
The red zone is the peak zone. It's the place to enter a short position if you think there is or will be a reversal.
The script uses the INDIGO Cloud System ©, the Ultimate RSI and the Market Direction Indicator to find an entry at the most optimal point in space and time.
The exit for the long trade is on the purple line and the exit for the short trade is on the blue line.
It also has an RSI exit to minimize the risk of a sudden reversal in the wrong direction while in trade.
You can set TP and SL to see the effects of it on the chart. Be aware that these change a lot of trades so use it wisely.
The labels are connected to alerts to notify you of a possible entry or exit.
This script uses the Ultimate RSI by ChrisMoody, thanks for creating this Chris !
This script also uses the Market Direction Indicator by LazyBear, great script !
You can use the MD Filter to filter out some bad trades. It decreases losses but also some profits.
Experiment with the settings, each pairing needs different settings.
--> Use this script at your own risk. Do your own research, never invest money you're not willing to lose and never put your trust in one indicator !
To my best knowledge this script doesn't repaint. I never use the close and only use high/low when value can't be untrue again. If you find repainting in this script PLEASE let me know !
Feel free to contact me for questions or feedback.
Enjoy the script :)

Heikin Ashi Cloud overlayThis script displays a cloud representing the bodies of Heikin Ashi candles, which allows to have all the information of the HA technique without losing focus on the classical candles.
Also has arrows to indicate a trend reversal (counterproductive in a range !)
Time Segmented Volume with divergence and Kumo cloud backgroundThis is a Time Segmented Volume (TSV) indicator with added divergence hunter, crossing signals, Kumo cloud background and alert functions
Please keep in mind that this indicator is a tool and not a strategy, do not blindly trade signals, do your own research first!

MA CloudMA Cloud - a highly configurable cloud for Moving Averages
Creates a cloud from max. 5 Moving Averages.
Users can freely decide, for each average wether it should be SMA,EMA or WMA and also for the time period.
They shades and colors can be freely chose for each combination of MA's, giving you a maximum freedom to configure your cloud.

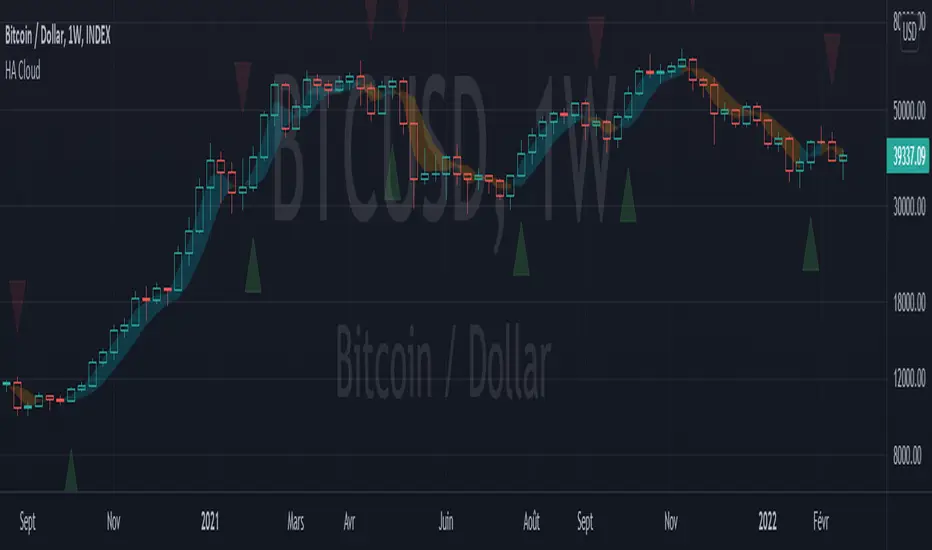
Trend Indicator A-V2 (Smoothed Heikin Ashi Cloud)"Trend Indicator A-V2" and "Trend Indicator B-V2" are updated and improved versions of my initial trend indicators. Totally rethinking the code, adding highs and lows in the calculations, including some more customisation through colour schemes.
In practice, this indicator uses EMAs and Heikin Ashi to provide an overall idea of the trend.
The "Trend Indicator A-V2" is an overlay showing “Smoothed Heikin Ashi” .
The "Trend Indicator B-V2" uses the same values in a different way to measure the momentum of the trend and identify potential trend rejections.
Please, take into account that it is a lagging indicator.

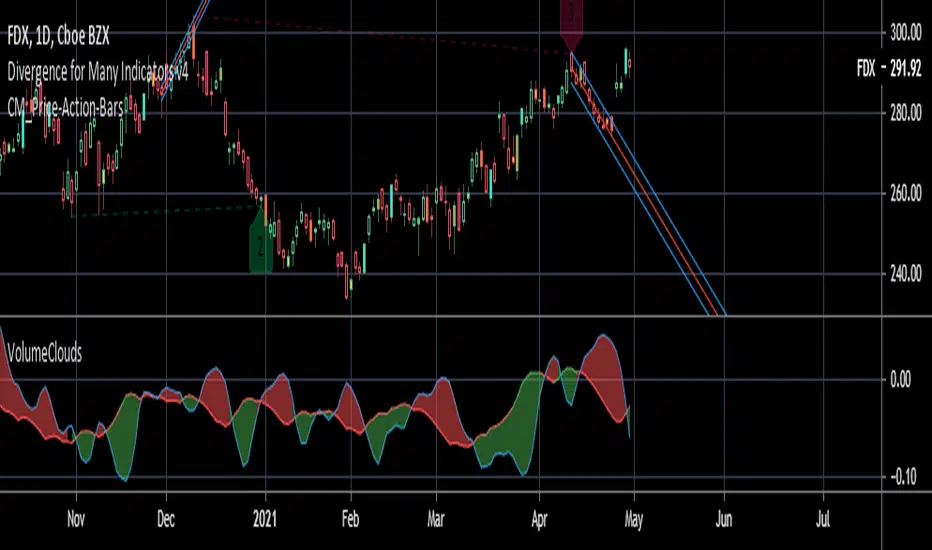
VolumeCloudsNYSE:FDX
Volume clouds is a unique tragedy that predicts trend strength with normalized price and volume data, this allows us to quickly respond to small price movements than a traditional EMA cloud stragedy.
How to use:
1. Figure out overall trend direction using color of cloud, green -> bullish & red -> bearish
2. Figure out volume growth and decay using shape of clouds -> Wide cloud? LOTS of volume & Shrinking cloud? volume dying & trend reversal
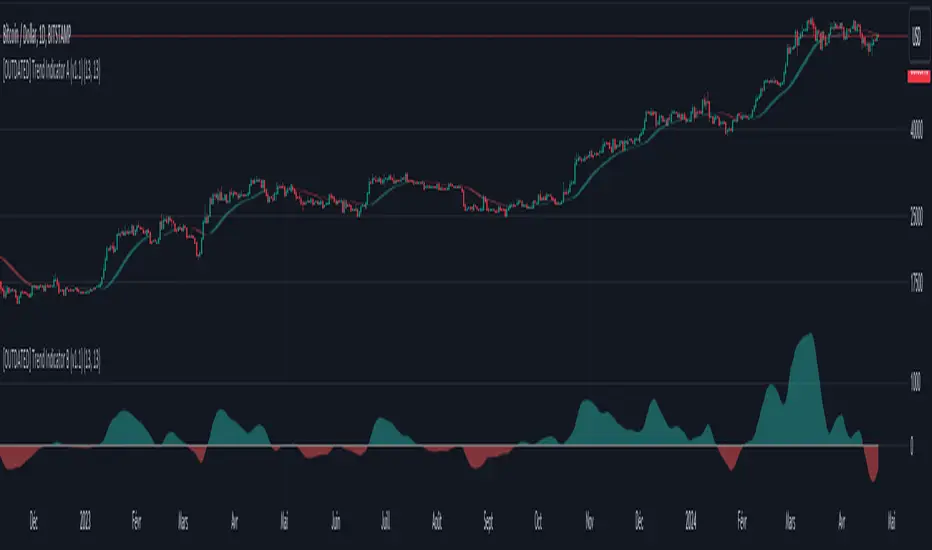
Dziwne Trend Indicator A (EMA + Heikin Ashi cloud)First script ever publish.
It is a very simple trend indicator based on EMAs and Heikin Ashi .
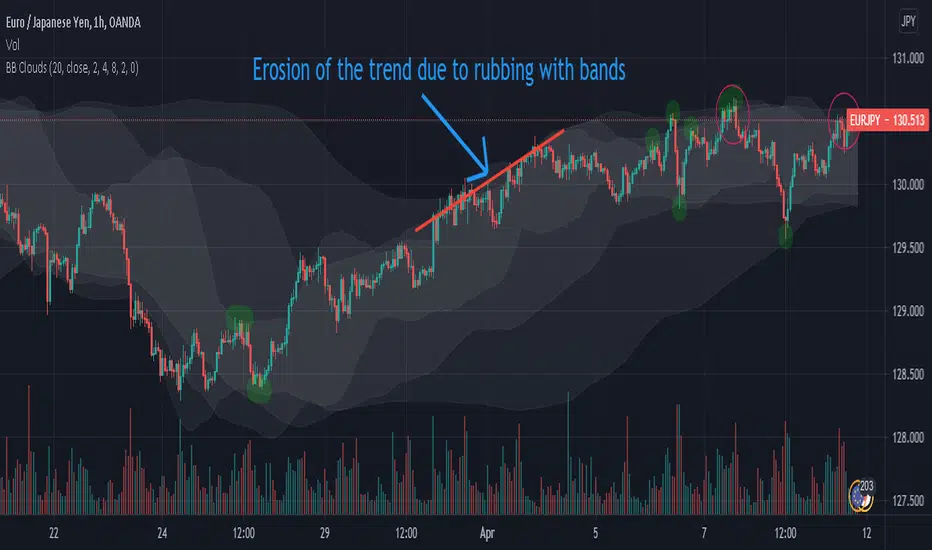
Bollinger Bands Clouds - BB CloudsBollinger Bands Clouds provides Bollinger Bands of different timeframes in a chart.
It actually shows BB from a new angles.
This indicator can show three BB from different timeframes simultaneously.
The idea is to be able to combine different levels of BB from other timeframes in one chart
Each cloud is a Bollinger band whose time frame is a multiple of the current chart time frame. If this multiplier is set to 1, its Bollinger bands will be drawn for the current time frame and will be no different from normal Bollinger bands.
This indicator can be suitable for fractal perspective.
Multipliers can be changed from within the indicator settings:
settings -> mult1, mult2 and mult3
For a dark theme, enable the Dark Theme option from the indicator settings.
Altered True Strength Indicator (TSI) Reupload-
Altered TSI provides a slightly more volatile signal that demonstrates extremities in price action with greater success than standard TSI. In addition, I added bull/bear cross indicators (green/red) to make it easier to notice the crosses to save time when the market is moving fast (I couldn't find a regular TSI script with this addition). Finally, the signal also has overextension parameters (red and green lines)
I think this is best used on Intraday time frames as the signals respond to volatility very well and using Heikin Ashi candles, trend is more visual. In this particular example, I am showing SPY on the 3m time chart (my favorite short time frame) and the signal alone provided many opportunities for trades when using simple divergences and countering overextension direction when short term (blue) signal crosses either
In the first example (purple lines), SPY ramps but it was a dull signal given the signal strength flatlining- we would be looking for a short entry. When the signal fires, it provides a clean $1.50 move down in spy.
In the second example (orange), the blue signal provides a nice V shape (rebound signal) in which we are looking for a long entry. 390.50 is a strong SPY support in confluence with 2nd std dev VWAP extension, but disregarding that bull signal fires resulting in a 2 dollar move upwards. Exit is provided when blue line crosses green overextension.
In the third example (white), we are searching for a short entry at 392.5 resistance in confluence with divergently higher highs. Bear cross signal when fired and a significant cross is visible provides a $2.50 move to the downside with a potential exit provided when blue line crosses red overextension line in confluence with previous LOD area.
In the fourth example (green), we watch as the blue line provides a V pattern, we are searching for a long entry. If you didn't take a riskier long at 2nd std dev VWAP overextension with V recovery on blue line at red overextension for a ride to vwap, then you are looking for a secondary entry long as you wouldn't take the trade at resistance (vwap). Bullishly divergent lows provide this entry and the signal does not bear cross at all (but looking for significant crosses is more important even if the signal were to make a minor bear cross). Bullishly divergent double bottom provides a long entry to end of day with a nice clean signal for a $5.00 move until eod or when signal crosses overextension range.
Ideally, close to the money options or SPY/SPXS/SPXL are best used in the intraday time frame.
Again, this is not a standalone indicator but it's best used in conjunction with other indicators/trading strategies
Any questions feel free to comment

Moving Average CloudThis moving average cloud is comprised of 7 individual moving averages; those averages are rendered as a cloud, using the minimum and maximum value of all the averages as the lower and upper boundaries. It's basically a moving average ribbon, without all the individual MA lines cluttering the view.
By rendering as a cloud, this allows other potentially useful lines to be rendered within the cloud; a middle line is rendered, along with "mid high" and "mid low" lines.
The following parameters are available:
Min MA Length - the shortest MA window represented by the cloud
Max MA Length - the largest MA window represented by the cloud
Mid-High - the location of the mid-high line within the cloud
Mid-Low - the location of the mid-low line within the cloud
MA Type - you can choose between SMA, WMA and EMA moving average types
Interpretation:
When the price is above the cloud, this indicates a bullish trend.
When the price is around the middle, trend could be transitioning.
When the price is below the cloud, this indicates a bearish trend.
Use in confluence with other indicators.

MACD BandsThis is MACD indicator on the price chart. You can read the same information as the original MACD but much more.
You can use it the same way as MACD but it won't use any space below your chart. Also you can use signal line and cloud as trend confirmation: e.g. if above them it can be a stronger uptrend.
The signal line (yellow by default) can be used as a support-resistance line.
If teal line is above maroon line, MACD is positive, otherwise it is negative
MACD value is the width of the cloud
Cloud color is green when MACD histogram is positive, red if negative
You can change MA types
MACD and histogram values can be seen in Data Window

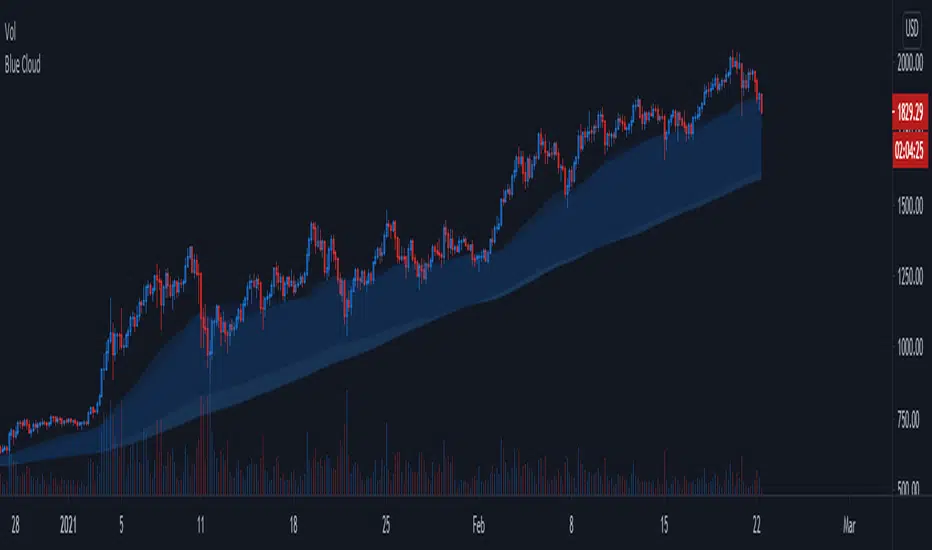
Blue CloudTrend Indicator
- Based on 4h 50/200 ma/ema
- Static, same accross all timeframes
- Works best with trending assets (espacially altcoins)
- 4h 50/200 ma/ema 's are transparent by default but can be enabled to improve visibility
Blue Cloud = Bullish, cloud often acts as support
Red Cloud = Bearish, cloud often acts as resistance
Everything RSIThis indicator includes:
RSI Candles set to the default 14 length (un check Borders in the Style tab to see the candlesticks better)
I like using the wicks as an early warning for a possible trend change, which is generally in the opposite direction of the wicks.
It's also easier for me to draw trend lines using the RSI Candles vs the rsi plot line.
40 ema of the RSI Candles
2nd RSI set to the 20 length , which plots just inside the wicks of the RSI Candles. This RSI also highlights Oversold and Overbought levels.
I sometimes leave the RSI Candle Borders checked and use the 20 RSI plot with the wicks of the RSI Candles
Signals to look for Short or Long opportunities , which use the 5 sma of the RSI Candles crossing under the overbought and over the
oversold levels. If you'd like to plot the 5 sma, remove the // at the beginning of the code on line 72.
3nd RSI set to the default 14 length which can be set to a different timeframe as the current chart. Default setting is the 1h.
This RSI plots a + at the top of the indicator when it's above the 50 level and an x at the bottom of the indicator when it's below the 50 level.
For me, this is just a visual aid when I'm scalping on lower timeframes.
If the 1h RSI is above the 50 level, I focus on long scalps. If the 1h RSI is below the 50 level, I focus on short scalps.
RSI Cloud which is formed by filling in the area between the 14 ema of both the 7 RSI and 28 RSI.
I used part of @FnM_Capital 's Trend-Sniper script for my RSI Candles. Thank you! You're extremely talented and deserve all of the credit for your work.
I'd also like to thank @SeanNance for answering all of my random coding questions!!!
I've added the indicator to the example twice to show a couple of the ways I view the RSI's.
The top indicator shows the RSI Candle Borders "un checked" and without the 2nd RSI plot.
The bottom indicator shows RSI Candle Borders "checked", using 2nd RSI plot with the RSI Candle Wicks.

Ichimoku with offset includedBased on the idea that some Donchian Channels in trading books have a lookback or offset of 1 in order to use it as a sort of trailing stop or so that the channels don't adjust. Ichimoku's Tenkan and Kijun lines have a very similar formula to Donchian Channels. In case anyone wants to use those lines as a sort of more fixed trailing stop, offset the Kijun, Tenkan, Span B, and/or treat it like Donchian Channels and such in the Ichimoku system, I included an offset of 1 as the default. To change this indicator to a standard regular looking Ichimoku, just change the offset value to 0.
The formula seems a bit different to what Tradingview has for their own version of Ichimoku but it's the same as many other programmers here. I made the colors as close to the traditional colors seen in books and other places and Tradingview as much as I could think of. Ichimoku has many different variations out there and to add the the confusion can have many different strategies to go with it. If you have any suggestions or tips, please let me know.