StockLeave Signal BarThe indicator identifies potential trade entries by highlighting expansion and reversal bars. These are defined by individual bar characteristics and refined by contextual factors such as price position relative to structural boundaries. The purpose is to locate bars that could indicate potential market initiation.
Expansion Bars
The expansion captures bars that breakout from a period of reduced volatility. These often initiate directional movement and are recognized using a two-part definition:
Range Expansion The current bar’s range must exceed the average range. This ensures the move is comparatively large and stands out from recent behavior.
Range Compression The bars before the expansion must be below a threshold of the average range. This confirms a low-volatility lead-up, strengthening the likelihood that the expansion has significance.
This script applies additional filters. A local breakout ensures price breaks the previous bar’s high or low. A strong close confirms directional intent by requiring the close near the bar’s extreme. Mean proximity checks that expansion starts near the mean price using a dynamic buffer relative to bar size. A directional filter blocks signals during extended directional runs. Consecutive suppression prevents multiple expansions to show in succession.
Reversal Bars
Reversal setups aim to identify potential turning points after price has reached a zone of imbalance or extension. These bars typically exhibit long tails and occur near structural boundaries such as the outer Keltner bands. Their design favors short-term price rejection and potential reversal.
Tail Dominance The wick must be at least twice the body and make up a significant portion of the bar’s total range, signaling strong rejection rather than indecision.
Close Location The close should be near the opposite end of the wick, near the low for bearish signals and near the high for bullish, confirming pressure in the reversal direction.
This script applies additional filters. Local extreme ensures the bar marks a local turning point to confirm reversals occur after extension, not within structure. Boundary proximity requires the bar to appear near the outer envelope, aligning bearish signals with the upper band and bullish with the lower, indicating price has reached an area of likely imbalance.
This section also incorporate snapback reversals, designed to capture failed extensions beyond structural boundaries. Unlike single-bar rejections, snapbacks use a two-bar sequence: a strong impulse bar that closes outside the envelope, followed by a reversal bar that closes back inside.
Alert Configuration
The Signal Bars indicator includes an alert function with two built-in conditions to help reduce screen time and focus attention when predefined conditions are met.
Expansion: Alerts when a bar meets all conditions for a valid expansion.
Reversal: Alerts when a bar meets the criteria for a pin bar or snapback reversal.
These are built into the indicator with the alertcondition() function and can be turned on whenever the indicator is applied to a chart. Each alert includes a default message that uses dynamic placeholders; {{ticker}} for the symbol and {{interval}} for the timeframe.
Create a new alert and select the condition “StockLeave Signal Bars.”
Then select from the two options: Expansion and Reversal.
For expansions, select “once per bar” to capture developing momentum.
For reversals, use “once per bar close” to confirm rejection setups.
Apply alerts across multiple timeframes to improve coverage. Lower timeframes are better suited for fast-moving markets, while higher timeframes work well in slower or more selective environments. This process only needs to be done once. The created alerts can then be toggled on or off from the Alerts panel as preferred, without requiring reconfiguration.
Applied Discretion
The indicator functions on fixed logic, but interpretation always takes precedence. Consider price action, structure, volatility, and broader market context. Most signals will not lead to trades; while many may appear in a session, only a select few will align with context and warrant execution based on discretion.
Contraction-expansion

Master Pattern [UAlgo]🔶 Description:
"Master Pattern by UAlgo" aims to identify and visualize "Master Patterns" in price movements on financial charts, and focusing on detecting liquidity levels and sweeps. The indicator provides users with the ability to customize settings such as master pattern detection and detection flexibility, sensitivity to liquidity levels, and visualization preferences.
🔶 What is the Master Pattern ?
The Master Pattern is a framework built around understanding market cycles, which include three main phases: Contraction, Expansion, and Trend.
Contraction Phase: During this phase, the market fluctuates less and consolidates within a narrow range. Institutional trading volumes tend to be low and it is recommended to avoid trading entries during this period.
Expansion Phase: volatility increases and prices fluctuate greatly. Institutional traders begin to establish positions at this stage and may manipulate prices to attract retail traders to create liquidity for their own buy or sell targets.
Trend Phase: The final phase that completes the market cycle. Institutional traders started taking profits, causing the trend to reverse. This triggered panic among retail traders, leading to liquidations and stop-losses. This creates liquidity from which institutional traders can profit, while retail traders' positions are overvalued.
🔶 Key Features:
Pattern Detection : The indicator detects and visualizes contraction patterns in price movements, helping traders identify potential areas of price consolidation.
Also traders can choose between different modes (Strict, Normal, Relax) for obtaining master patterns, providing flexibility in pattern identification based on individual trading strategies and preferences.
The Value/Expansion Line : This value line is considered by institutional traders as a potential “Point of Origin” for future price movements.
An Application Example of the Master Pattern :
Select the Appropriate Timeframes: A significant separation between the higher timeframe (HTF) and the lower timeframe (LTF) is essential. For instance, combinations like 4H and 15M, 4H and 5M, or 1H and 1M. You can change this according to your own strategy.
Trade Based on Contraction Box, Value Line and Liquidity: When the HTF is above value, look for buying opportunities on your LTF below value. Conversely, when the HTF is below value, seek selling opportunities on your LTF above value. Sweeping liquidity in LTF is also an important parameter.
Also Value/Expansion Line can also be used as Support/Resistance zone,
Liquidity Levels : The indicator includes functionality to detect and display liquidity levels on the chart.
Dashboard Display : A customizable dashboard provides users with key information, including liquidity levels, master pattern values, and whether the current price is above or below Master Pattern's value lines.
Additionally, when liquidity is swept or the price rises above or falls below the value line. this information can be displayed on the dashboard.
Customizable Settings: Users can adjust parameters such as the pattern detection mode, sensitivity to liquidity levels, liquidity type (cumulative or individual for each swing), visualization preferences for master patterns, the position and font size of the dashboard.
🔶 Disclaimer:
Use with Caution: This indicator is provided for educational and informational purposes only and should not be considered as financial advice. Users should exercise caution and perform their own analysis before making trading decisions based on the indicator's signals.
Not Financial Advice: The information provided by this indicator does not constitute financial advice, and the creator (UAlgo) shall not be held responsible for any trading losses incurred as a result of using this indicator.
Backtesting Recommended: Traders are encouraged to backtest the indicator thoroughly on historical data before using it in live trading to assess its performance and suitability for their trading strategies.
Risk Management: Trading involves inherent risks, and users should implement proper risk management strategies, including but not limited to stop-loss orders and position sizing, to mitigate potential losses.
No Guarantees: The accuracy and reliability of the indicator's signals cannot be guaranteed, as they are based on historical price data and past performance may not be indicative of future results.

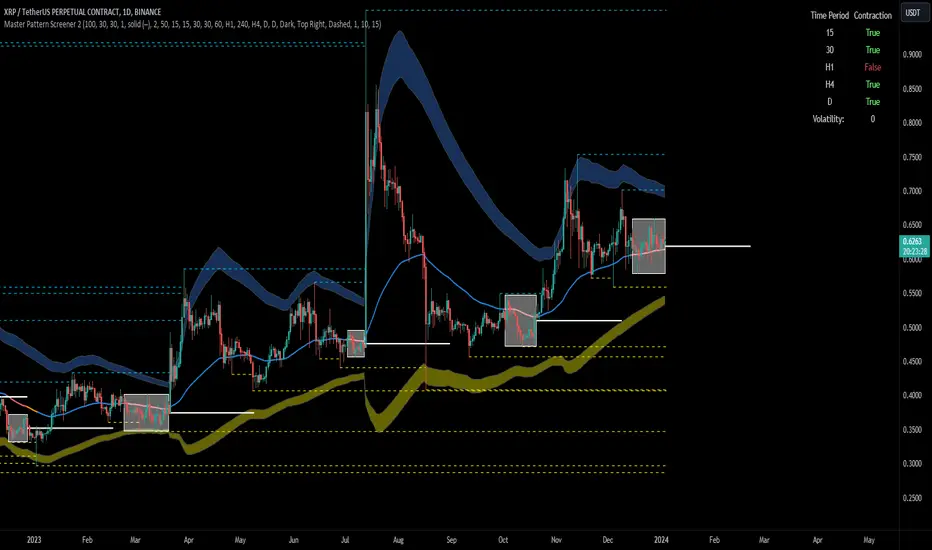
Forex Master Pattern Screener 2Overview
The Forex Master Pattern Screener 2 is based on the Master Pattern, which includes contraction, expansion, and trend phases. This indicator is designed to identify and visualize market volatility, market phases, multi-timeframe contractions, liquidity points, and pivot calculations. It provides a clear image of the market's expansion and contraction phases. It's based on an alternative form of technical analysis that reveals the psychological patterns of financial markets through three phases.
Unlike the other master pattern indicators that just use highs and lows and aren't as accurate for finding contractions, this one uses actual measures of volatility to find extremely low levels of volatility and has customizable parameters depending on what you want to do.
What is the Forex Master Pattern?
The Forex Master Pattern is a framework that revolves around understanding market cycles, comprising the three main phases: contraction, expansion, and trend.
Contraction Phase: During this phase, the market has low volatility and is consolidating within a narrow range. Institutional volume tends to be low, and it's suggested to avoid trade entries during this period.
Expansion Phase: Volatility starts to increase, and there start to be bigger moves in price. Institutional traders start accumulating positions in this phase, and they might manipulate prices to draw in retail traders, creating liquidity for their own buying or selling goals.
Trend Phase: This final phase completes the market cycle. Institutional traders begin taking profits, leading to a reversal. This triggers panic among retail traders, resulting in liquidations and stops. This generates liquidity for institutional traders to profit, leaving retail traders with overvalued positions.
Value Line:
The "value line" acts as the fair value zone or the neutral belief zone where buyers and sellers agree on fair value. It can be likened to the center of gravity and is created during contraction zones.
Applications:
Identifying these phases and understanding the value lines can help traders determine the market's general direction and make better trading decisions.
This isn't a strategy but a concept explaining market behavior, allowing traders to develop various strategies based on these principles
The contractions, which are based on volatility calculations, can help you find out when big moves will occur, known as expansions.
How traders can use this indicator
1. Identifying Market Phases:
Contraction Phase: Look for periods where the market has low volatility and is contracting, indicated by a narrow range and highlighted by the contraction box. During this phase, traders prepare for a breakout but usually avoid making new trades until a clearer trend emerges.
Expansion Phase: When the indicator signals an expansion, it suggests that the market is moving out of consolidation and may be beginning a new trend. Traders might look for entry points here, anticipating a continuation of the trend.
Trend Phase: As the market enters this phase, traders look for signs of sustained movement in one direction and consider positions that benefit from this trend.
2. Multi-Timeframe Analysis:
By looking at multiple timeframes, traders can get a broader view of the market. For instance, a contraction phase in a shorter timeframe within an expansion phase in a longer timeframe might suggest a pullback in an overall uptrend. This indicator comes with a MTF contraction screener that is customizable.
2. Fair Value Lines:
The fair value acts like a "center of gravity.". Traders could use this as a reference point for understanding market sentiment and potential reversal points. This indicator shows these values in the middle of the contraction boxes.
3. Volatility Analysis:
This indicator's volatility settings can help traders understand the market's current volatility state. High volatility indicates a more active market with larger, faster moves, while low volatility might suggest caution and tighter stop-losses or take-profits. If volatility is contracting, then an expansion is imminent. This indicator shows the volatility with percentile ranks in 0-100 values and also alerts you when volatility is contracting, aka the contraction phase.
Volatility Calculations:
This indicator uses a geometric standard deviation to measure volatility based on historical price data. This metric quantifies the variability of price changes over a specified lookback period and then computes a percentile rank within a defined sample period. This percentile calculation helps evaluate the current volatility compared to historical levels.
Based on the percentile rank, the indicator sets thresholds to determine whether the current volatility is within a range considered "contraction" or not. For example, if there are really low levels of volatility on the percentile rank, then there is currently a contraction phase. The indicator also compares the volatility value against a moving average, where values above the current moving average value signal the expansion phase.
Multi-Timeframe Analysis (MTF):
This indicator comes with a multi-timeframe table that shows contractions for 5 different timeframes, and the table is customizable.
Bands:
This indicator comes with bands that are constructed based on the statistical calculations of the standard deviation applied to the log-transformed closing prices. It is commonly assumed that the distribution of prices fits some type of right-skewed distribution. To remove most of the skewness, you can use a log transformation , which makes the distribution more symmetrical and easier to analyze, thus the use of these bands . These bands are in the 2 standard deviation range. You can use these bands to trade at extreme levels. The band parameter is based on the contraction volatility lookback, which is in the Volatility Model Settings tab.
Ways the bands could be used with the contractions:
1. Identifying Breakout trades:
Contraction Zones: These zones indicate periods of low volatility where the market is consolidating. There are usually narrow price ranges, which are considered a build-up phase before a significant price move in any direction.
Bands: When the contraction zone occurs, you might notice the bands tightening around the price on smaller lookback periods, reflecting the decreased volatility. A continuous widening of the bands could then signal the beginning of an expansion phase, indicating a potential breakout opportunity.
2. Enhancing Trade Timing:
Before the Breakout: During the contraction phase, the bands might move closer together, reflecting the lower volatility. You can monitor this phase closely and prepare for a potential expansion. The bands can provide additional confirmation; for instance, a price move toward one of the bands might show an extreme occurrence and might show what the direction of the breakout could be.
After the breakout: Once the price breaks out of the contraction zone and goes to the expansion phase, and if it coincides with the bands widening significantly, it could reinforce the strength and potential sustainability of the new trend, providing a clearer entry.
3. Price-touching bands during a contraction:
If the price repeatedly touches one of the bands during a contraction phase, it might suggest a buildup of pressure in that direction. For example, if the price is consistently touching the upper band even though the bands are narrow, it might suggest bullish pressure that could occur once the expansion phase begin.
4. Price at the band extreme levels during Expansion:
If the price is at the extreme levels of the bands once the expansion phase occurs, it might indicate unsustainable levels and a low probability of the price continuing beyond those levels. Potentially signaling that a reversal will occur. Some trades could use these extremes to place entries during the expansion phases.
Liquidity Levels:
This script comes with liquidity points, whose functionality goes towards identifying pivotal levels in price action, focusing on swing highs and swing lows in the market. These points represent areas where significant buying (for swing lows) or selling (for swing highs) activity has occurred, implying potential levels or resistance in the price movement.
These liquidity points, often identified as highs and lows, are points where market participants have shown interest in the past. These levels can act as psychological indications where traders might place orders, leading to increased trading activity when these levels are approached or breached. When used with the Forex Master Pattern phases, liquidity levels can enhance trades placed with this indicator. For instance, if the market is expanding and approaches a significant liquidity level, there might be a higher chance of a breakout or reversal, showing a possible entry or exit point.
Liquidity Levels in the Contraction Phase:
Accumulation and Distribution: During the contraction phase, liquidity levels can indicate where huge positions are likely accumulating or distributing quietly. If price is near a known liquidity level and in a contraction phase, it might suggest that a large market player is building a position in anticipation of the next move.
Breakout Points: Liquidity levels can also give clues about where price could go after the breakout from the contraction phase. A break above a liquidity level might indicate a strong move to come as the market overcomes significant selling pressure.
Liquidity Levels in Expansion Phase:
Direct Confirmation: As the expansion phase begins, breaking through liquidity levels can confirm the new trend's direction. If the price moves past these levels with huge volume, it might indicate that the market has enough momentum to continue the trend.
Target Areas: Liquidity levels can act as target areas during the expansion phase. Traders using this indicator could look to take profits if the price approaches these levels, possibly expecting a reaction from the market.
Adaptive Momentum Channel - [Volume Filter]The Adaptive Momentum Channel with Volume Filter (Adaptive MCVF) is an indicator that utilizes an adaptive RSI to adjust its sensitivity based on the market conditions. The RSI component of the indicator calculates the standard deviation and mean deviation of RSI values and uses these to calculate the adaptive RSI. The volume filter component of the indicator filters the adaptive RSI based on the volume average, allowing the indicator to identify trend changes and filter out market noise.
The indicator plots the upper and lower bands of the Adaptive MCVF, which are calculated by taking the moving average of the filtered RSI and applying an offset based on the standard deviation. A fast moving average is also plotted, which can be used to identify short-term changes in the trend.
The Adaptive MCVF also includes a divergence identification feature, which can be used to identify potential trend changes. The indicator plots regular bullish and bearish divergences, as well as hidden bullish and bearish divergences.
This is a variant of my previous MCVF indicator, this one simply allows you to take the standard deviation of the momentum and use it to make the indicator a bit more adaptive!
I made it protected to hide the standard deviation math and the auto divergence code.
You can always use this indicator by pressing "favorite";)

Volume Channel - [With Volume Filter]The indicator calculates two volume-weighted moving averages (VWMA) using different lengths, and filters them based on a moving average of volume. The filtered VWMA values are then plotted on the chart as lines, representing the fast and slow moving averages. In addition, upper and lower bands are calculated based on the slow VWMA and plotted as lines on the chart.
The fast and slow VWMA lines can be used to identify trends in the market. When the fast VWMA is above the slow VWMA, it is an indication of an uptrend, and when the fast VWMA is below the slow VWMA, it is an indication of a downtrend. The position of the VWMA lines relative to the upper and lower bands can also be used to identify potential trade signals.
When the price is near the upper band, it indicates that the market is overbought, and when the price is near the lower band, it indicates that the market is oversold. Traders can use these signals to enter or exit trades.
The indicator also includes a volume filter, which means that the VWMA values are only calculated when the volume is above a certain moving average of volume. This helps to filter out noise in the market and provide more accurate signals.
Explanation for each parameter
vwmaLength1: This is the length of the fast volume-weighted moving average (VWMA) used in the calculation. The default value is 10, and it can be adjusted by the user.
vwmaLength2: This is the length of the slow volume-weighted moving average (VWMA) used in the calculation. The default value is 25, and it can be adjusted by the user.
bandLength: This is the length of the moving average used to calculate the upper and lower bands. The default value is 34, and it is not adjustable by the user.
volumeFilterLength: This is the length of the moving average of volume used as a filter for the VWMA calculation. The default value is 5, and it can be adjusted by the user.
src: This is the input source for the VWMA calculation. The default value is close, which means the indicator is using the closing price of each bar. However, the user can select a different input source by changing this parameter.
filteredVwma1: This is the filtered VWMA calculated based on the volume filter and the fast VWMA length. It is plotted as a line on the chart and can be used to identify short-term trends.
filteredVwma2: This is the filtered VWMA calculated based on the volume filter and the slow VWMA length. It is plotted as a line on the chart and can be used to identify long-term trends.
ma: This is the moving average of the filtered slow VWMA values, which is used to calculate the upper and lower bands. It is plotted as a line on the chart.
offs: This is the offset used to calculate the upper and lower bands. It is based on the standard deviation of the filtered slow VWMA values and is multiplied by 1.6185 * 3. It is plotted as a line on the chart.
up: This is the upper band calculated as the moving average plus the offset. It is plotted as a line on the chart and can be used to identify overbought conditions.
dn: This is the lower band calculated as the moving average minus the offset. It is plotted as a line on the chart and can be used to identify oversold conditions.

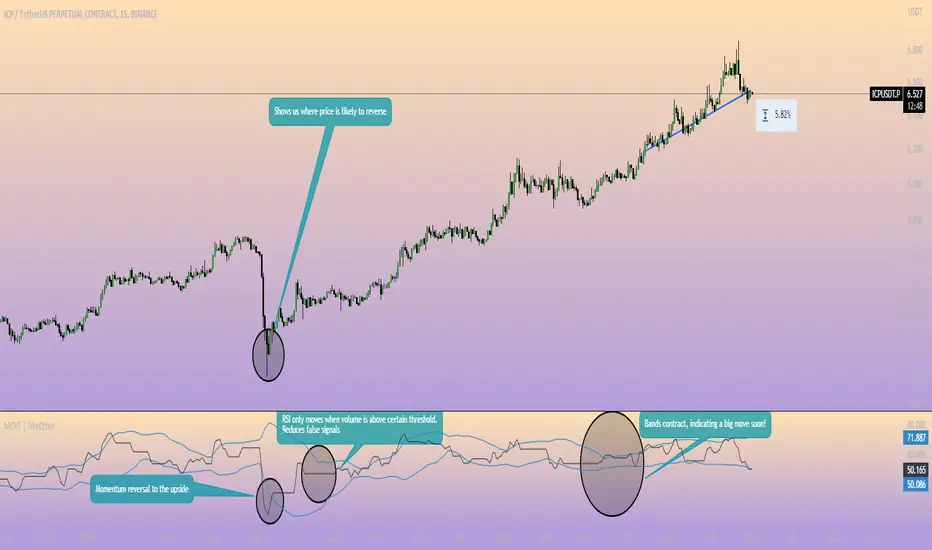
Momentum Channel - [Volume Filter]The indicator incorporates a volume filter to ensure that the RSI only moves when the volume is above the moving average of the volume.
The filtered RSI is then used to calculate the Bollinger Bands and moving averages, providing insights into the market dynamics.
It also gives you insight into the bigger timeframes so you can monitor momentum!
Volume Filter Length: Input parameter for the length of the volume filter moving average.
Overview of code:
rsiPeriod: Input parameter for the RSI period.
bandLength: Input parameter for the length of the Bollinger Bands.
lengthrsipl: Input parameter for the length of the fast moving average (MA) on the RSI.
volumeFilterLength: Input parameter for the length of the volume filter moving average.
volumeAvg: Calculates the moving average of the volume using the ta.sma() function with the specified volume filter length.
filteredRsi: Uses the ta.valuewhen() function to obtain the RSI value only when the volume is greater than or equal to the volume moving average. This creates a filtered RSI based on the volume filter.
offs: Calculates the offset value for the Bollinger Bands. It is derived by multiplying 1.6185 with the standard deviation of the filtered RSI using the ta.stdev() function.
VWMA Volatility OscillatorVWMA Volatility Oscillator
This oscillator uses Volume Weighted Moving Averages to plot the volume. When the average is on the bottom then there is a chance that volatility contractions could be happening and a expansion could happen soon. When the average can be seen "high" like peaking then this could mean that there already is a lot of volume and the expansion is already happening.
What are contractions and expansions?
Contractions are periods in the markets where the price range gets tighter signifying decreasing volatility.
After contractions, Expansions will occur which is a strong movement upwards or downwards and the range increases, which shows an increase in volatility.
How to use this indicator
The indicator has 3 VWMA lines. The indicator also has a bottom range by getting the lowest points of each of the VWMA lines. If the VWMA lines are at the bottom ranges this can signify low volatility and a contraction. This can mean that at any moment a expansion will happen and a possible pump or dump.

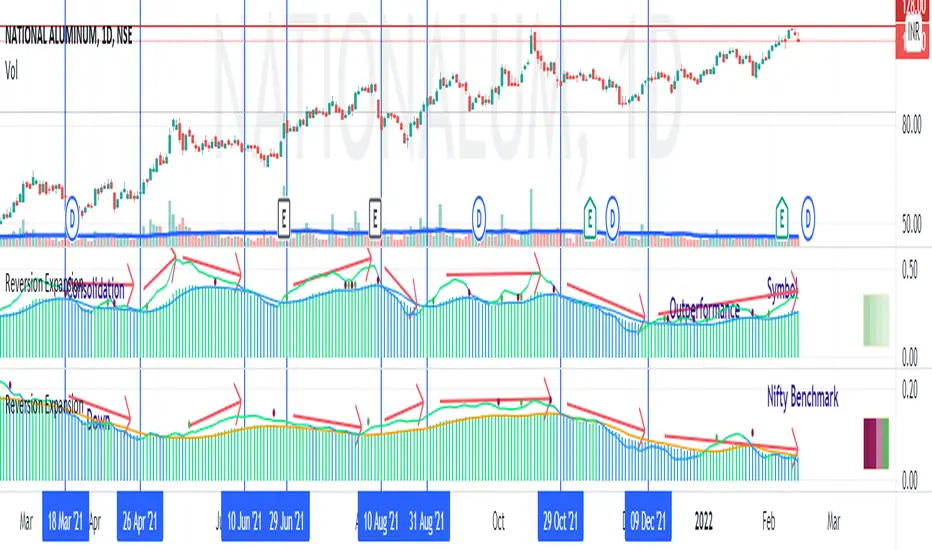
Price - Mean Reversion ExpansionA simple indicator, to plot the quantitatively the reversion and expansion of price from a set of means.
A green bar plots prices above the set of means. A bar plots prices below the set of means. A blue bar plots price entangled in the means. The height of the bars denotes the far-ness from the set of means.
A blue envelope over the bars is the average of this reversion/expansion. A "crossover" of any bar (red/green) over this envelope is indicated by a "green dot" a "crossunder" of any bar (red/green) under this envelope is indicated by a "red dot".
The small trend strength table (when enabled) on the right side below show in a easy manner the data presented in the " Mean Angles " indicator. Refer to description there for more details.
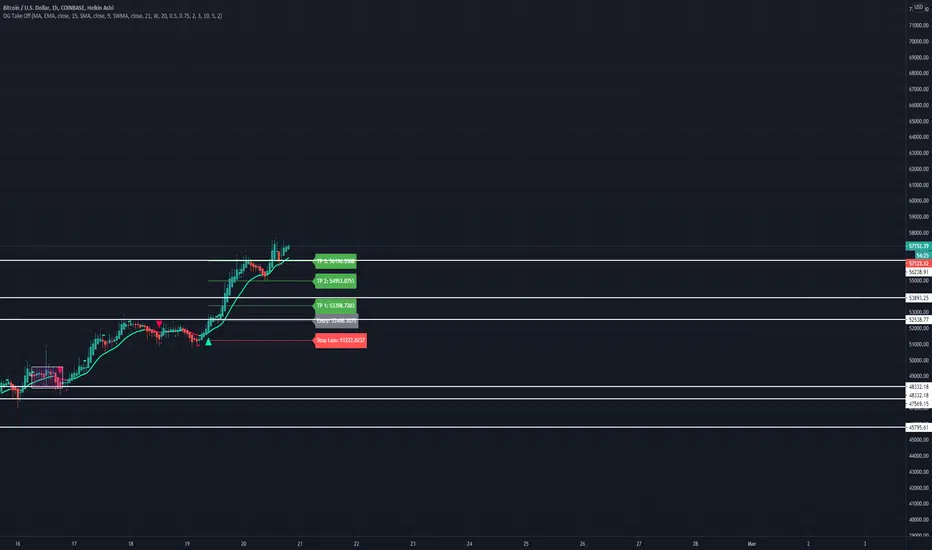
OG Take OffThis indicator is put in place to help you identify the 3 market phases.
Consolidation can be indicated by either dots or color coded candlesticks . You can use both. Consolidation zones are represented by the dotted lines.
A green arrow indicates a buy signal. A red arrow indicates a sell signal.
Theme allows you to change the color of the background to whatever you like.
To change the color of the moving average, you must uncheck "Modern Theme Trend MA Color" under 'Style'.
When price is above 50 moving average on the higher timeframe and the color of the candle is green on the higher time frame, you are in a long market. When price is below the 50 moving average and the color of the candle is red on the higher timeframe, you are in a short market.
Trend puts a trend cloud on the chart. When green and above the 50 moving average, you can assume the market is long. Look for buys on the smaller time frame. When red and below the 50 moving average, you can assume the market is short on the smaller time frame. You can also draw an average price line through the middle of the consolidation box to tell you the directional bias.
The moving average is set to 50 by default but can be changed. You can also add 2 more moving averages to the chart. (Options: SMA , EMA , SWMA , WMA , VWMA , HMA )
Consolidation on the inputs page allows you to see when the market is consolidating with dots and color change of the candlesticks . Opacity of the dots can be changed under 'Style' (Upper Band Dots/Lower Band Dots) You can assume when the dots are below the candlestick , price is buying; when the dots ae above the candlesticks , price is selling.
't' and 'b' represent tops and bottoms and can help you recognize finding the top and bottom on the daily when doing top down analysis. It can also help you recognize double tops, double bottoms, triple tops, etc.
This indicator is best used on the 1 hr or 4 hr time frame. If you zoom out on the chart, you can notice when the market is consolidating, when the market is in expansion phase, and when the market is trending. When the market is in expansion phase, you may see a lot of 'swing low/swing high' action. When the market is trending, it takes off and doesn't look back.
If you enter on the 5 min and ride the 1 hr trend, that is a great idea. If you enter on the 15 min and ride the 4 hr trend, that is an even better idea.
The TP levels can be changed according to your risk reward ratio.
Volume Contraction and ExpansionA simple indicator that shows volume expansion and contraction of a trend through colorization of the candles. It indicates the underlying volume support of a trend. This indicator might come in handy for any Elliott Wave analyst trying to incorporate volume into his analysis.

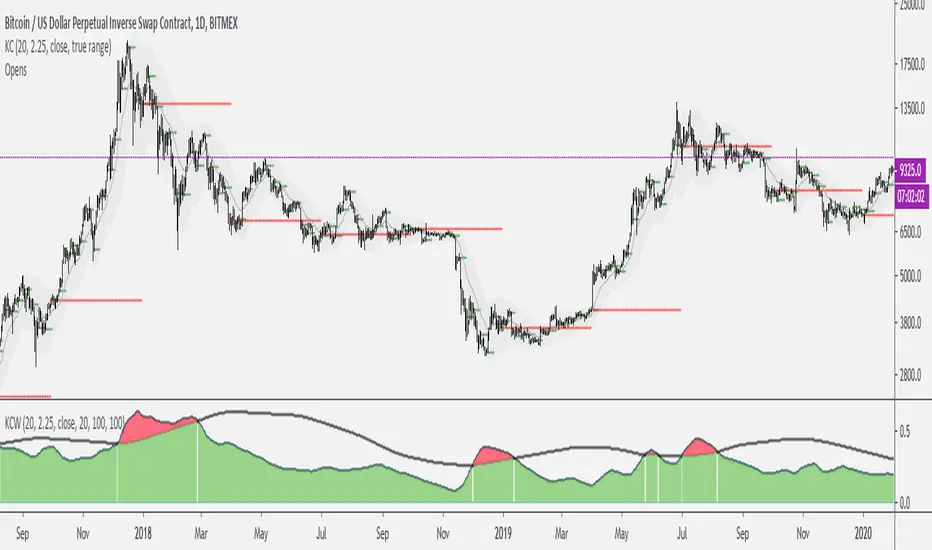
Keltner Channels WidthSimilar to bollinger bands width, but for keltner channels, designed to recognize when a move is exhausted and contraction is to be expected.
Would use it as a filter to stay out of any trades if the indicator peaks (red color).