COG SSMACD COL combo with ADX Filter [orion35]This indicator consists of a combination of indicators produced by the most valuable developers in the market.
These are: Center of Gravity (COG) and Super Smoothed MACD (SSMACD) shared by @KivancOzbilgic and Center of Linearity (COL) shared by @alexgrover
I produced this indicator by writing new conditions that compare the signals given by these indicators with each other. I re-coded the change in the thickness of the cloud from the COL indicator as the middle horizontal line with varying color intensity and type. I have provided options for switching between these three indicators when desired.
Note: The strongest signals in the indicator are the blue colored triangles. Moderately strong ones are yellow signals. White colored signals are considered as the weakest signals.
Some minor fixes:
Some confusing words were thrown in the alarms section,
Added new alarm codes for any Triple or Double signals.
Major changes have been made with this update.
It is very important to know the direction and strength of the trend in financial markets. Therefore, ADX (Average Directional movement index) was developed by J. Welles Wilder in 1978 as an indicator of the trend strength in the prices of a financial instrument.
Especially in sideways markets, most indicators produce many false signals. However, these signals can be filtered with the ADX indicator. The price is considered sideways when the ADX is less than 20 as the threshold value.
With this update,
ADX filter can be activated when desired, and signals can be filtered flexibly according to the "threshold" value determined by the user. When the ADX filter is active, it will also reflect on the alarm conditions. Therefore, if an alarm is to be set according to the ADX filter, the filter must be activated first.
The colors of the lines and signals have been made changeable.
The visual level and thickness of the COL line has been made adjustable.
With this update, signals can be filtered according to the MavilimW indicator developed by @KivancOzbilgic
Filter Methods:
Normal: If the price is below the BlueW line, "bull" signals are filtered out, and above "bear" signals are filtered out.
Reverse : Applies the opposite of the normal method.
Fixed some visual bugs in switching between indicators.
Crossover

Artharjan - RSI and RSI-Moving Avg Crossover SignalsHi,
I have created "Artharjan - Index Heavy Weight Components RSI and RSI-Moving Avg Crossover Bullish/Bearish/Neutral Signal" (Short Name - ARSICROSSOVER) indicator for Traders whereby they can see the RSI and RSI Moving Average Values for Indices and Index heavyweight Components at the same time in a Dashboard.
The analysis is based on 2 different timeframes. Basically when Higher timeframe RSI is Bullish and Lower timeframe is Bearish then you enter the LONG trade when Lower Timeframe RSI shows "Bullish Reversal Signal" &
when Higher timeframe RSI is Bearish and Lower timeframe is Bullish then you enter the SHORT trade when Lower Timeframe RSI shows "Bearish Reversal Signal"
The two timeframes which I have selected by Default are Weekly (Higher timeframe) and 30 min Lower (Trade Entry) Timeframe
Also I have used to source to calculate the RSI as 5 period WMA of hlc3, if you want use raw RSI to generate crossover signals then change the source to "close" and input soothing to '1' instead of '5'
The system generates very accurate Buy and Sell Signals and when the script is range bound in its respective timeframe it shows Neutral signal
The overbought and oversold levels for Higher and Lower timeframes are set to be 60/40 and 70/30 respectively, however Traders may change these levels as per their preferences.
For intraday trades I would recommend using Higher time frame as "Daily" and Lower (Trade Entry) Timeframe as "15 min"
For Swing trades I would recommend using Higher time frame as "Weekly" and Lower (Trade Entry) Timeframe as "75 min"
For Positional trades I would recommend using Higher time frame as "Monthly" and Lower (Trade Entry) Timeframe as "Daily"
Also you can select maximum 10 Scripts at any given point in time.
My recommendation would be to use Sector Index as Script 1 and then Heavy weight components of that Sector in Script 2 to 10
This will help you to identify which Stock is responsible to pull index Up or Down and then you may decide to take either a Long Trade or Short Trade accordingly.
The Background Color and Bullish/Bearish/Neutral stages are decided based on following logic
1] If Higher timeframe RSI > Overbought Level - Stock is in a Bull Run
2] If Higher timeframe RSI > If Higher timeframe EMA of RSI = Positively Bullish
3] If Higher timeframe RSI < Oversold Level - Stock is in a Bear Run
4] If Higher timeframe RSI < If Higher timeframe EMA of RSI = Positively Bearish
5] Bulls will be said to have control if Condition 1 & 2 are true
6] Bears will be said to have control if Condition 3 & 4 are true
7] The Stock/Index will be said to be in a Neutral zone if its RSI is less than Overbought Level but greater than Oversold Level
The same rules are applicable for a Lower (Trade Entry) Timeframe
Hope you guys like this indicator and are able to make decent money by using it.
Regards
Rahul Desai
@Artharjan

Moving Averages With Cross AlertsA simple way to add up to 5 moving averages with optional crossover/crossunder alerts.
Available options for Moving Average Type are:
SMA
EMA (default)
HMA
RMA
WMA
VWMA
VWAP
ALMA
By default, 5 moving averages are enabled and set to the following:
MA1 set to 5
MA2 set to 13
MA3 set to 50
MA4 set to 200
MA5 set to 800
Each moving average has the following options:
Enable/Disable
Source (default is close)
Length
Color
jma + dwma crossoverThis crossover system was originally conceptualized by Jurik Research and made public to the world on their website .
The indicator consists of the faster Jurik Moving Average (JMA) and the slower Double Weighted Moving Average (DWMA). A long signal is shown when the JMA line crosses above the DWMA line (indicating a possible reversal in trend). A short signal is shown when the JMA line crosses below the DWMA line. Take profit signals are shown when the JMA line reverses directions. Alerts for signals are included in this indicator.
The default settings are not optimized for any timeframe. Both JMA and DWMA lines are defaulted to hidden.
Credit to @everget for the re-creation of the Jurik Moving Average in pinecsript.

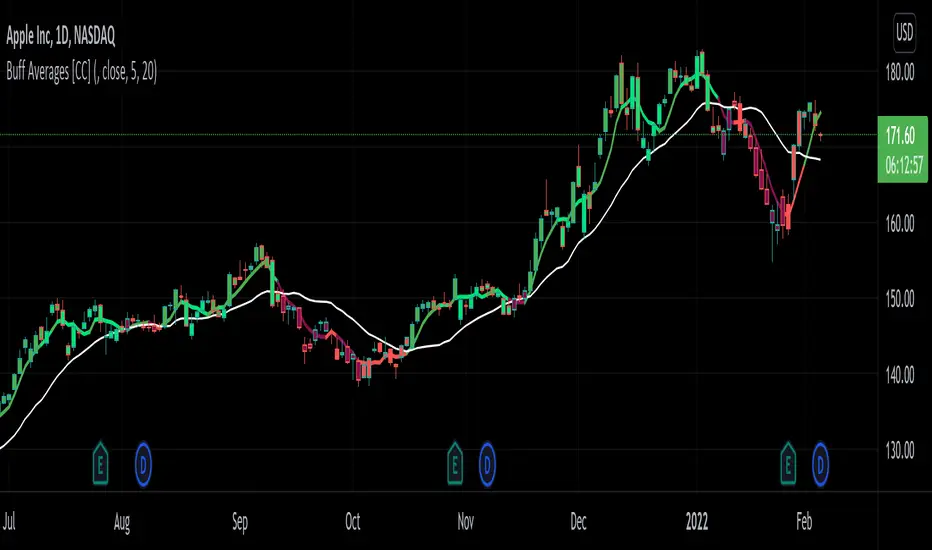
Buff Averages [CC]The Buff Averages were created by Buff Dormeier (Stocks and Commodities Feb 2001) and this is another hidden gem that is a combo of a volume weighted indicator and a moving average crossover system. It uses a special method to calculate the weighting based on volume. The colored line (fast buff) will follow the price closely and you use the other line to act as a trend confirmation. I have included strong buy and sell signals in addition to normal ones so strong signals are darker in color and normal signals are lighter in color. Buy when the line turns green and sell when it turns red.
Let me know if there are any other indicators or scripts you would like to see me publish!
Ex's DMI DivergenceThis indicator I am posting open for everyone to see and use.
This is a modified DMI indicator, It has a DMI+ and DMI- and a 3rd line that is the average divergance/convergance of the two.
This indicator is used to recognize periods of consolidation, directional strength and retracements/reversal
There are some key things to watch for:
-When the Div/Conv line is yellow it means that the DMI+/- average distance is moving closer together(converging)
-When the Div/Conv line is aqua it means that the DMI+/- average distance is moving further apart(diverging)
-One DMI must be below the top threshold and other DMI must be below at least the Top threshold(or bottom if you prefer) to be considered valid
Signs of condolidation/possible reversal/weak strength:
-When the DMI+/- are crossing at any location stay mindful of entries
-If both DMI's are above the threshold there is no clear direction
-When the DMI Div/Conv is yellow it means trend is slowing down and aqua means it is picking up

[Rygel] MACD 4C with divergences, crossovers and alertsThis indicator is a reliable, exhaustive, instant, simple divergence detector for the MACD 4C oscillator.
I've struggled for months to find a MACD divergence indicator I can rely on, I've tinkered with the ones I found and never was satisfied by the final result. For all of them important divergences were not shown, for some divergences was shown too late, for others divergence lines was not drawn, some even shown some strange exotic divergences... I played will all the parameters and something was always wrong or missing at the end.
It was even worse for the MACD 4C indicator, the 4-color MACD, which I prefer to use.
So I finally decided to write my own divergence algorithm and to create my own indicator. After a few attempts, here's the result.
This MACD indicator is using the same divergence detection algorithm I wrote for my RSI indicator. You'll find on its description page a comparison of my divergence algorithm with other ones to see how it differs.
When I built this indicator, my objectives were to create one that is:
Reliable. I didn't want to have to double-check an indicator to make sure it's doing what I expect it to do. I want to be able to look at it for one second and know I can rely on it.
Exhaustive. I didn't want to have to rely on multiple indicators to be sure I'm not missing a divergence.
Instant. I wanted the divergences to be shown as soon as soon as they form and not after a pivot is confirmed. For some indicator, when the divergence is displayed, it's already too late to act on it.
Simple. I wanted my indicator to be clean, readable and not visually aggressive. The main objective of this indicator is to show divergences and I didn't want to visually overload it with unrequired information.
I wanted my indicator to be a simple as possible, nonetheless you'll find a few parameters to tinker with. Many of them will need no explanation but here's the list.
Show signal line: disabled by default. Show the MACD signal line.
Color signal line: disabled by default. Show the signal line as green when it goes up and read when it goes down.
Show signal crossovers: enabled by default. Show a green dot when MACD crosses up its signal line and a red dot when it crosses down.
Show zero line: enabled by default. Show a line at the 0 value.
Show zero crossovers: disabled by default. Show a green triangle when MACD crosses up the 0 line and a red triangle when it crosses down.
Show regular divergences: enabled by default.
Show hidden divergences: disabled by default for readability. I try to keep the indicator as clean as possible by default.
Bullish regular divergence color : no explanation needed I suppose.
Bullish hidden divergence color : same.
Bearish regular divergence color : ditto.
Bearish hidden divergence color : uhh.
Show overbought and oversell backgrounds : when RSI is oversold or oversell, the background color changes to red or green. The indicator uses two levels of oversold/overbought. When the RSI is strongly oversold/overbought the background color gets brighter. You can configure these levels in the advanced parameters.
Advanced parameters:
MACD fast moving average length: 12 by default.
MACD slow moving average length: 26 by default.
MACD signal moving average length: 9 by default.
Show divergences before pivot confirmation : enabled by default. Divergences will appear as soon as possible, before the pivot is confirmed by another candlestick. Unconfirmed divergences will appear as dashed lines then disappear if not confirmed or turn to solid lines if confirmed. This may create false positives with alerts as the divergence may disappear.
Minimum bars to check: 5 by default. As this indicator detects absolutely all the divergences, some may be insignificant and it may become unreadable without some filtering. If you want to see absolutely all the divergences, you may lower this value. Please note TradingView limits to 50 how many lines are displayed at the same time on an indicator. So when you display more divergences, some in the past disappear. It's not usually an issue but if you scroll back in time, divergences will stop to show at one point in the past.
Maximum bars to check: 75 by default. Divergences may go far in the past, this parameters limit how old a divergence may be. You can higher it to show more divergences.
Show pivots: disabled by default. Show the pivot points used for divergence detections.
This indicator offers the following alerts:
Any divergence
Bearish divergence
Bullish divergence
Regular bearish divergence
Regular bullish divergence
Hidden bearish divergence
Hidden bullish divergence
MACD becoming positive
MACD becoming negative
MACD crossing up signal line
MACD crossing down signal line
Please note TradingView limits for performance reason to 50 the number of lines you can display on an indicator at the same time. So when you scroll back in time, at one point divergences will stop to show. If you want to see divergences far in the past, you may need to use the replay feature or to configure stronger filtering settings.
I hope you'll enjoy this indicator as much as I do! :)
Feel free to comment if you experience a bug or if an important feature is missing for you. (Please note the core of this indicator is divergence detection, I want to keep it simple so I will probably not add many unrelated features to it.)

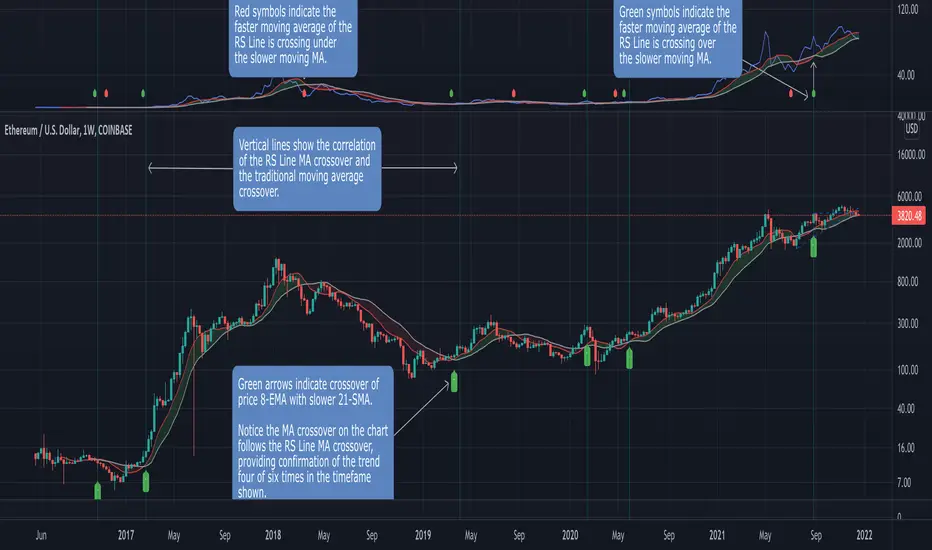
Relative Strength MA Crossover [LevelUp]A popular technical analysis strategy is the moving average crossover. This indicator combines a crossover with the Relative Strength Line, created by William O’Neil. The RS Line is a tool used to compare the price action of a particular stock to that of an index, with the S&P 500 being the index preferred by O'Neil.
When one moving average crosses above or below another, that may be a signal of a trend change. For example, when a shorter-term moving average (aka faster moving average) of price moves up and through a longer-term moving average (aka slower moving average), it is likely the price is trending up, this is referred to as a crossover. The opposite can also be a potential signal of a change in the trend. When a shorter-term moving average crosses under a longer-term moving average, the price may be heading down. We refer to this as a negative crossover or crossunder.
This indicator allows configuration of up to two moving averages for the RS Line. Using two moving averages you can quickly identify the direction of the trend and also pinpoint where the faster moving average crosses over or under the slower moving average.
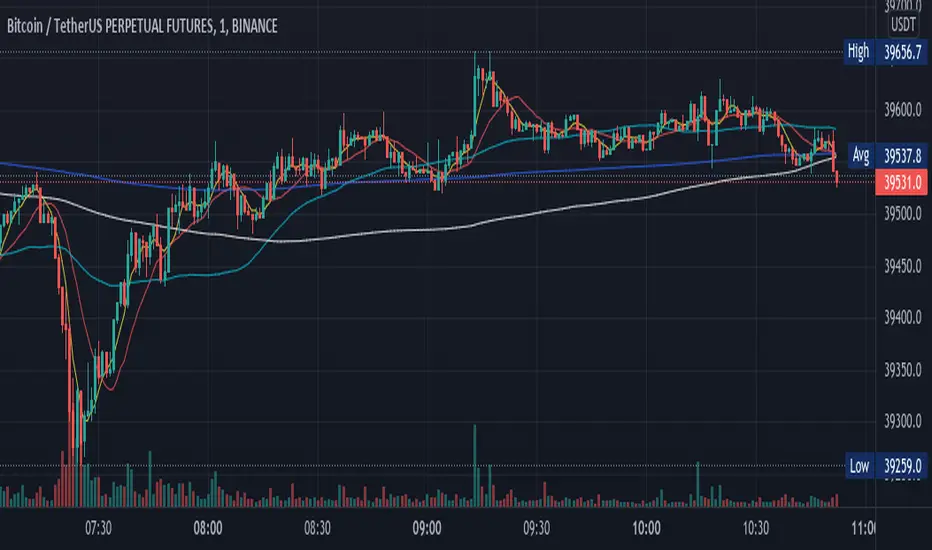
While beta testing this indicator, we performed a study using Bitcoin. In 2021 we’ve seen an increasing correlation of BTC and the S&P 500. This is most likely due to the fact that both crypto and stocks are riskier than other financial assets such as bonds and commodities. When the market is risk-off, both the S&P 500 and Bitcoin tend to sell off together.
For the BTC test case we used two moving averages of the RS Line, 8-EMA and 50-SMA. In the chart that follows you can see a breakdown of how this played out over the last ~2 years. A positive divergence is indicated by the 8-EMA of RS crossing above the 50-SMA, and vice versa for a negative divergence.
Here's another example using TSLA:
Features
■ Configure up to two moving averages for each timeframe.
■ Optional symbols indicate moving average crossovers.
■ Configure custom alerts on crossovers, for any timeframe.
■ Optional moving average cloud makes it easy to identify if slower moving average is above/below faster moving average.
■ Configurable index, defaulting to S&P 500 (SPX).
Acknowledgement
This project is a collaborative effort with @blakedavis17 a Crypto-Equity Analyst. Based on a discussion with Blake about a moving average crossover using the RS Line, we created a simple indicator to explore the concept further. We were very encouraged with the results of backtesting and decided to publish the indicator as we believe it may be a helpful tool for both equity and crypto traders.
Moving Average Multitool CrossoverAs per request, this is a moving average crossover version of my original moving average multitool script .
It allows you to easily access and switch between different types of moving averages, without having to continuously add and remove different moving averages from your chart. This should make backtesting moving average crossovers much, much more easier. It also has the option to show buy and sell signals for the crossovers of the chosen moving averages.
It contains the following moving averages:
Exponential Moving Average (EMA)
Simple Moving Average (SMA)
Weighted Moving Average (WMA)
Double Exponential Moving Average (DEMA)
Triple Exponential Moving Average (TEMA)
Triangular Moving Average (TMA)
Volume-Weighted Moving Average (VWMA)
Smoothed Moving Average (SMMA)
Hull Moving Average (HMA)
Least Squares Moving Average (LSMA)
Kijun-Sen line from the Ichimoku Kinko-Hyo system (Kijun)
McGinley Dynamic (MD)
Rolling Moving Average (RMA)
Jurik Moving Average (JMA)
Arnaud Legoux Moving Average (ALMA)
Vector Autoregression Moving Average (VAR)
Welles Wilder Moving Average (WWMA)
Sine Weighted Moving Average (SWMA)
Leo Moving Average (LMA)
Variable Index Dynamic Average (VIDYA)
Fractal Adaptive Moving Average (FRAMA)
Variable Moving Average (VAR)
Geometric Mean Moving Average (GMMA)
Corrective Moving Average (CMA)
Moving Median (MM)
Quick Moving Average (QMA)
Kaufman's Adaptive Moving Average (KAMA)
Volatility-Adjusted Moving Average (VAMA)
Modular Filter (MF)

RM Moving averageIt is the first version of the crossover function which returns an arrow with the text "LONG"

Two Moving Average CrossChoose two completely different moving averages and determine crossover points. Feel free to copy and paste the code into any strategy using MA crosses in order to optimize backtesting.

Moving_average-10/5This moving average contain three moving averages , where two moving average corssover work and 1 moving average corssover on candle
when candle cross above or below moving average 10 or 5 its gives signals buy or sell ....
not work in ranging market .
backtest first before use in real trading for study how its work on chart.
thank you

Baekdoo compressed multi EMA box and its crossover indicatorHi forks,
I'm trader Baekdoosan who trading Equity from South Korea. This Baekdoo compressed multi EMA box and its crossover indicator tells us good trading time for swing trading.
Here is the idea. As you can see formula, I put ema of 5 days to 100 days.
and draw box when all disparity of the EMAs are less than 5%
I put those value in input variable as 105 (100 means same as max/min disparity ratio, 105 means max is 5% greater than min). This can be used 110 (10% of box) based on your needs.
Once box are drew, I put indicator when it crossover the box with 5 times larger than 60 days' highest volume. Then I put triangle indicator. This will be good trading point for short-mid term trading. you can check historical chart to evaluate this.
Hope this will help your trading on equity as well as crypto. I didn't try it on futures . Best of luck all of you. Gazua~!

MACD AdvancedHello traders!
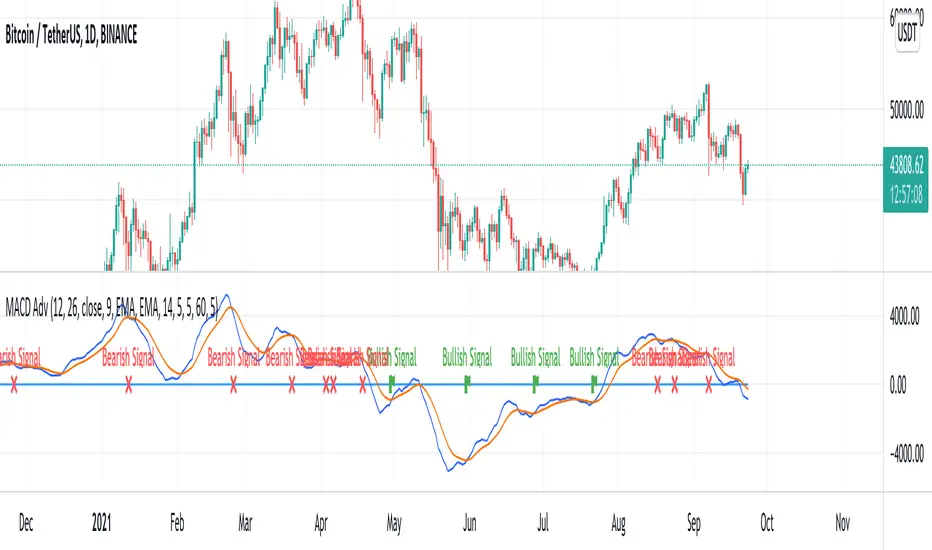
As you know, MACD is one of the oldest and the most popular indicators for trading. It seems to be a «Hello world indicator» of most technical analysis beginners. It’s easy to interpret and rather useful for many styles of trading. There are many arguments about its accuracy but in my opinion, this indicator can show very good results. However, you should squeeze every drop of its opportunities and we'll help you with it. We invented this script to make the lives of both professionals and freshmen easier.
Our new indicator uses all the opportunities that MACD gives. It takes into consideration divergencies, crossovers, the MACD, and signal line location. It seems to be rather difficult to take into consideration all MACD signals when you don’t use algorithmic trading, but it’ll be trivial using our script. We have integrated some innovations that’ll make traders’ staff easier. As you know, the crossover is considered to be a false signal in conjunction with hidden divergence which predicts another movement. Thus, we catch all types of divergencies and if it’s hidden of another «value» we skip it. However, if there's a crossover with bullish divergence or cross under with bearish, the signal seems to be strong and accurate. In this case, divergence is playing for us and makes the point of entrance more trustable. Our script takes into consideration this case and the innovative divergence chaser doesn’t give any mistakes. Moreover, if crossover takes place above zero line and crosses under bellow it, these signals are considered to be false too. It’s a trivial task comparing with the previous, thus it’s extremely simple for our script. We called it MACD Advanced cause it uses all the power of MACD with the power of invasive divergence chasers. The usage of it is trivial. Just add it to the chart, tune the parameters like MACD and tune the divergence chaser and get very accurate signals. We decided not to draw the bars to make signals more visible. It seems to be very nice!
I hope guys you'll enjoy it and it'll become a part of your trading staff.
TMA crossovertma crossover is an indicator created by 2 tma lines with default lenth of 30 and 5 candle shifting.
both tma lines have 15 candle extrapolations,
on bullish market the green line is located above the red line while on downtrend the green line moves below the red.
source is open and free for all

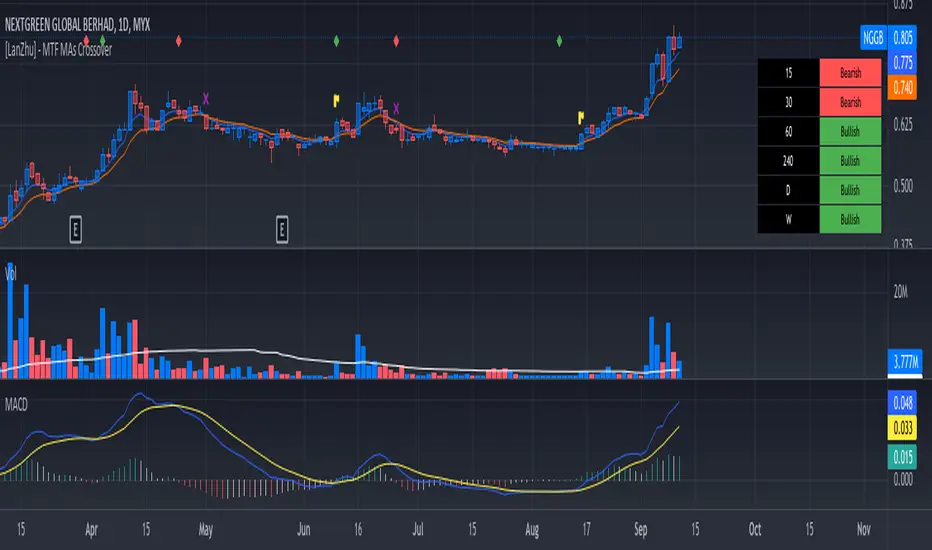
[LanZhu] - MTF MAs CrossoverCredited to ChrisMoody's script ==> _CM_Ultimate_MA_MTF_V4 :)
I have modified a bit his indicator to include more MTF fast MA and slow MA crossover. I have added table to show MTF bullish and bearish status. Fast MA above Slow MA is considered Bullish and vice versa
Kindly refer to chart to see explanation of this indicator. Hopefully you guys will enjoy :)
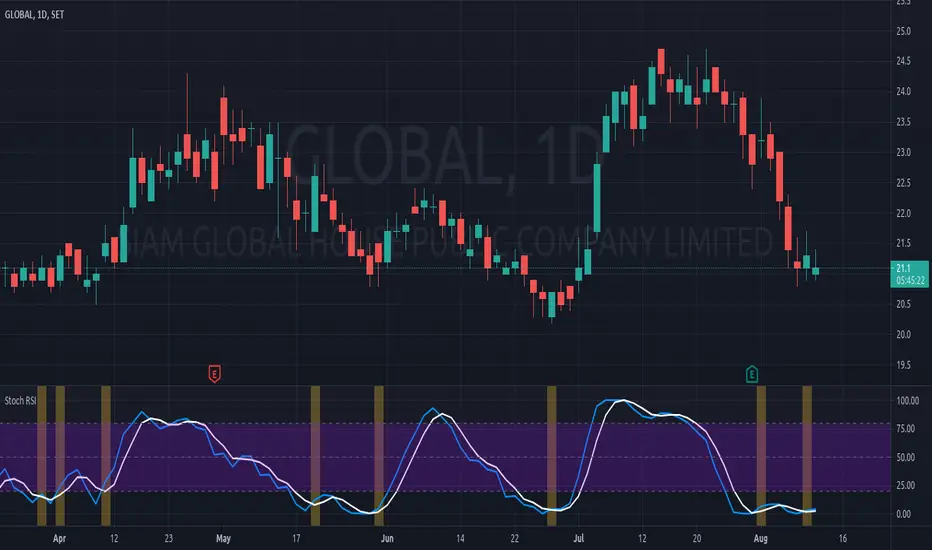
JCipher Stochastic RSI Crossover AlertsCustom indicator to plot the stochastic RSI and print a highlighting bar to indicate when the fast signal curve crosses the slower one from underneath (crossover), to indicate a bullish trend change.
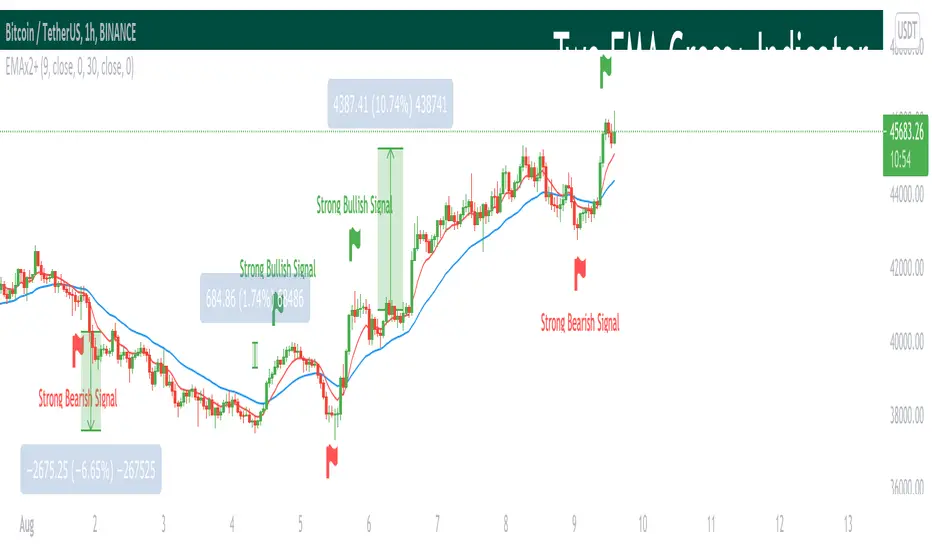
Two EMA Cross+ IndicatorHello traders!
Today we gonna demonstrate out heuristic of classical EMA Indicator. We decided to simplify your trading staff and add some meta data. So, let’s look at it from the very beginning and initially speak about what EMA is and then I’ll tell you why our indicator is extremely convenient and useful.
So, what is EMA? An exponential moving average ( EMA ) is a type of moving average (MA) that places a greater weight and significance on the most recent data points. The exponential moving average is also referred to as the exponentially weighted moving average . An exponentially weighted moving average reacts more significantly to recent price changes than a simple moving average ( SMA ), which applies an equal weight to all observations in the period.
Key takeaways:
-The EMA is a moving average that places a greater weight and significance on the most recent data points.
-Like all moving averages, this technical indicator is used to produce buy and sell signals based on crossovers and divergences from the historical average.
As you know, EMA Cross is one of basic and most popular Entry Indicators. It’s kinda easy to understand and even easier to use. This indicator consists of two EMAs - fast (red line) and slow (blue line). Fast EMA is EMA of less length that the fast EMA (default parameter is 9). Thus, it reacts the price change more actively than the slow. We can say that it takes into consideration the most actual price movements. Speaking about slow EMA (default parameter is 30) it’s more inert and it’s more difficult to change its action vastly. We can say that the EMA «looks» at the historical data more accurate, but doesn’t forget about actual price movements.
But how it works? Trivial. When the fast EMA crosses the slow bellow, it provides bearish signal, whereas when it crosses it above, it’s bullish signal. Even more, we added some «confirmation» factor. As you know, when the price is above the slow EMA, the slow EMA plays the role of support line for price and means that the price is in uptrend. Thus, when we see the cross above and it takes place under the price, we called it «strong Bullish Signal». When the price is bellow the slow EMA, slow EMA is resistance. Thus, when we see the cross bellow and it’s under the slow EMA, we called it «strong Bearish Signal».
To make your trading process easier, we plotted the places of crosses on the chart and added the descriptions of the crosses. The flags mean the place of cross. The default parameters have nice backtest on 1H chart. However, you can also change them depending on your goals and the time period. The places of cross looks like flags (red flag is «bearish» cross, green - «bullish»). As you can see, it’s really convenient.
I hope you’ll enjoy our heuristic of classical EMA Cross. We are sure that the meta data that we are taking into consideration makes the signals more accurate and the deals more profitable. The SkyRock Team with support of Trading View try to make your trading process more successful and profitable. Every day we works in conjunction to boost both your skills and trading balance. We hope, it’s really useful for you, dear traders!
LSMA CrossoverThis is a simple script designed to help filter out bad trades. LSMA is a trend king and by using the 21,200 and 1000 length lines traders can get a clear view of where price action is travelling. This indicator is the perfect companion to the LSMA Wave Rider indicator. Once a pullback is discovered (price action crosses under blue or white line) Traders can use LSMA Wave Rider to locate perfect entry point.
Least Squares Moving Average follows these rules:
When price crosses over it signals a bull trend.
When price crosses under it signals bear trend.
When price stays close or on the line sideways action is to be expected.
The direction of the line shows the direction of the trend.
Here is an example of finding good trades. Price action pulls below white or blue line.
Another example of what a pullback looks like.
This example shows how to find trend using crossovers.
Another example how trend can be found but by using line direction.
LSMA Wave Rider can be found here:
Stochastic RSI w/ Crossover Alerts (by WJ)NOTE:
// STOCH RSI CODE TAKEN FROM DEFAULT INDICATOR
// I HAVE ONLY MADE SOME ADJUSTMENTS FOR VISUAL AID
// I MADE THIS FOR MY OWN USE BUT HAVE DECIDED TO PUBLISH AND SHARE IN CASE ANYBODY WANTS TO USE IT
This is the normal default built-in Stochastic RSI indicator which I have added some stuff for visual aid:
Added middle line (50)
Stoch RSI background turns green when K line crosses D line UPWARDS, K line is below the 50 level, and price is above 200 EMA
Stoch RSI background turns red when K line crosses D line DOWNWARDS, K line is above the 50 level, and price is below 200 EMA
Alert notification on the crossover candle with background colour change conditions met
MultiAlert LITEAllows one to set 5 price level alerts on one symbol (1 Stop Loss 4 Targets)
Alerts work by prices crosses under the stop loss or over the targets, enabling short reverses this.
Unlike regular MultiAlert, this actually draws a true horizontal price at your price.
This is a lighter version of MultiAlert, supporting only one symbol. Your price levels will appear on all charts unless you hide the indicator.
Make the alert with targets and stop loss set, every time you make a change you MUST REMAKE THE ALERT.
Please comment any problems .

Moving Average Crossover with Shading Signals This script uses 3 moving averages (2 simple moving averages and 1 exponential moving average ) to signal long and short opportunities based on moving average crossovers.
A long SMA (Signal SMA2) is used to determine longer term trend. When the EMA crosses above the Slow SMA1 and price is above the Signal SMA2. The space between the moving averages will shade green and the Signal SMA should also be green.
A sell signal occurs when the EMA crosses below the Slow SMA1 and price is below the Signal SMA2. The space between the moving averages will turn red and the Signal SMA should also be red.
A retracement, consolidation, or reversal may be occurring if the shaded color is yellow.
Use the identifying shapes to learn when to open or close positions.

Roc & Atr
Roc & Atr Orders
My indicator, where I compare the 20 bar change percentage with the 14 bar atr band, I hope it will be useful to everyone. the green zones can be interpreted as BUY and the red zone as SELL zone. In graphs with high motion and low atr, the channel narrowing can be interpreted as BUY and the channel opening as SELL.
No indicator shows you the right way ... The best way is your own thoughts
