Криптовалюта
PpSignal Multi-Day VWAPThank to @mortdiggiddy
original script:
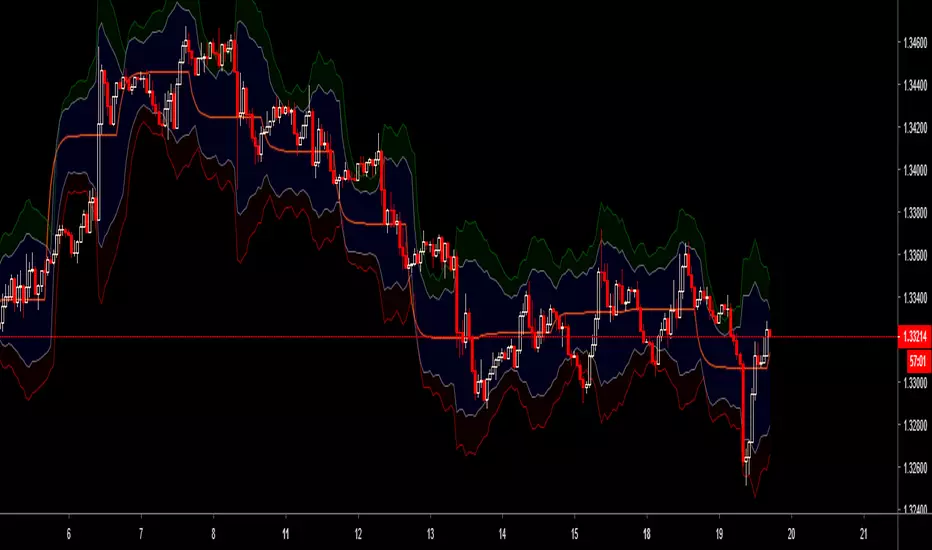
Chart the multi-day Volume Weighted Average Price ( VWAP ). Normally, the VWAP is tracked for the current day, from the first bar of the day (regular or extended session). The VWAP shows the current value of:
-> sum(hlc3 * volume , barsForDay) / sum( volume , barsForDay),
-> where 'barsForDay' is the total number bars that have elapsed during the day for the chart interval.
The multi-day version tracks the VWAP for N days back, by averaging the previous N - 1 day bars VWAP and the current VWAP for the current bar (chart interval).
This is very different that simply using a volume weighted moving average , since the closing VWAP values are used for the historical day bars. The results are interesting for intraday trades... especially for values of 1, 2, 3, 4, 5 ....to 21 days.

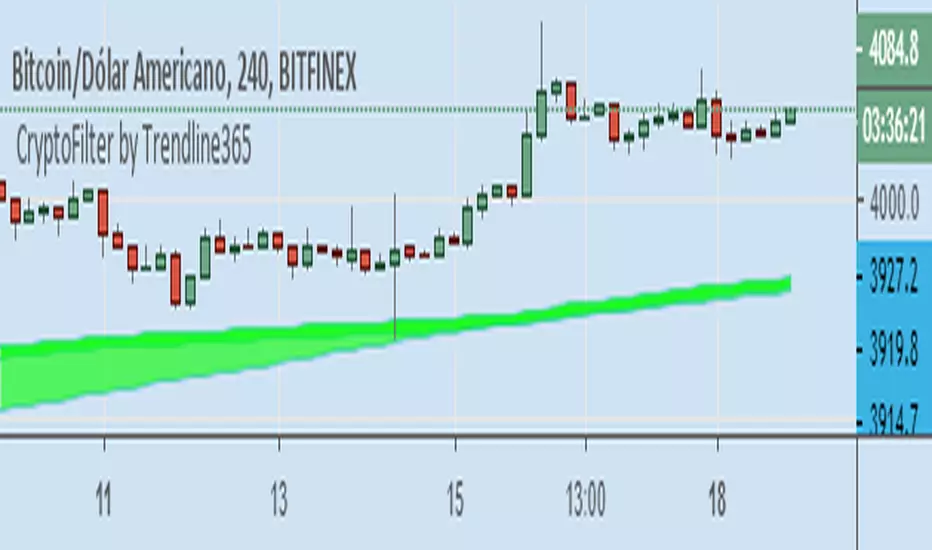
Cryptofilter by Trendline365Cryptofilter: Indicator filter trend for Crypto-Market.
With this indicator it is possible to read the trend of the graphical time,
so that the user can compare with other graph times and check if the market is aligned or not.
Thus it is possible to define if the market is aligned in several times of reading, following the same direction, mainly the sequential times, or 1/5 / 15min and 5/15/60 min.
Cryptofilter is not recommended for use as a point of entry or exit indicator.
SMA Serial for Crypto Day Trade Fixed Length SSCDTENCrypto market is different from other financial markets
This indicator plot SMA series that fits Crypto, esp BTCUSD, XBTUSD
Good for 5m - 1H time period for Day Trading.
Specific SMA can be toggle on/off
---------- Française ----------
Le marché de la crypto-monnaie est différent des autres marchés financiers
Cet indicateur série SMA qui correspond à Crypto-monnaie, en particulier BTCUSD, XBTUSD
Bon pour 5m - 1H période pour le day trading.
SMA spécifique peut être activé / désactivé
---------- 中文 ----------
加密货币市场与其他金融市场不同
该指标绘制了适合加密货币的SMA系列,特别是BTCUSD,XBTUSD
适合5分钟 - 1小时 日间交易时间段。
特定SMA可以打开/关闭
----------日本語----------
暗号通貨市場は他の金融市場とは異なります
この指標は、暗号通貨、特にBTCUSD、XBTUSD用のSMAシリーズを描画します。
5分から1時間の取引期間に適しています。
特定のSMAをオン/オフにすることができます
---------- Disclaim ----------
Before using this indicator, you acknowledge that you have read and accepted that this indicator is for research purpose only and it does NOT provide any investment nor trading signal.
Users should make their own decisions, carefully assess risks and be responsible for their own investment and trading activities.


PerPro V7+AlertPerPro V7 with alarm. version can be configurable with telegram alert.
www.youtube.com

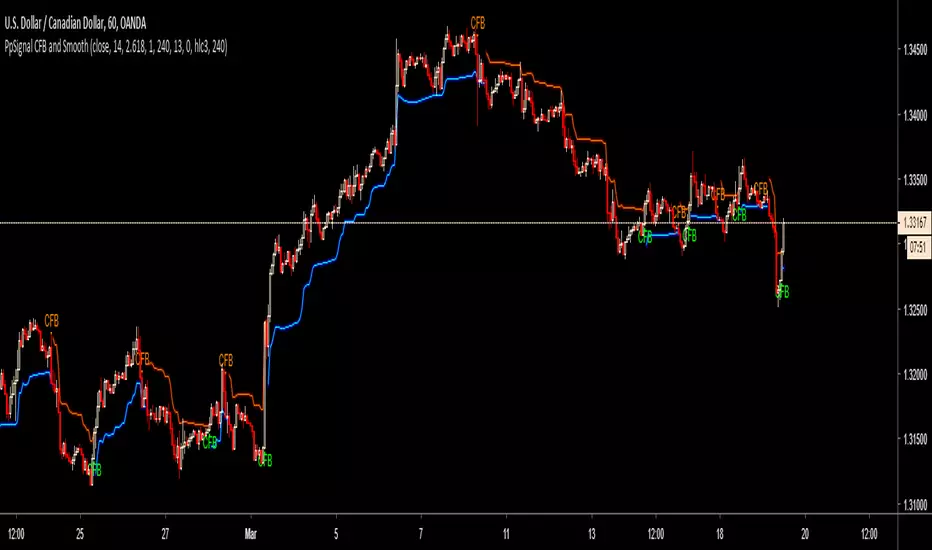
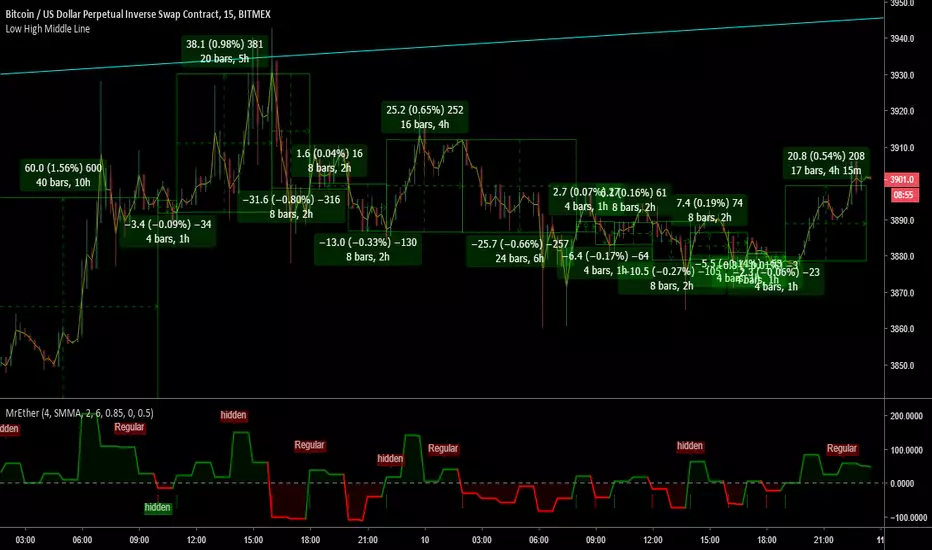
PpSignal CFB AlarmWhat is the Theory Behind CFB ?
CFB tells you how long the market has been in a quality trend. This value can be used to adjust the period length of other indicators, especially stochastic bands.
In order to quantify the overall duration of a market's trend, we replaced classical cycle analysis methods (FFT, MEM, MESA) with a form of analysis that works even when no cycles exist. We accomplished this by examining a time series for specific fractal patterns of any size. We then gather all the patterns found and combine them into one overall index, CFB (Composite Fractal Behavior) Index.
For good reason, CFB does not analyze time series data for dominant cycles. Classical cycle analysis examines data points (e.g. prices) and estimates the average presence of a cycle in the window. Now suppose a cycle with a period length of 9 days was strong for 50 days and then disappeared for the next 14 days. Because the cycle was present for 50 out of the last (50+14=64) days, the average presence of that cycle would be measured as "strong" even though it does not exist anymore!
Does CFB find the Dominant Cycle ?
No! Consider the following discussion about the MYTH of exploiting dominant cycles.
It is true that the market does have predictable cycles due to its "structural" or physical nature. For example, quarterly earning cycles, triple witching cycles, Federal Reserve meetings, weekly cycles, political election year cycles, the annual end-of-year stock dumping cycle, sunspot cycles, and the slow Kitchin (3-5 years), Juglar (7-11 years), Kuznet (15-25 years) and Kondratieff (45-60 years) cycles. They are very predictable and the markets readily discount their presence as far ahead in time as is reasonable. So there's not much left with regard to those cycles for you to exploit.
What traders see as cycles on an hourly chart, for example, is a different matter. The big, obvious cycles you see on price charts are actually the result of a combination of many weak cyclic forces that sometimes line up in phase to produce APPARENT dominant cycles that suggest the presence of a strong structural cycle that, in fact, does not exist. The slightest shifting in phase of any one component (due to crowd psychology, unscheduled events, etc.) will significantly alter the structure of the apparent dominant wave. This may drive the cycle into a "null" or random period, then reappear, completely out of phase. Now you see it ... and now you don't.
The transitory nature of these apparent dominant cycles makes their automated detection difficult and forecast unreliable. Sometimes cycle forecasting tools appear accurate and other times they are totally off mark. The reason is that tools designed to spot dominant cycles will announce whatever they find, even if they are only apparent (not structural) and transitory. For example, such tools would have no problem detecting cycles in the six charts below. But there is just one problem --- the slow cyclic price action in the six charts below is *impossible* to project into the future with any reasonable accuracy!
Why? Because we produced these six charts by simply adding consecutive random price changes. That's right!! These charts are nothing more than RANDOM WALKS. And by definition, they cannot be forecasted, no matter how impressive their apparent cyclic behavior may be!
The chart above does not "prove" market cycles are non-existent. Indeed, discretionary traders can learn to spot and use periodic price events, and take time to "understand" their causes, in order to verify whether the relevant triggers have actually occurred.
This demonstration does show, however, that cycle-finding tools like FFT, MESA and periodigrams, which have no understanding of market cause-effect relationships, can be easily fooled into seeing ghosts. In contrast, our CFB tool was designed to measure market trending action without assuming the existance of cycles. This makes CFB more reliable.
How would I use CFB's results ?
CFB produces a value proportional to a time series' trend duration. This value is in units of TIME, as measured in bars on a chart. Because CFB's output is in units of time and not price, CFB offers a unique window into a new dimension for representing signal behavior.
Investors have discovered many profitable ways to apply CFB:
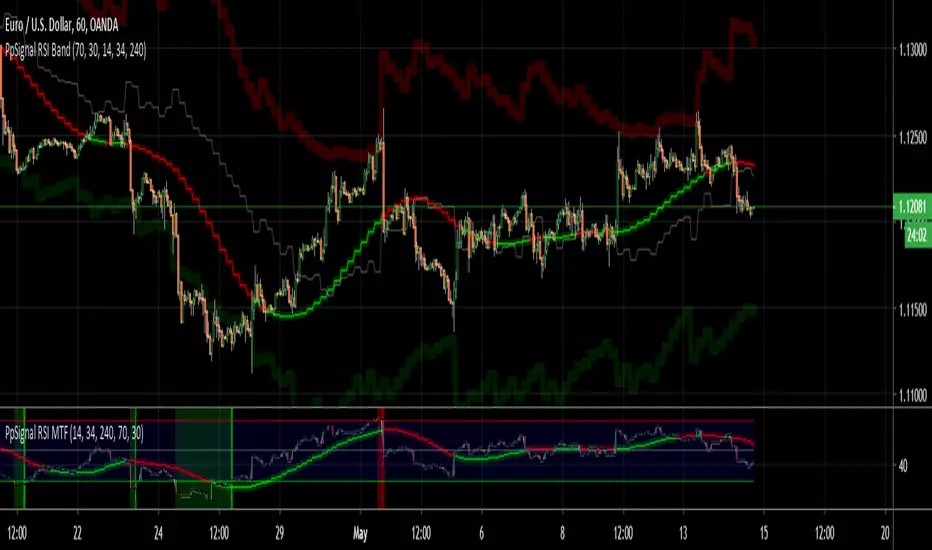
* To auto-adjust the lookback of classical indicators, such as RSI
* To auto-adjust the lookback depth of breakout channels in trending markets
* To auto-adjust the minimum amount of retracement needed to reverse position
Making a profit in the market requires your finding a unique niche that very few other people are exploiting. CFB offers this unique perspective.
Do I specify a "period length" for CFB?
In CFB, period length determines how many bars (time slices) are examined for specific fractal patterns. Due to the complexity of the algorithm, CFB permits only four period lengths: 24, 48, 96, 192. The 24-bar version can see trend fractals up to 24 bars wide, and so on. You get all four versions when ordering CFB.
________________________________
PpSignal tenkan sen and kijun sen MTFwww.investopedia.com
Tenkan sen and kijun sen MTF indicator not ichimoku could and Chikouspan.
I think these two moving averages give clear inputs and outputs, without having to fill the graph with the cloud.
PpSignal PerPro V6 Indicator Version with alarmThis is the of PerPro V6 indicator version with alarm. Remember in trend changes the indicator may repaint the signal. Please use other indicators to accompany the entries.
in small periods, such as 1, 3 and 5 minutes and pairs or high volatility stock we have seen a repaint until confirms the trend.
if you want to use it in 1, 3 or 5 minutes condigurelo in tf 1h or 240 up. in 1h charts we recommend 480, 720 or D in forex, in stock 1h tf W, in 1D graph set in W or M. It may be at the beginning of a new signal repaint.
I'll leave it free for 3 months then I'll change the code and make it private.

USD Coin Market CapThis is USD Coin (USDC) Market Cap with some additional features.
What is included
Dynamic market capitalization chart
Customizable SMA of the market capitalization
Crossovers highlighting
You can set alerts for crossovers with SMA
Alert for the specified positive % change
Alert for the specified negative % change
NOTE: The word "Dynamic" means that I didn't use any kind of the scalar values.


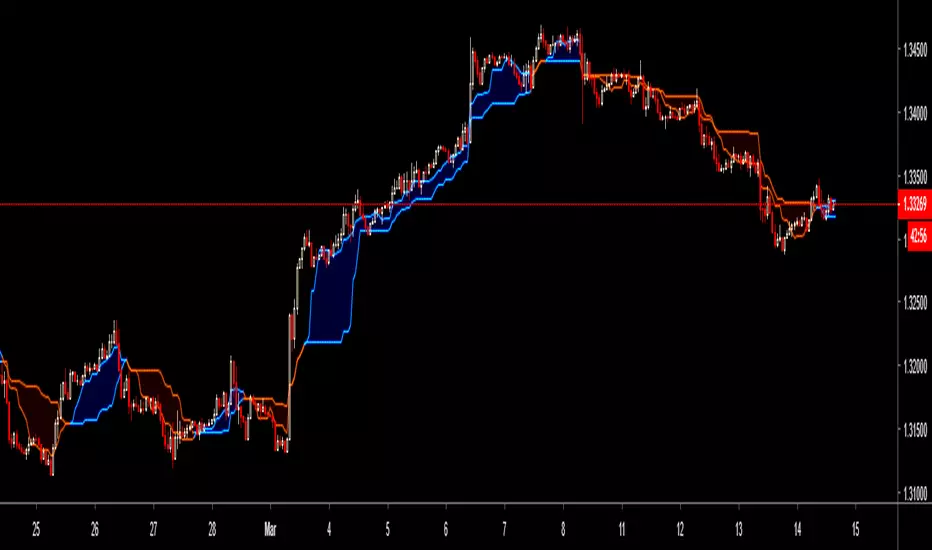
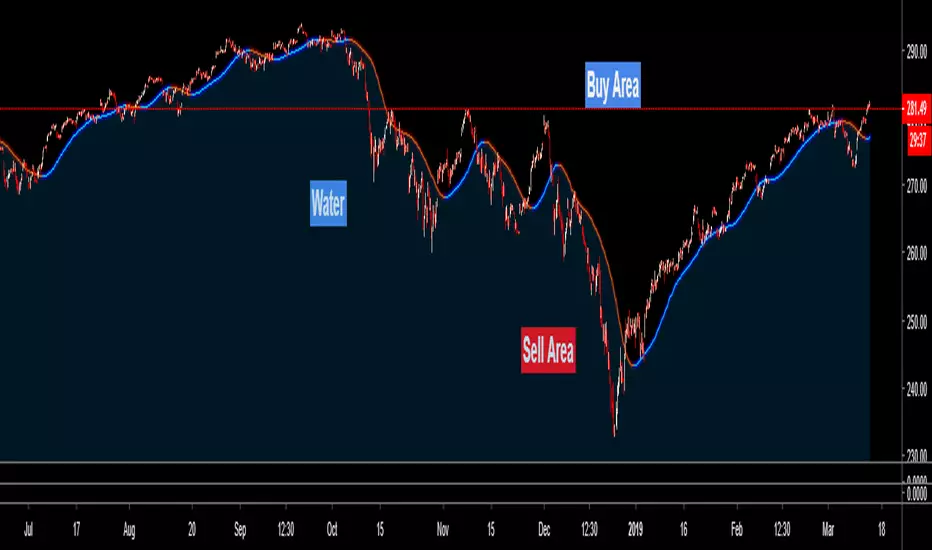
PpSignal On the water MA Buy when the price is out of the water and sell when the price is in the water.
From Lord Trend MT4 indicator idea.
PpSignal ADX Moving Average Trading in the direction of a strong trend reduces risk and increases profit potential. The average directional index (ADX) is used to determine when the price is trending strongly. In many cases, it is the ultimate trend indicator. After all, the trend may be your friend, but it sure helps to know who your friends are. In this article, we'll examine the value of ADX as a trend strength indicator.
Please watch the next web for more infomation
www.investopedia.com
we managed to reproduce the adx mobile average in the price or overlay chart

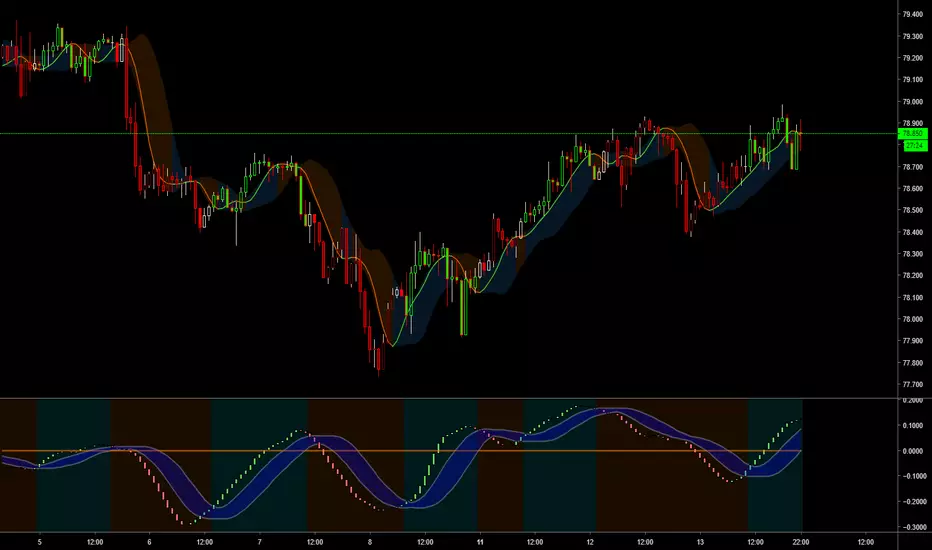
PpSignal Smoothed ROCThe Rate-of-Change (ROC) indicator, which is also referred to as simply Momentum, is a pure momentum oscillator that measures the percent change in price from one period to the next. The ROC calculation compares the current price with the price “n” periods ago.
we have smoothed the indicator to have more accurate entries
we add adaptive elder ema super smooth .


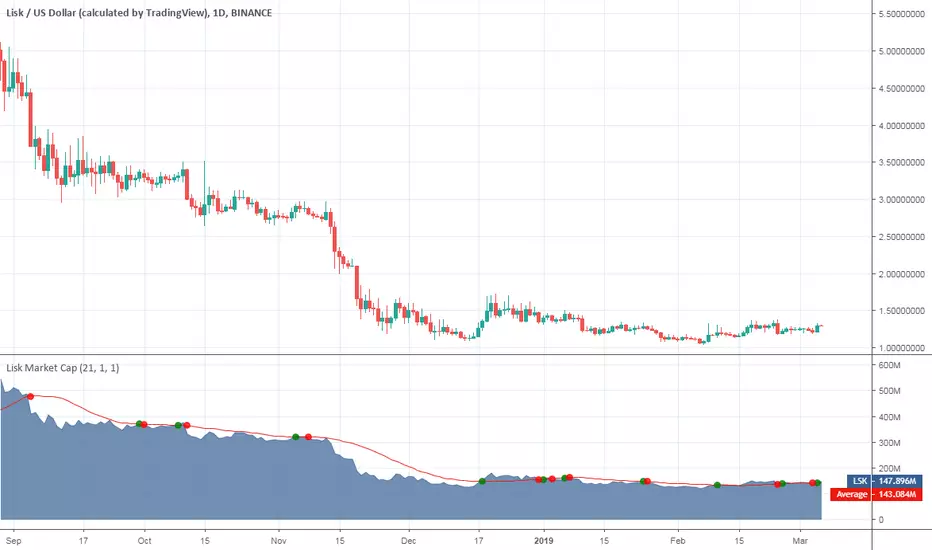
Lisk Market CapThis is Lisk (LSK) Market Cap with some additional features.
What is included
Dynamic market capitalization chart
Customizable SMA of the market capitalization
Crossovers highlighting
You can set alerts for crossovers with SMA
Alert for the specified positive % change
Alert for the specified negative % change
NOTE: The word "Dynamic" means that I didn't use any kind of the scalar values.
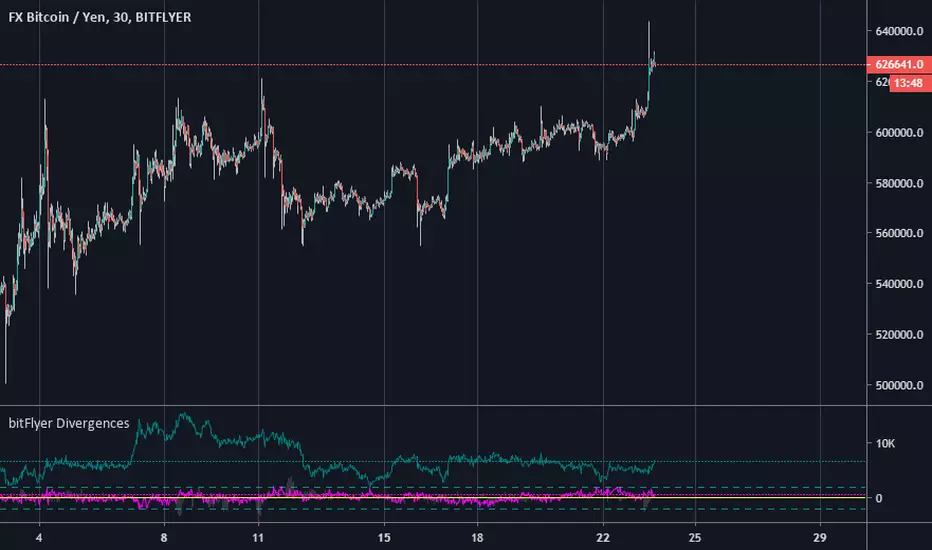
bitFlyer DivergencebitFlyer Divergence.
Basis is BitMEX:BXBT(converted into JPY).
*bitFlyer BTCJPY spot
*bitFlyer FXBTCJPY
Fuchsia(pink) = BTCJPY spot - BXBT
Teal(dark green) = FXBTCJPY - BTCJPY spot
Lime(light green) = BTCspot - BXBT
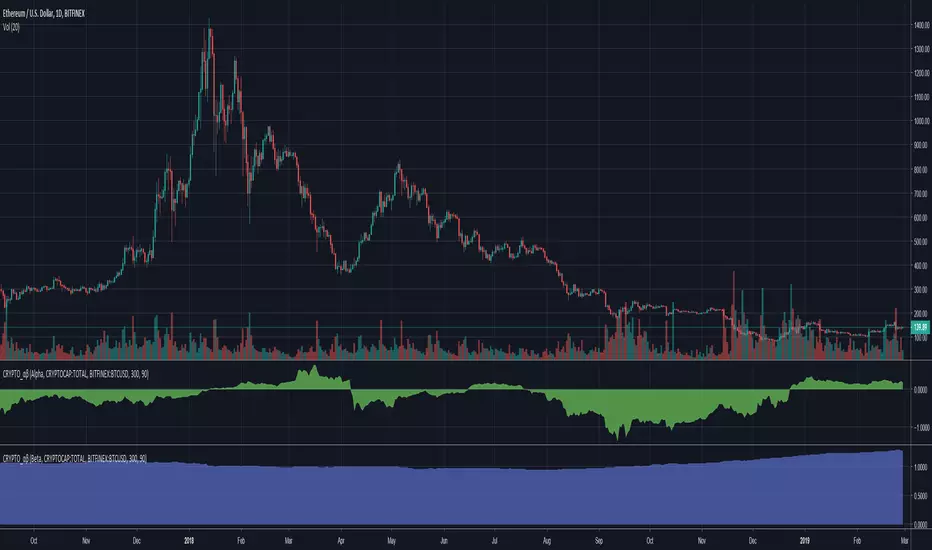
Cryptocurrency α / β (Alpha and Beta)Alpha and Beta for cryptocurrency. Custom input for other symbols.
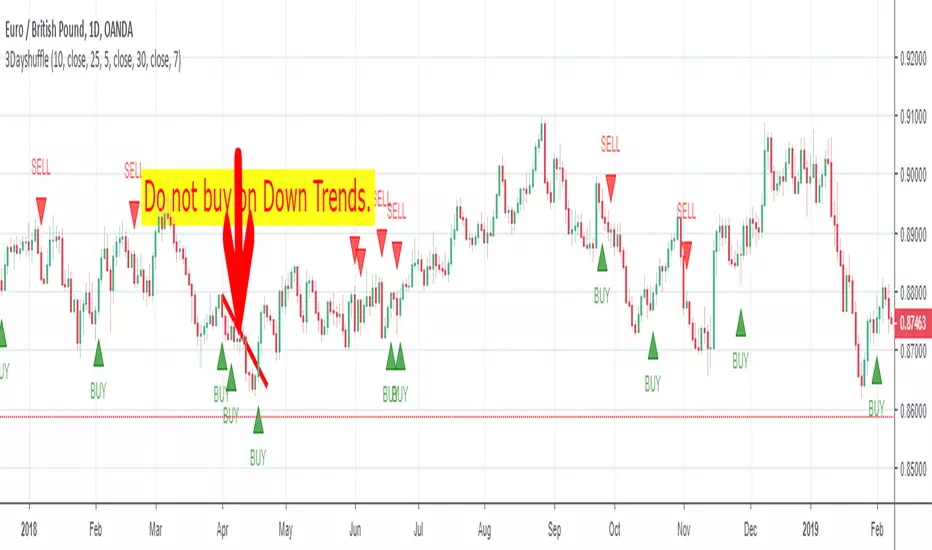
3DayshuffleThe 3 Day Shuffle Indicator indicates the best time to buy and sell based on a secret sauce. This is an Indicator not a strategy. Quick tip, keep the profits small(30-40pips) or Trail Stop it and keep the SL around 30-50 pips. Any comments Appreciated!
Any Tips are appreciated!
Bitcoin: 3M8cMjWXCbMBRbgMPS95wZGDZXXecL5q9v
Litecoin: MWd2E3T2BwZrPbS3DdYx2vvuapwoPQmvFo