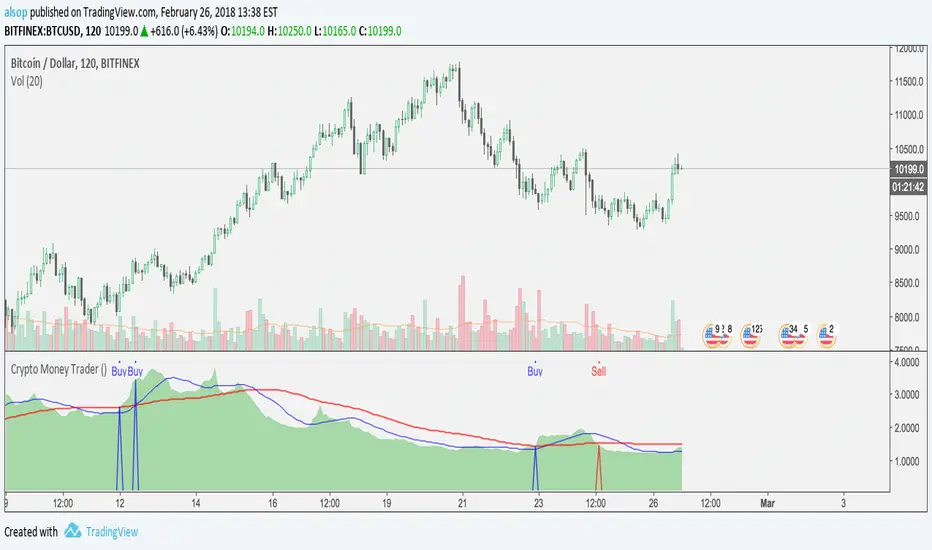
Crypto Money Trader - Indicator for Buy and Sell SignalsThis is it... the one that many have been waiting for.
We have taken everything we have learned from the Crypto Money Index and Crypto Money Bot and combined it into the best indicator possible for trading crypto currencies. This version also includes logic for shorts (sell) and another criteria for longs (buys).
The code is cleaner as well so there is less signal noise and more precise entries.
Before we released this script, we did backtesting on all the current supported USD pairs for optimal results.
Here is one set of results for BTC on 2 hour chats using $5,000 starting balance, 1 trade at once maximum, and 1 contract size:
www.cryptosignalsbot.com
Net Profit: $25,582, 511.64%
Total Trades: 17
Percent Profitable: 70.59%
Profit Factor: 4.304
Maximum Downdraw: $6,629
AvgTrade: $1,504.82, 30.1%
These results get even crazier when you get into settings where you can have 4 trades at once - beyond 700% return... crazy...
The indicator also includes alerts that you can setup so you are aware when a Buy or Sell signal is triggered. Just set an indicator alert for the Trigger Buy or Trigger Sell greater then a value of 0 and you will always know when it is time to look at the charts.
--== STRATEGY ==--
You can combine this indicator with other indicators in your strategy. Many of our most successful users of our previous scripts do just that as it helps them tune a perfect time for an entry.
Personally, we use the indicator and simple trendline entries. When a Buy or Sell triggers, draw a trendline and support / resistance lines and enter on a breakout. That's it.
Please note: this is not a "buy it or sell it now" kind of indicator. Sometimes it will signal a few hours early before a move.
--== SUPPORTED PAIRS ==--
We are always adding pairs, but as of February, 2018 this is our supported USD based pairs: BTC, ETH, LTC, XRP, NEO, BCH, IOT, EOS, BTG, ETC, ETP, OMG, EDO, ZEC, XMR, TRX, SAN, DSH, SNG
--== TELEGRAM CHANNEL ==--
All subscribers to this indicator will get access to our Exclusive Telegram Group where all the signals are analyzed and posted for you to see how we are playing the calls. You can either use this to learn how we use the indicator, or to trade from (at your own risk of course).
The alerts are all posted in this channel automatically and only the timeframes with the highest returns from extensive backtests are posted here automatically. However, we will sometimes post analysis on other timeframes as well.
--== BONUS ==--
As a subscriber, not only do you get this amazing indicator, but as a subscriber you will get access to our Crypto Money Index and the Crypto Money Bot
--== ACCESS ==--
Access is simple, go to our new website and register: Crypto Signals Bot
We will work to get you access to everything as quickly as possible. If you have any issues or questions, use the contact form on the website.
Криптовалюта
Multiple Moving AverageSuper simple script integrating three moving averages within only one script. It's going to help you to keep your chart cleaner while saving two spots for other indicators you may like. Try it out and let me know what you think.
A possible trading strategy:
Buy/Sell crossover of the MAs. Buy/Sell when fast MA crosses medium MA, double down when medium MA crosses slow MA.
Combining trading strategy is always a good idea.
Stochastic + Stochastic RSIJust a basic indicator I rigged up to help reduce screen real estate that ended up providing more insight than expected; overlays both the stochastic and stochastic RSI. While I initially made this to save space, I've begun to pick up on some interesting patterns in cryptocurrencies based on the divergence of stochastic from the stochastic RSI, and the comparison of their swing lows.
Left all settings modifiable, since this is simply a combination indicator I've left the source code open unlike other proprietary indicators I use.
Happy trading!
Austin Doyle
CTO
Crypto Playhouse

Crypto Altcoin USD Equivalent Value [anuva]Simply shows Altcoin/BTC pairs equivalent USD value on the left axis. Uses price from Bitstamp

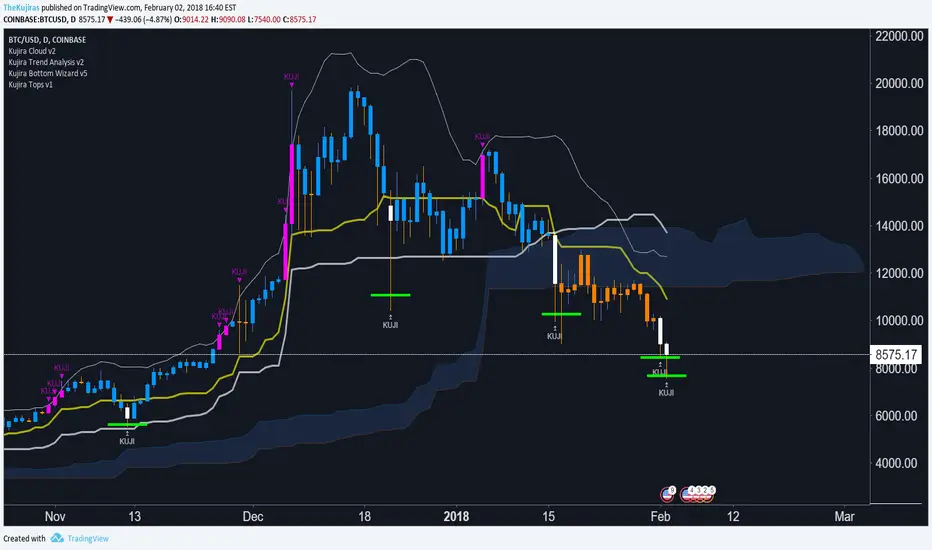
Kujira Ultimate v5 (Crypto)A complete Multi-Tool with Kuji Cloud and overbought/oversold power loss indicators. Power icons generally lead to price coming back to conversion line (yellow thick line).


Crypto IchimokuIchimoku Cloud with settings recommended for crypto by trader IAmSatoshi. Includes a handy checkbox to double inputs, and alerts that can be set for when the price crosses the bottom or top of the cloud.
This script also includes an ichimoku signal count. The signal count is an UNWEIGHTED sum of positive or negative ichimoku signals with the greatest total being shown in either green(long>short) or red(short>long) or white(0, long==short). The signal count is only shown when their is a new signal or a signal is no longer valid.
If you use a major portion of the code please cite me. If you like the script and make a bunch of money using it, feel free to donate using the crypto addresses below.
BTC: 34uVepgjGJAKqf9i3mfdq8AG1dzTthjCgb
ETH: 0x71B15Beb6AF985853B5fC80205ddb3595C51B63e
LTC: MVzvSu53K5qPfjiQn4nk9D6WVLJKCMzXHJ
DASH: XoKVDBnhiyPvJeyRdpHjcWu1WtVjCbhP68
XMR: 46jnYGp7v5vCSAV8pzGXPbWM7YFiZNB4eaFCHsezitQ46KM1E6FgPM9ZaYJEfDVk5zdKoPQ7vw27ke34jMxERogvJDQhfQW

Quadruple Moving Averages For Day TradingQuadruple Moving Averages For Day Trading Crypto
Inputs of 8,13,21,55
Based on chart used by Philakone.

Kujira Bottom Wizard v7.1Bottom finder for Cryptocurrencies - updated to include higher volatility in S* coins as well as top 100 marketcaps.


Kujira Tops v1For use with trend lines! Sell when the bar turns color and if the bar breaks a trend line down. If no trend lines are broken, then do not sell. This works well with cryptocurrency and high volatility stocks.


Crypto Ichimoku V.1Ichimoku Cloud with settings recommended for crypto by trader IAmSatoshi . Includes a handy checkbox to double inputs, and alerts that can be set for when the price crosses the bottom or top of the cloud.
This script also includes an ichimoku signal count. The signal count is an unweighted sum of positive or negative ichimoku signals with the greatest total being shown in either green(long>short) or red(short>long) or white(0, long==short). The signal count is only shown when their is a new signal or a signal is no longer valid.

Daytrading Indicator for trend continuation entry
Daytrading Indicator for precise entry base in trend continuation pattern
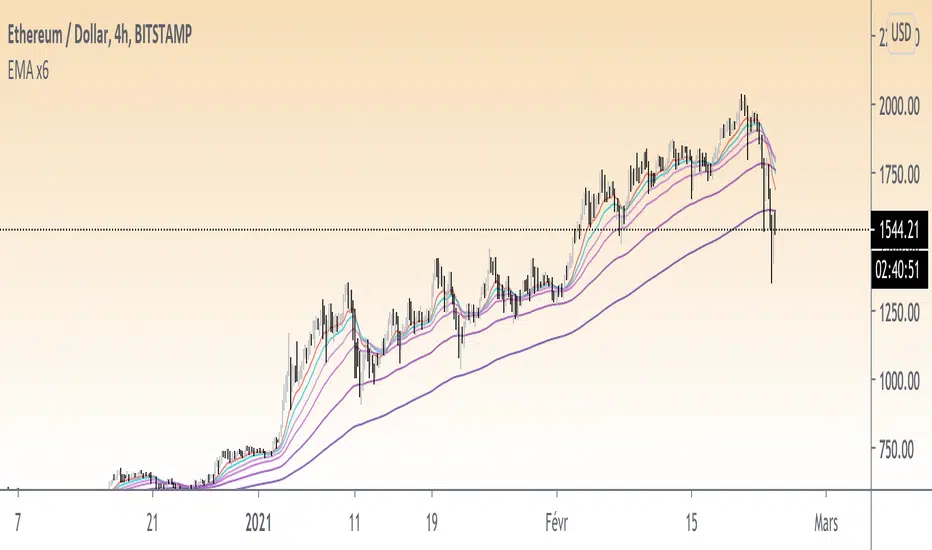
Multi EMAI really like to work with EMAs, but each time you use the "buit-in" one, you use one more slot in your indicators allowed.
So I built this simple one, 4 EMA in one indicator, and easy to use as following;
-displays 4 EMAs
-choose your EMA lenghts. bases are 20;50;100;200
-choose your color and other options as needed.
Hope you will enjoy it, and I will appreciate your feedback, and improvement suggestions.
Khaos-Crypto-TraderThis indicator has been developed to trade crypto-currencies, but can also be used to trade forex, stocks, and futures.
This Indicator is a full trading system that offers setups with Entries, Targets and Stops. This indicator is very accurate because it uses advanced setup detection and filtering logic.
The setup is triggered if the price passes the blue dot. Do not enter the trade unless price passes the blue dot. Each setup has 3 possible targets, which are dots colored green for longs and red for shorts.
The initial stop is the green square for longs, or the red square for shorts.
You can use the base-line (which is the dark blue line with dots) to manage the trade. One strategy would be if you enter a trade long, and reach the first target, you can take some profits, but still let the some of the position run, where a bar closing below the blue line, would stop out your remaining position.
To summarize:
Blue Dot = Entry Trigger
Green Dots = Long Targets (3 of them, for different price targets: target 1, 2 and 3)
Green Square = Long Stop Price
Red Dots = Short Targets (3 of them, for different price targets: target 1, 2 and 3)
Red Square = Short Stop Price
The great thing about this indicator is that its universal, there are no settings necessary -- just put it on the chart and it finds high probability setups and paints it on the chart as they occur. There is NO Repainting with this indicator.
Of course, you can add other indicators if you wish, and even add this indicator to your existing trading system.
Again, this indicator does NOT repaint.
Once a setup is found, the indicator draws the targets and stop at the setup bar close.
Setup Alerts are fully supported, via email, sms, and desktop notification.
LEGAL STUFF:
Risk Disclosure
Futures , forex, stock, crypto and derivative trading contains substantial risk and is not for every investor. An investor could potentially lose all or more than the initial investment. Risk capital is money that can be lost without jeopardizing ones’ financial security or life style. Only risk capital should be used for trading and only those with sufficient risk capital should consider trading. Past performance is not necessarily indicative of future results
Hypothetical Performance Disclosure
Hypothetical performance results have many inherent limitations, some of which are described below. no representation is being made that any account will or is likely to achieve profits or losses similar to those shown; in fact, there are frequently sharp differences between hypothetical performance results and the actual results subsequently achieved by any particular trading program. One of the limitations of hypothetical performance results is that they are generally prepared with the benefit of hindsight. In addition, hypothetical trading does not involve financial risk, and no hypothetical trading record can completely account for the impact of financial risk of actual trading. for example, the ability to withstand losses or to adhere to a particular trading program in spite of trading losses are material points which can also adversely affect actual trading results. There are numerous other factors related to the markets in general or to the implementation of any specific trading program which cannot be fully accounted for in the preparation of hypothetical performance results and all which can adversely affect trading results

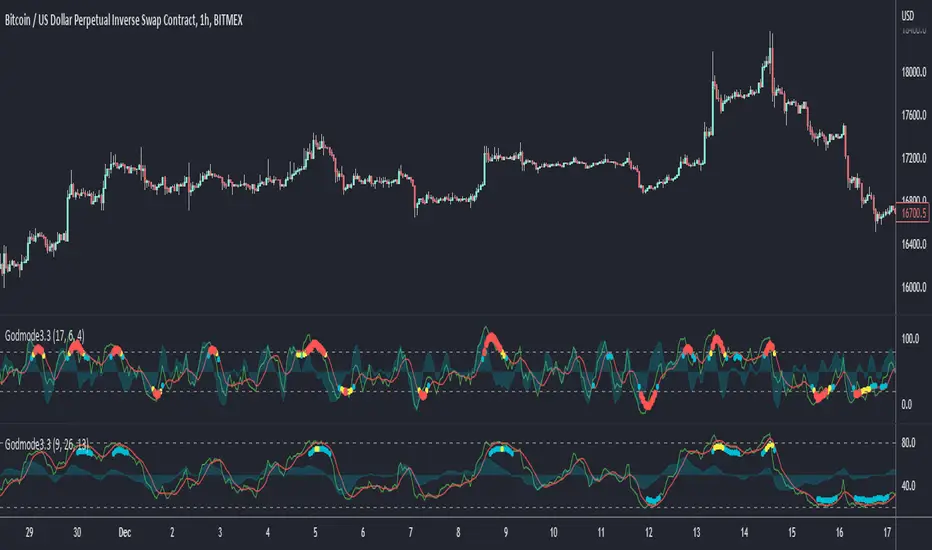
Godmode Oscillator 3.2This is nothing other than an update and slight modification to the original Godmode Oscillator published by xSilas
The update done by sco77m4r7in and myself.
Change Log:
Repaired the multi exchange option for BTC
Added additional 'Caution!' dots with color coding.
white = Early Caution signal
yellow = standard 'Caution!' signal
red = Extreme Caution signal
Be sure to give everyone a big thanks!
Original Godmode Script and Tutorial by xSilas :
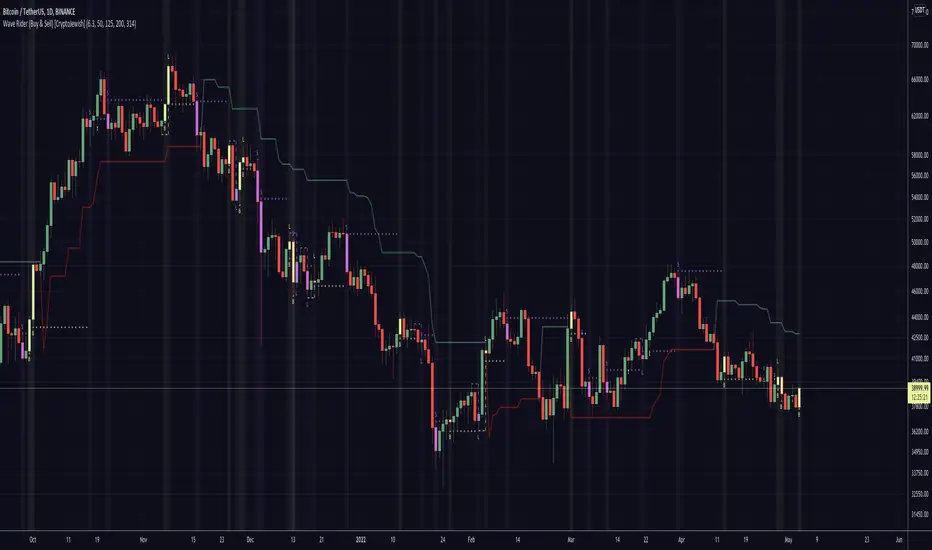
Buy + Sell [CryptoJewish]Beta
This indicator helps identify areas of buying and selling.
There are 4 levels of signals.
1. Weak
2. Medium
3. Strong
4. Extremely strong
Also there is a lagging indicator, which gives a signal of the 2nd level.
Levels greater than 1 are highlighted with a background and the color of the last bar is mixed with the color of the signal.
Almost everything can be turned on / off.
---
Additionally included:
- Ichimoku Cloud with settings for crypto (pure cloud, no extra lines)
- Bollinger Bands
- 4x SMA with a cross between them
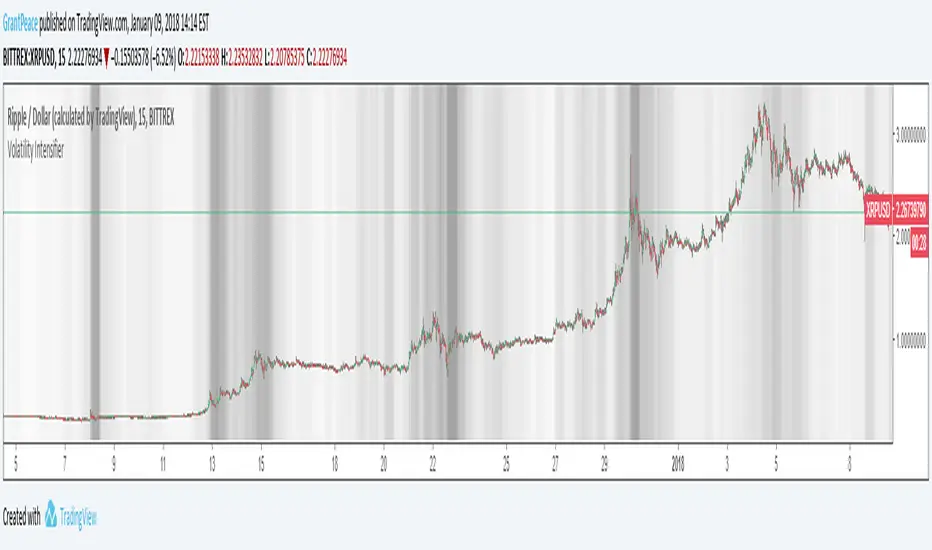
Volatility IntensifierThe background becomes increasingly dark during periods of high volatility.
...and yes, it can get completely black!
This makes it easier to identify areas that are "hot" with price action and appealing to trade.
Follow and comment to be added to the access to this indicator granted every Monday.
Like for more indicators! Thanks to all of my followers, you are the real MVP <3
To clarify; No, this indicator is based off of volatility, NOT volume :)
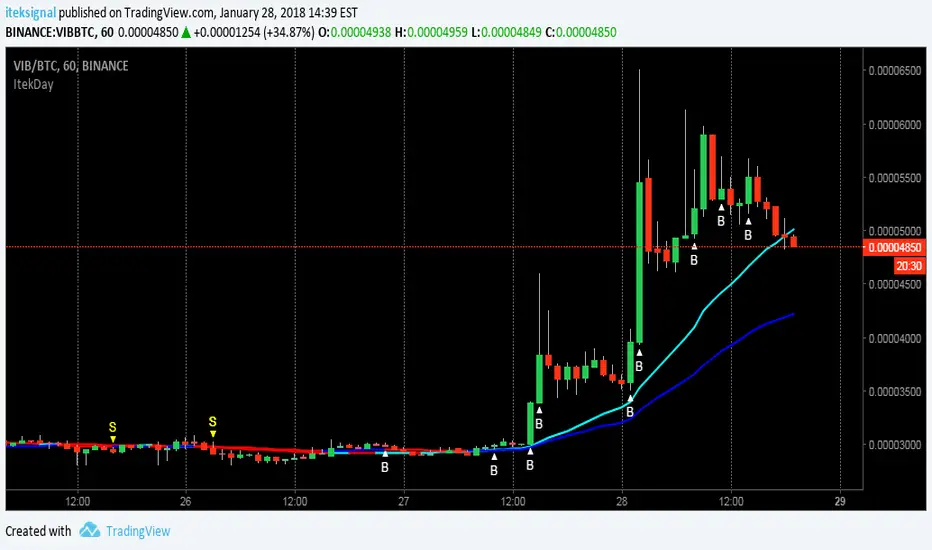
ITekSignal Full v1.0 Trend REVERSAL and CONTINUATION ITekSignal Trading System helps you identify trend reversals — quickly and accurately.
There’s a price action pattern that occurs in every market and on every time-frame.
This price pattern shows a fight for balance, between seller and buyers…
When the pattern is completed, that means the fight for balance has ended.
And you’d know which side has won: Seller or Buyers, Supply or Demand, Bulls or Bears.
Once ITekSignal indicator has spotted a reversal, it clearly displays these Buy or Sell alerts on your charts… showing you exactly where possible reversals may occur.
ITekSignal Indicator will draw an up/down arrow on your chart, telling you there’s a trade opportunity for you to consider. So we’d enter the market for a ride of the new trend.
The indicator is also capable of detecting CONTINUATION pattern (in addition to REVERSAL patterns)
ITekSignal indicator gives you all kinds of alerts you’ll ever need:
Trend Reversal alert & Trend Continuation alerts
Contact the Author for Subscription
@iteksignal
iteksignal@gmail.com

Bias Indicator (BI) 乖離率What is the Bias Indicator (BI)?
The Bias Indicator is basically based on the share price opening range
