QTheory [SSMT]QTheory –
This indicator is built on Quarterly Theory (developed by Daye)
🔹 Quarterly Theory
Markets often unfold in repeating quarterly cycles (Q1–Q4) across multiple timeframes — yearly, monthly, weekly, daily, 90-minute, and even micro cycles. By dividing price action into these quarters, traders can better anticipate structural shifts, accumulation/distribution phases, and liquidity runs.
🔹 Sequential SMT (SSMT)
Sequential SMT extends standard SMT (Smart Money Technique) by comparing multiple assets (such as FX majors) to identify divergences across quarters.
🔹 Features of QTheory
Automatic detection of quarterly cycles across multiple timeframes.
Visual cycle boxes & customizable dividers.
Integrated SSMT signals with divergence line visualization.
DFR (Defining Range) with Fibonacci levels.
Support for up to 5 comparison assets, with inversion options.
Auto-cycle selection for seamless multi-timeframe adaptation.
Extensive customization for colors, opacity, and signal display.
🔹 How it works
QTheory divides price data into consistent “quarters” across multiple timeframes. Within each cycle, it tracks highs, lows, and divergences, then overlays this information as boxes, dividers, and optional signals on your chart. Traders can use these visual cues to better align entries and exits with institutional market behavior patterns.
🔹 How to use it
Enable the desired cycle type (e.g., weekly, daily, 90-minute) from the settings.
Toggle boxes, dividers, and signals depending on your trading style.
Use SSMT divergences and DFR Fibs to anticipate a reversal
Compare against other assets (e.g., DXY or correlated pairs) to refine confluence.
Enable "Show Weekends" for Crypto.
⚠️ Disclaimer: This tool is for educational purposes only. It does not constitute financial advice. Always perform your own analysis and risk management.
Daye

True Opens 🧪 [Pro +] | cephxsTRUE OPENS 🧪
This indicator reflects, and is based on Public Domain Information available online. Utilizing concepts by Daye and ICT.
Multi-timeframe True Open indicator displaying key price levels across Micro, 90-minute, Daily, Weekly, and Monthly cycles with automatic timeframe visibility gating.
OVERVIEW
True Opens identifies the opening price of the second quadrant (Q2) across multiple "quarterly" cycles. In quarterly cycle theory, Q2 represents the "True Open" - a significant reference point where price often returns to during the cycle. This indicator automatically plots these levels across five timeframes, helping you identify key premium/discount zones and potential reversal areas.
WHAT IS A TRUE OPEN?
Each market cycle divides into four quarters (Q1-Q4). The Q2 opening price - the "True Open" - acts as a gravitational level that price tends to respect throughout the cycle. Understanding where these levels sit across multiple timeframes gives you confluence zones for higher-probability trade setups depending on your strategy. It is mostly tailored to quarterly theory traders.
FEATURES
5 Cycle Levels: Micro (~22min), 90-minute, Daily (6H sessions), Weekly, and Monthly True Opens
Auto Display Mode: Automatically shows relevant True Opens based on your chart timeframe
Session Labels: Clear identification of Asia, London, NY, and PM session True Opens
Smart Weekly Detection: Uses trading day logic for accurate Weekly True Open on all assets
DST-Aware: Timezone handling automatically adjusts for daylight saving time
Visual Clarity: Dashed lines during active Q2, solid lines after confirmation
Historical Mode: Option to display past True Opens for backtesting reference
CYCLE BREAKDOWN
Micro: 64 sessions per day (~22.5 min each), 16 micro cycles - ideal for scalping
90-Minute: 4 major sessions (Asia, London, NY, PM) each with 4 quarters - intraday trading
Daily: 4 x 6-hour sessions per day - swing/intraday trade reference, slightly longer term
Weekly: Tuesday open = Weekly True Open (Q2 of the week) - swing trading
Monthly: Second week of month = Monthly True Open - macro bias
INPUTS
Master Toggles
Show Micro True Opens: Toggle micro-level True Opens
Show 90m True Opens: Toggle 90-minute session True Opens
Show Daily True Opens: Toggle daily cycle True Opens
Show Weekly True Opens: Toggle weekly True Opens
Show Monthly True Opens: Toggle monthly True Opens
Display Mode
Auto: Automatically shows appropriate True Opens for current timeframe
Custom: Define your own visibility ranges per cycle level
Colors
Fully customizable colors for each cycle level
Settings
Active Line Bar Offset: How far labels extend from current bar
Show Historical True Opens: Display past cycle True Opens
HOW TO USE
Add indicator to your chart
Use Auto mode for automatic timeframe-appropriate display
Watch for price reactions at True Open levels
Look for confluence when multiple True Opens align
RECOMMENDED TIMEFRAMES
1-minute: Micro True Opens visible
3-5 minute: 90m True Opens visible
15min - 1H: Daily True Opens visible
1H - 4H: Weekly True Opens visible
4H - Daily: Monthly True Opens visible
BEST PRACTICES
Combine with market structure analysis for confirmation
True Opens can be used as time based Premium and Discount Levels
Multiple True Opens near same price = strong confluence zone (Stacked True Opens)
Weekly and Monthly True Opens carry more weight for directional bias
Use Micro True Opens for precision entries on lower timeframes
ASSETS
Works on all markets: Forex, Crypto, Indices, Stocks, and Futures. Weekly True Open detection uses smart trading-day logic that handles assets with non-standard session opens (e.g., ES futures opening Sunday 6PM).
DISCLAIMER
This indicator is for educational and informational purposes only. It does not constitute financial advice. Past performance does not guarantee future results. Always conduct your own research and use proper risk management. Trade responsibly.
CHANGELOG
v1.0: Initial release with 5-level True Open system
with ❤️ from cephxs

Quarterly Theory (Lé Modél) 🧪 [Ultimate +] | cephxsQUARTERLY THEORY (LÉ MODÉL) 🧪
SSMT + Timed Structural Swing Points + Alerts
This is mostly types using voice typing so the punctuation might be off.
This indicator uses public domain information based on a trading system called "Quarterly Theory" by TraderDaye & ICT. All concepts are freely available educational material that's been around for years. I just built a tool to visualize it properly.
WHAT IS THIS?
Alright so basically this is my attempt (pretty good attempt I'd say) at building the ultimate quarterly theory tool. It tracks multiple timeframe cycles (monthly, weekly, daily, 90m, and micro) and detects when correlated assets are diverging from each other at key swing points. That's the SSMT (sequential smt) part otherwise called an Offset Divergence either in an Accumulation/distribution phase of price.
On top of that, it finds timed structural swing points with their exact formation times, detects liquidity purges, and confirms change in state of delivery (CISD) through orderblock reclaims. Everything is wrapped in a pretty comprehensive alert system so you can actually trade off this stuff without staring at charts 24/7.
CORE FEATURES
Multi-Cycle SSMT Detection: tracks divergences across 5 nested cycles - monthly, weekly, daily, 90m, and micro. each cycle has its own visibility gates so you're only seeing what's relevant to your chart timeframe. They are also customizable so you are not restricted to what I think is best; nevertheless, hard gates are put in place to prevent unnecessary data calls too far back into history to allow users of all plans to use without errors (Bar data limits)
Timed Swing Points: every pivot high/low gets timestamped. you'll see exactly when the swing formed - super useful for macro window analysis (those :00-:10 and :50-:00 minute windows).
Liquidity Purges: automatically detects when price sweeps a previous swing high/low and reverses. shows both the sweep level and confirmation.
CISD (Change In State of Delivery): finds the stretch candle at pivots and waits for price to reclaim it. that's your delivery change confirmation.
Auto Asset Detection: just throw it on any chart and it figures out the correlated assets for you. works with indices ( CME_MINI:NQ1! , CME_MINI:ES1! , CBOT_MINI:YM1! ), forex majors ( FOREXCOM:EURUSD , FOREXCOM:GBPUSD ), metals ( FOREXCOM:XAUUSD , FOREXCOM:XAGUSD ), crypto, and more.
Normal + Hidden Divergences: normal divergence is when extremes diverge between assets. hidden divergence uses body closes instead of wicks - sometimes catches moves that normal misses.
Comprehensive Alert System: atomic alerts for individual events, preset combos for multi-confluence setups, and a custom "alert kitchen" to build your own conditions.
Each of these features can be visually disabled individually while the logic is still computed and alerts still function without bother.
THE CYCLES EXPLAINED
quarterly theory breaks time down into nested fractal cycles. each cycle divides into 4 quarters (Q1, Q2, Q3, Q4) where Q2 is typically expansion/displacement:
Monthly Cycle: tracks the 4 weeks of the month. best viewed on 4H charts and above
Weekly Cycle: Mon-Tue-Wed-Thu-Fri as the 5 "quarters". best on 1H charts.
Daily Cycle: the trading day split into 4 sessions (asia, london, ny am, ny pm). best on 15m.
90m Cycle: 6 x 90-minute windows throughout the day. best on 3-5m charts.
Micro Cycle: 22.5-minute quarters within each 90m block. 1m charts only.
Tried to implement a new Quarterly Cycle, will defer that to a later update.
VISIBILITY GATES
the indicator automatically shows/hides cycles based on your chart timeframe. here's how it works:
Auto Mode (recommended):
Micro: 1m only
90m: 3m-5m
Daily: 15m only
Weekly: 1H only
Monthly: 4H only
Extended Mode (more flexibility):
Micro: 1m-3m
90m: 1m-30m
Daily: 5m-1H
Weekly: 15m-4H
Monthly: 4H-1D
you can also set custom ranges or just show everything with "All" mode.
INPUTS BREAKDOWN
Visual Preset
All Features: shows everything - SSMT, time labels, CISD, purges
SSMT + TIME + CISD: hides purge lines for cleaner charts
SSMT + CISD: hides time labels too
SSMT Only: just the divergence lines, nothing else
SSMT Plots (Section 2)
Extreme Detection Mode: "Normal" uses wick extremes, "Hidden" uses body closes, "All" shows both
Per-Cycle Toggles: enable/disable each cycle independently with custom colors
Label Styling: choose between "Cycle + Asset", "Cycle" only, or "Asset" only labels
Pivot Detection (Section 3)
Sensitivity: controls how many bars on each side to confirm a swing (default: 2)
Maximum Points: limits how many pivots are displayed
Pivot Labels (Section 4)
Show Time Labels: displays the exact timestamp of each swing
Key Times Only: only shows labels for swings in macro windows (:00-:10, :24-:36, :50-:59)
Macro Colors: special highlighting for pivots during macro windows
Purge Detection (Section 5-6)
Pending Timeout: how many bars a purge can wait for confirmation before being discarded
Strict Key Time: requires both the sweep AND confirmation to be in key time windows
Dotted Line Offset: how far the confirmation line extends past the reversal candle
CISD Detection (Section 7-8)
Size Filter: filters out tiny orderblocks using ATR-based sizing. options from "Really Small" (shows most) to "Juicy" (only big ones)
Pending Timeout: bars before an unconfirmed CISD expires
Exhaustive Mode: shows all valid CISDs instead of limiting to max count
ALERT SYSTEM
this is where it gets powerful. three tiers of alerts:
Atomic Alerts (individual events):
Swing High/Low formed
Bearish/Bullish Purge confirmed
CISD Confirmed/Pending
Purge + CISD Combo
Preset Combos (multi-confluence):
M/W/D/90/Micro SSMT + CISD: fires when SSMT divergence is active AND CISD confirms in matching direction
Require Matching Purge: adds purge to the combo requirement
Stacked Alerts: triggers when 2+ cycles align simultaneously
Alert Kitchen (custom builder):
build your own combo by selecting:
Which SSMT cycle (with direction: bullish/bearish/any)
Whether CISD is required
Whether matching purge is required
Purge tolerance (how close the purge pivot needs to be)
Session Filter:
all alerts can be filtered to only fire during specific sessions:
Asia: 18:00-00:00 ET
London: 02:00-05:00 ET
NY AM: 08:30-12:00 ET
NY PM: 13:30-16:00 ET
Custom time ranges
AUTO ASSET DETECTION
the indicator uses the AssetCorrelation library to automatically figure out which assets to compare. here's what it supports:
US Indices: CME_MINI:NQ1! , CME_MINI:ES1! , CBOT_MINI:YM1! (or micros MNQ/MES/MYM)
Forex Majors: FOREXCOM:EURUSD , FOREXCOM:GBPUSD vs TVC:DXY
Metals: FOREXCOM:XAUUSD , FOREXCOM:XAGUSD , Copper
Energy: CL (crude), RB (gasoline), HO (heating oil)
Crypto: BTC, ETH, TOTAL3 as triad
EU Indices: GER40, EU50, UK100, ESP35
you can also disable auto mode and manually configure your own asset triads/dyads.
STATUS BAR
optional horizontal bar showing which SSMT cycles are currently active. displays M | W | D | 90m | Micro with color coding:
Blue = bullish divergence active
Red = bearish divergence active
Gray = neutral (no divergence)
Purple = both directions active simultaneously (sandwich)
RECOMMENDED USAGE
start with "Auto" timeframe gating - it shows the right cycles for your chart
focus on cycles that align with your trading style (scalpers: 90m/micro, swing: daily/weekly)
use CISD confirmation before entries - divergence alone isn't enough (at least for me)
Pair with True Opens to align properly (This is a trading model in itself)
set up preset alerts for your main setup (e.g., "D SSMT + CISD" on 15m chart)
filter alerts to your active trading session to reduce noise
TIMEFRAME CHEAT SHEET
1m: Micro cycle + 90m context
3-5m: 90m cycle + Daily context
15m: Daily cycle + Weekly context
1H: Weekly cycle + Monthly context
4H: Monthly cycle only
FAQ
why don't i see any SSMT lines?
check your timeframe gating mode. if you're on a 15m chart with "Auto" mode, you'll only see Daily cycle. switch to "Extended" or "All" to see more cycles.
what's the difference between normal and hidden divergence?
normal uses wick highs/lows, hidden uses body closes. hidden can catch divergences that wicks miss, but it's also noisier.
Why do some CISDs not confirm?
the stretch candle needs to be reclaimed by price within the timeout window. if price never comes back to that level, the CISD expires.
can i use this on stocks?
technically yes, but you'll need to manually configure your asset pairs since auto-detection focuses on futures/forex/crypto.
DISCLAIMER
this is an educational tool, not financial advice. quarterly theory, SSMT, and all related concepts are based on publicly available information from TraderDaye and ICT methodology on X with a touch of my own discoveries too.
past performance doesn't guarantee future results. always use proper risk management and never trade more than you can afford to lose. the indicator is provided as-is with no guarantees.
do your own backtesting before using this in live markets.
CREDITS
Quarterly Theory concepts: TraderDaye & ICT
AssetCorrelation library: fstarcapital
Development: cephxs & fstarcapital community
CHANGELOG
Ultimate +: added Alert Kitchen, stacked cycle alerts, session filtering, status bar, size-filtered CISD
Pro +: added hidden divergences, added sweep detection/plots, auto asset detection, preset combos
Base: initial release with core SSMT and pivot time labels
No form of this Library is to be sold in any capacity as part of any service / indicator on the TradingView Platform or elsewhere by anyone else but me.
Otherwise it is completely free to use in private and public open/closed source indicators.
Sidenote: 3rd upload because I'm trying to get the thumbnail right :(
Made with ❤️ from cephxs

AssetCorrelationLibraryLibrary "AssetCorrelationLibrary™"
detectIndicesFutures(ticker)
Detects Index Futures (NQ/ES/YM/RTY + micro variants)
Parameters:
ticker (string) : The ticker string to check (typically syminfo.ticker)
Returns: AssetPairing with secondary and tertiary assets configured
detectMetalsFutures(ticker)
Detects Metal Futures (GC/SI/HG + micro variants)
Parameters:
ticker (string) : The ticker string to check
Returns: AssetPairing with secondary and tertiary assets configured
detectForexFutures(ticker)
Detects Forex Futures (6E/6B + micro variants)
Parameters:
ticker (string) : The ticker string to check
Returns: AssetPairing with secondary and tertiary assets configured
detectEnergyFutures(ticker)
Detects Energy Futures (CL/RB/HO + micro variants)
Parameters:
ticker (string) : The ticker string to check
Returns: AssetPairing with secondary and tertiary assets configured
detectTreasuryFutures(ticker)
Detects Treasury Futures (ZB/ZF/ZN)
Parameters:
ticker (string) : The ticker string to check
Returns: AssetPairing with secondary and tertiary assets configured
detectForexCFD(ticker, tickerId)
Detects Forex CFD pairs (EUR/GBP/DXY, USD/JPY/CHF triads)
Parameters:
ticker (string) : The ticker string to check
tickerId (string) : The full ticker ID (syminfo.tickerid) for primary asset
Returns: AssetPairing with secondary and tertiary assets configured
detectCrypto(ticker, tickerId)
Detects major Crypto assets (BTC, ETH, SOL, XRP, alts)
Parameters:
ticker (string) : The ticker string to check
tickerId (string) : The full ticker ID for primary asset
Returns: AssetPairing with secondary and tertiary assets configured
detectMetalsCFD(ticker, tickerId)
Detects Metals CFD (XAU/XAG/Copper)
Parameters:
ticker (string) : The ticker string to check
tickerId (string) : The full ticker ID for primary asset
Returns: AssetPairing with secondary and tertiary assets configured
detectIndicesCFD(ticker, tickerId)
Detects Indices CFD (NAS100/SP500/DJ30)
Parameters:
ticker (string) : The ticker string to check
tickerId (string) : The full ticker ID for primary asset
Returns: AssetPairing with secondary and tertiary assets configured
detectEUStocks(ticker, tickerId)
Detects EU Stock Indices (GER40/EU50) - Dyad only
Parameters:
ticker (string) : The ticker string to check
tickerId (string) : The full ticker ID for primary asset
Returns: AssetPairing with secondary asset configured (tertiary empty for dyad)
getDefaultFallback(tickerId)
Returns default fallback assets (chart ticker only, no correlation)
Parameters:
tickerId (string) : The full ticker ID for primary asset
Returns: AssetPairing with chart ticker as primary, empty secondary/tertiary (no correlation)
applySessionModifierWithBackadjust(tickerStr, sessionType)
Applies futures session modifier to ticker WITH back adjustment
Parameters:
tickerStr (string) : The ticker to modify
sessionType (string) : The session type (syminfo.session)
Returns: Modified ticker string with session and backadjustment.on applied
applySessionModifierNoBackadjust(tickerStr, sessionType)
Applies futures session modifier to ticker WITHOUT back adjustment
Parameters:
tickerStr (string) : The ticker to modify
sessionType (string) : The session type (syminfo.session)
Returns: Modified ticker string with session and backadjustment.off applied
isTriadMode(pairing)
Checks if a pairing represents a valid triad (3 assets)
Parameters:
pairing (AssetPairing) : The AssetPairing to check
Returns: True if tertiary is non-empty (triad mode), false for dyad
getAssetTicker(tickerId)
Extracts clean ticker string from full ticker ID
Parameters:
tickerId (string) : The full ticker ID (e.g., "BITGET:BTCUSDT.P")
Returns: Clean ticker string (e.g., "BTCUSDT.P")
resolveTriad(chartTickerId, pairing)
Resolves triad asset assignments with proper inversion flags
Parameters:
chartTickerId (string) : The current chart's ticker ID (syminfo.tickerid)
pairing (AssetPairing) : The detected AssetPairing
Returns: Tuple
resolveDyad(chartTickerId, pairing)
Resolves dyad asset assignment with proper inversion flag
Parameters:
chartTickerId (string) : The current chart's ticker ID
pairing (AssetPairing) : The detected AssetPairing (dyad: tertiary is empty)
Returns: Tuple
resolveAssets(ticker, tickerId, assetType, sessionType, useBackadjust)
Main auto-detection entry point. Detects asset category and returns fully resolved config.
Parameters:
ticker (string) : The ticker string to check (typically syminfo.ticker)
tickerId (string) : The full ticker ID (typically syminfo.tickerid)
assetType (string) : The asset type (typically syminfo.type)
sessionType (string) : The session type for futures (typically syminfo.session)
useBackadjust (bool) : Whether to apply back adjustment for futures session alignment
Returns: AssetConfig with fully resolved assets, inversion flags, and detection status
resolveCurrentChart()
Simplified auto-detection using current chart's syminfo values
Returns: AssetConfig with fully resolved assets, inversion flags, and detection status
AssetPairing
Core asset pairing structure for triad/dyad configurations
Fields:
primary (series string) : The primary (chart) asset ticker ID
secondary (series string) : The secondary correlated asset ticker ID
tertiary (series string) : The tertiary correlated asset ticker ID (empty for dyad)
invertSecondary (series bool) : Whether secondary asset should be inverted for divergence calc
invertTertiary (series bool) : Whether tertiary asset should be inverted for divergence calc
AssetConfig
Full asset resolution result with mode detection and computed values
Fields:
detected (series bool) : Whether auto-detection succeeded
isTriadMode (series bool) : True if triad (3 assets), false if dyad (2 assets)
primary (series string) : The resolved primary asset ticker ID
secondary (series string) : The resolved secondary asset ticker ID
tertiary (series string) : The resolved tertiary asset ticker ID (empty for dyad)
invertSecondary (series bool) : Computed inversion flag for secondary asset
invertTertiary (series bool) : Computed inversion flag for tertiary asset
assetCategory (series string) : String describing the detected asset category
Note to potential users.
I did not really intend to make this public but i have to in order to avoid any potential compliance issues with the TradingView Moderation Team and the House Rules.
However if you are to use this library, you cannot make your code closed source / invite only as it is intellectual property. The only exception to this is if I am credited in the header of your code and i explicitly give permission to do so.
As per the TradingView house rules, you are completely FREE to do with this as you like, provided the script stays private.
Use the @fstarcapital tag to give credits
❤️ from cephxs

HTF PSP [Pro +] | [cephxs × fadi]This is a fork of the HTF indidcator by @fadizeidan
Link to Original Publication Here:
There are no excessive changes to the orriginal codebase. Only additions, they are listed below.
Precision Swing Point visualization from the HTF onto the current chart.
Before now, I had a PSP indicator, one could use to see PSP's on the current chart timeframe
Here:
I recieved lots of requests on X to make it like this HTF indicator, so i reached out to Fadi, and he gave me permission to do so. So i forked his indicator and implemented the PSP logic i had from my indicator into his HTF candle framework. Made my work incredibly easier so propd to him.
Be sure to give support to his tradingview profile as this may have been possible without him but would have been much harder.
It has a couple features ported from my PSP logic.
Automatic Asset detection for popular assets, Futures and common Forex Pairs.
Real time detection of PSP divergences at a literal glance without having to jump around timeframes.
I'm out of ideas on what to include in this description as i did not add much to the indicator so that will be it. Toodles.
Be sure to reach out on tradingview for support on any bug(s) you might encounter so it can be made better for all.
Made with ❤️ from cephxs

QT Previous Micro Cycle Range + SSMT [bilal]Previous Micro Cycle Range + SMTs - Indicator Description
📊 Overview
This indicator tracks 22.5-minute micro cycles within ICT's Quarterly Theory framework and automatically detects Smart Money Technique (SMT) divergences across correlated indices (NQ, ES, YM). It visualizes previous cycle ranges and identifies high-probability manipulation completions for precise intraday entries.
🎯 What It Does
Micro Cycle Tracking:
Divides each 90-minute session into four 22.5-minute micro quarters
Plots the previous micro cycle's High, Low, Equilibrium (EQ), and Quarter levels
Updates automatically as new micro cycles form
Works on any timeframe (recommended: 1-5 minute charts)
SMT Detection:
Compares current micro cycle vs previous micro cycle across NQ, ES, and YM
Detects Bearish SMT: Divergence at highs (signals distribution down)
Detects Bullish SMT: Divergence at lows (signals distribution up)
Draws visual SMT lines with directional arrows showing correlation/divergence
Optional SMT table showing all three indices' movements
💡 How To Use It
For Scalpers & Day Traders:
Wait for a new micro cycle to begin (lines will refresh every 22.5 minutes)
Watch for SMT formation in the current cycle
Bullish SMT = Buy signal (previous low is confirmed, expect move to previous high)
Bearish SMT = Sell signal (previous high is confirmed, expect move to previous low)
Key Concepts:
Minimum Target: Opposite extreme of previous cycle
SMT Confirmation: One or two indices sweep a level while the other(s) fail to sweep
Best Results: Trade with higher timeframe bias aligned
⚙️ Features
Customizable Display:
Toggle High/Low lines with multiple label styles (Timeframe, Label, %, Fib)
Optional Equilibrium (50%) level
Optional Quarter levels (25% / 75%)
Optional extended range projections (±50% to ±400%)
Adjustable line colors, widths, and label sizes
SMT Options:
Enable/disable SMT detection
Show/hide SMT text labels
Custom colors for bullish/bearish SMTs
Option to delete previous cycle SMTs (keeps chart clean)
Real-time SMT table showing all three indices
Comparison Assets:
Default: ES1! and YM1! (customize to your preference)
Set correlation type for each asset (correlated vs inverse)
Disable individual assets if needed
🔍 Understanding The Visuals
Lines:
Solid lines = Previous cycle High/Low (where price came from)
Dotted lines = EQ and Quarter levels (internal cycle structure)
Green lines = SMT divergence detected (buy/sell signal)
Labels:
▲ = Asset made higher high/low vs previous cycle
▼ = Asset made lower high/low vs previous cycle
🔺 = Inverse correlation (up when others down)
🔻 = Inverse correlation (down when others up)
SMT Logic:
If indices diverge (move opposite directions), SMT is confirmed
Bearish SMT = Highs diverge → Sell
Bullish SMT = Lows diverge → Buy
📈 Best Practices
Use on 1-5 minute charts for optimal micro cycle visualization
Combine with higher timeframe bias (Daily Cycle SSMT, session bias, etc.)
Wait for SMT confirmation before entering trades
Target previous cycle's opposite extreme as minimum profit target
Exit when opposing SMT forms or price reaches target
🛠️ Settings Guide
Essential Settings:
Comparison Symbols: Set to the indices you trade (default: ES1!, YM1!)
Show Cycle SMT: Toggle SMT detection on/off
Delete Previous Cycles SMTs: Keep chart clean by removing old SMTs
Visual Preferences:
Line Color/Width: Customize previous cycle lines
Label Style: Choose between Timeframe (22.5m), Label (descriptive), % (percentage), or Fib (0-1)
Show High/Low: Toggle previous cycle extremes
Show EQ/Quarters/Extended Ranges: Add more reference levels as needed
⚠️ Important Notes
This indicator shows previous cycle ranges, not predictive future levels
SMTs are confirmation signals for manipulation completion
Always use proper risk management and combine with your trading plan
Best results when aligned with higher timeframe directional bias
🎓 Based On ICT Concepts
This indicator implements concepts from Inner Circle Trader (ICT):
Quarterly Theory (fractal time structure)
Micro cycles (22.5-minute quarters)
Sequential SMT (mechanical divergence confirmation)
Smart Money accumulation, manipulation, distribution (AMD)
Perfect for: Scalpers, day traders, and anyone using ICT's Quarterly Theory and SMT concepts for precise intraday entries.
Note: This is a study indicator (overlay=true). It does not generate buy/sell signals automatically - you must interpret SMT formations based on your trading strategy.RéessayerGu should know it only works on the 30s chart btwPrevious Micro Cycle Range + SMTs - Indicator Description
📊 Overview
This indicator tracks 22.5-minute micro cycles within ICT's Quarterly Theory framework and automatically detects Smart Money Technique (SMT) divergences across correlated indices (NQ, ES, YM). It visualizes previous cycle ranges and identifies high-probability manipulation completions for precise intraday entries.
⚠️ IMPORTANT: This indicator is designed to work on the 30-second chart only. The micro cycle calculations are optimized for 30s timeframe data.
🎯 What It Does
Micro Cycle Tracking:
Divides each 90-minute session into four 22.5-minute micro quarters
Plots the previous micro cycle's High, Low, Equilibrium (EQ), and Quarter levels
Updates automatically as new micro cycles form every 22.5 minutes
Precise timing based on New York timezone session structure
SMT Detection:
Compares current micro cycle vs previous micro cycle across NQ, ES, and YM
Detects Bearish SMT: Divergence at highs (signals distribution down)
Detects Bullish SMT: Divergence at lows (signals distribution up)
Draws visual SMT lines with directional arrows showing correlation/divergence
Optional SMT table showing all three indices' movements in real-time
💡 How To Use It
Setup:
Switch to 30-second chart (required for accurate cycle timing)
Add indicator to your chart
Ensure you're viewing NQ, ES, or YM (or correlated futures)
For Scalpers & Day Traders:
Wait for a new micro cycle to begin (lines will refresh every 22.5 minutes)
Watch for SMT formation in the current cycle
Bullish SMT = Buy signal (previous low is confirmed, expect move to previous high)
Bearish SMT = Sell signal (previous high is confirmed, expect move to previous low)
Key Concepts:
Minimum Target: Opposite extreme of previous cycle
SMT Confirmation: One or two indices sweep a level while the other(s) fail to sweep
Best Results: Trade with higher timeframe bias aligned (Daily Cycle SSMT, session bias)
⚙️ Features
Customizable Display:
Toggle High/Low lines with multiple label styles (Timeframe, Label, %, Fib)
Optional Equilibrium (50%) level
Optional Quarter levels (25% / 75%)
Optional extended range projections (±50% to ±400%)
Adjustable line colors, widths, and label sizes
Line extension length (default: 15 bars ahead)
SMT Options:
Enable/disable SMT detection
Show/hide SMT text labels with ticker symbols and directional arrows
Custom colors for bullish/bearish SMT lines
Option to delete previous cycle SMTs (keeps chart clean)
Real-time SMT table showing all three indices' current status
Comparison Assets:
Default: ES1! and YM1! (customize to your preference)
Set correlation type for each asset (correlated vs inverse)
Disable individual assets if needed
Works with any correlated futures contracts
Debug Mode:
Toggle debug info to see current NY time, session, and micro cycle timing
Helpful for understanding cycle structure and troubleshooting
🔍 Understanding The Visuals
Lines:
Solid lines = Previous cycle High/Low (where price came from)
Dotted lines = EQ and Quarter levels (internal cycle structure)
Green lines (default) = SMT divergence detected (buy/sell signal)
Gray dotted lines = Extended range projections (if enabled)
Labels:
▲ = Asset made higher high/low vs previous cycle (correlated)
▼ = Asset made lower high/low vs previous cycle (correlated)
🔺 = Inverse correlation (up when others down)
🔻 = Inverse correlation (down when others up)
SMT Logic:
If indices diverge (move opposite directions), SMT is confirmed
Bearish SMT = Highs diverge → High is set, expect distribution down
Bullish SMT = Lows diverge → Low is set, expect distribution up
📈 Best Practices
Must use 30-second chart - indicator timing is calibrated for this timeframe
Combine with higher timeframe bias (Daily Cycle SSMT, 90-min SSMT, session bias)
Wait for SMT confirmation before entering trades (don't front-run)
Target previous cycle's opposite extreme as minimum profit target
Exit when opposing SMT forms or price reaches target
Best windows: Q2→Q3 or Q3→Q4 transitions within 90-minute sessions
Volatility injection times: Watch 09:30, 10:00, and 14:00 ET for strongest moves
🛠️ Settings Guide
Essential Settings:
Comparison Symbols: Set to the indices you monitor (default: ES1!, YM1!)
Correlation Type: Toggle "Correlated" on/off for each asset based on expected relationship
Show Cycle SMT: Enable/disable SMT detection
Show SMT Text: Toggle labels showing ticker divergence details
Delete Previous Cycles SMTs: Keep chart clean by removing old SMTs
Visual Preferences:
Line Color/Width: Customize previous cycle lines (default: black, width 1)
Label Style: Choose between:
Timeframe (shows "22.5m")
Label (descriptive: "previous micro cycle high/low")
% (shows "100%/0%")
Fib (shows "1/0")
Show High/Low: Toggle previous cycle extremes (recommended: ON)
Show EQ/Quarters/Extended Ranges: Add more reference levels as needed
SMT Customization:
SMT Colors: Customize bearish/bullish SMT line colors (default: green for both)
SMT Label Colors: Background and text color for SMT labels
SMT Table: Toggle real-time comparison table (bottom right)
⚠️ Important Notes
30-second chart required - will not work accurately on other timeframes
This indicator shows previous cycle ranges, not predictive future levels
SMTs are confirmation signals for manipulation completion, not entry triggers alone
Always use proper risk management and position sizing
Best results when aligned with higher timeframe directional bias
Monitor all three indices (NQ, ES, YM) for complete SMT picture
Micro cycles are part of a fractal structure - align with 90-min and Daily Cycle SMTs
🎓 Based On ICT Concepts
This indicator implements concepts from Inner Circle Trader (ICT):
Quarterly Theory (fractal time structure - 22.5 min micro quarters)
Micro cycles (four quarters within each 90-minute session)
Sequential SMT (mechanical divergence confirmation across correlated indices)
Smart Money AMD (Accumulation, Manipulation, Distribution pattern)
New York session timing (based on ICT's 6-hour daily cycles)
🕐 Micro Cycle Structure
Each 90-minute session divides into four 22.5-minute micro quarters:
Micro Q1: 00:00 - 22:30
Micro Q2: 22:30 - 45:00
Micro Q3: 45:00 - 67:30
Micro Q4: 67:30 - 90:00
This pattern repeats across all 16 daily 90-minute sessions (Q1.1 through Q4.4).
Perfect for: Scalpers and day traders using ICT's Quarterly Theory and SMT concepts for precise micro-level entries on 30-second charts.
Chart Requirement: 30-second timeframe only.
Note: This is a study indicator. It does not generate automatic buy/sell signals - you must interpret SMT formations based on your trading strategy and higher timeframe bias.

QT Insights [Pro +]: PSP + TPD Alerts | [cephxs]This indicator's primary function is to highlight chart candlestick divergence with candle closes.
*A full list of the Supported Correlated Asset Pairings (CAPs) will be linked at the bottom.
There are two primary operating modes
PSP Only
All precision candles
There is a tooltip describing what each operating mode does in the indicator settings
Asset Selection
The indicator handles asset selection for divergences automatically for a large variety of asset(s) classes automatically and is ready for use Out of the Box with Major Assets like:
CME_MINI:NQ1! , CME_MINI:ES1! , CBOT_MINI:YM1!
It also works with non-futures for indices (CFD), for best functionality with no stress, we only have support for the following brokers. CAPITALCOM, VANTAGE, OANDA
It works with Forex, Crypto and Energies, also works with Metals.
The default pairings are determined by the active chart
i.e CME_MINI:NQ1! will pair with Asset 2 as CME_MINI:ES1! and Asset 3 as CBOT_MINI:YM1!
Alerts
This version has alerts, I will create a tutorial for that. You can use the alerts by adding alerts and selecting the indicator from the "Contdition" Dropdown in the Alert Creation Pop-up
Customizations
The indicator is fully customizable in the Styles tab under the settings
Play around with it and determine what works best with your aesthetic, it comes out of the box with a lot of clutter and as you can see in the showcase image, it's clean and functional, just how I like it.
*Supported CAPs
CFD
Forex:
EURUSD / GBPUSD (FOREXCOM Only)
Indices:
NAS100 / SPX500 / US 30 (CAPITALCOM / Vantage / Oanda Only)
Metals:
XAUUSD / XAGUSD
Futures
Indices:
NQ / MNQ , ES / MES , YM / MYM
Metals:
GC / MGC , SI / SIL
Crypto
BTCUSD / ETHUSD, this will work for any asset with "BTC" or "ETH" in the asset name
Note: There is support for Micro contracts automatically
Subsequent Updates Will be posted, Stay tuned.
Note: I wrote this description on the fly so there might be flaws, Regardless, made with ❤️ by cephxs

Quarterly Theory [@kaleboraciy]🧠 Daye Quarterly Theory is based on the idea that markets often move in repeating cycles. Each part of the cycle reflects a stage of the market
Consolidation
Manipulation
Distribution
Reversal/Continuation
This is a classic AMD-X pattern, which is widely used in SMC & ICT concepts. By spotting these phases, traders can better understand where the market might be heading next.
⭐ An important feature of this indicator is the Fibonacci levels, which are calculated in a clever way on the Q1 part of each cycle. You can use this levels for precise entries on manipulation in Q2
📖 Now I want to give brief description of each cycle:
Daily Cycle - the day can be broken down into 6 hour quarters
Q1 - 18:00 - 00:00 Asia.
Q2 - 00:00 - 06:00 London (True Open).
Q3 - 06:00 - 12:00 NY AM.
Q4 - 12:00 - 18:00 NY PM.
Pro tips:
Q2 often lines up with the session’s True Open - a key reference for directional bias.
Q3 tends to show the most directional momentum during the trading day.
Q4 is a critical zone for judging whether the day will extend the move or retrace.
Weekly Cycle - Daye determined that although the trading week is composed of 5 trading days, we should ignore Friday, and the small portion of Sunday’s price action:
Q1 - Monday
Q2 - Tuesday (True Open, Daily Candle Open Price).
Q3 - Wednesday.
Q4 - Thursday.
Pro tips:
Wednesday (Q3) often provides the week’s strongest directional movement - many trades target this zone.
Tuesday’s manipulation (Q2) may shake out weak positions or set up the directional swing - be careful
Thursday (Q4) helps confirm whether the weekly trend continues or reverses.
Monthly Cycle - considering that we have four weeks in a month, we start the cycle on the first Monday of the month (regardless of the calendar Day):
Q1 - Week 1: first Monday of the month.
Q2 - Week 2: second Monday of the month (True Open, Daily Candle Open Price).
Q3 - Week 3: third Monday of the month.
Q4 - Week 4: fourth Monday of the month.
I hope, that this awesome tool will boost your trading 💰

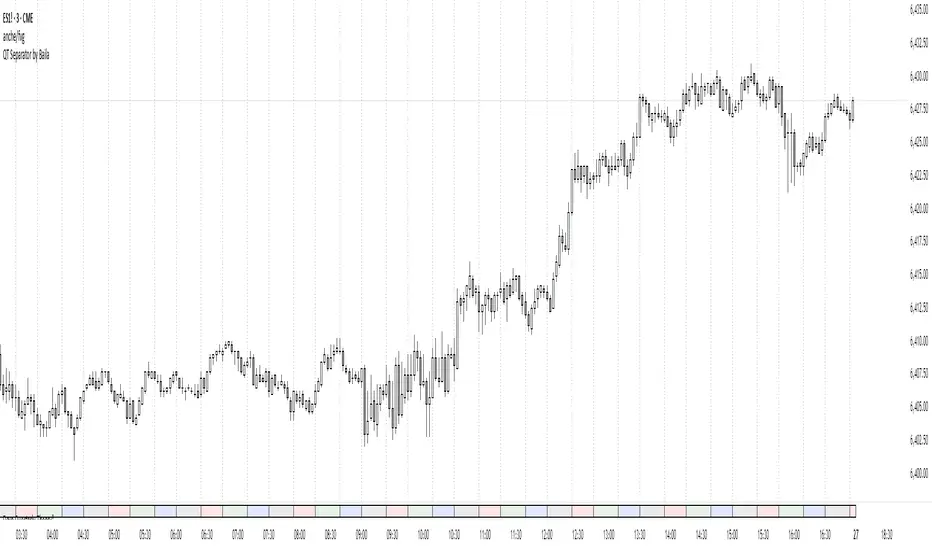
QT Separator by BailaSimple and Clean QT indicator.
Helps to spot SSMT
Based on: Daye Quarterly Theory by toodegrees
These Quarters represent:
A - Accumulation (required for a cycle to occur)
M - Manipulation
D - Distribution
X - Reversal/Continuation
Quarterly Theory ICT 01 [TradingFinder] XAMD + Q1-Q4 Sessions🔵 Introduction
The Quarterly Theory ICT indicator is an advanced analytical system based on the concepts of ICT (Inner Circle Trader) and fractal time. It divides time into quarterly periods and accurately determines entry and exit points for trades by using the True Open as the starting point of each cycle. This system is applicable across various time frames including annual, monthly, weekly, daily, and even 90-minute sessions.
Time is divided into four quarters: in the first quarter (Q1), which is dedicated to the Accumulation phase, the market is in a consolidation state, laying the groundwork for a new trend; in the second quarter (Q2), allocated to the Manipulation phase (also known as Judas Swing), sudden price changes and false moves occur, marking the true starting point of a trend change; the third quarter (Q3) is dedicated to the Distribution phase, during which prices are broadly distributed and price volatility peaks; and the fourth quarter (Q4), corresponding to the Continuation/Reversal phase, either continues or reverses the previous trend.
By leveraging smart algorithms and technical analysis, this system identifies optimal price patterns and trading positions through the precise detection of stop-run and liquidity zones.
With the division of time into Q1 through Q4 and by incorporating key terms such as Quarterly Theory ICT, True Open, Accumulation, Manipulation (Judas Swing), Distribution, Continuation/Reversal, ICT, fractal time, smart algorithms, technical analysis, price patterns, trading positions, stop-run, and liquidity, this system enables traders to identify market trends and make informed trading decisions using real data and precise analysis.
♦ Important Note :
This indicator and the "Quarterly Theory ICT" concept have been developed based on material published in primary sources, notably the articles on Daye( traderdaye ) and Joshuuu . All copyright rights are reserved.
🔵 How to Use
The Quarterly Theory ICT strategy is built on dividing time into four distinct periods across various time frames such as annual, monthly, weekly, daily, and even 90-minute sessions. In this approach, time is segmented into four quarters, during which the phases of Accumulation, Manipulation (Judas Swing), Distribution, and Continuation/Reversal appear in a systematic and recurring manner.
The first segment (Q1) functions as the Accumulation phase, where the market consolidates and lays the foundation for future movement; the second segment (Q2) represents the Manipulation phase, during which prices experience sudden initial changes, and with the aid of the True Open concept, the real starting point of the market’s movement is determined; in the third segment (Q3), the Distribution phase takes place, where prices are widely dispersed and price volatility reaches its peak; and finally, the fourth segment (Q4) is recognized as the Continuation/Reversal phase, in which the previous trend either continues or reverses.
This strategy, by harnessing the concepts of fractal time and smart algorithms, enables precise analysis of price patterns across multiple time frames and, through the identification of key points such as stop-run and liquidity zones, assists traders in optimizing their trading positions. Utilizing real market data and dividing time into Q1 through Q4 allows for a comprehensive and multi-level technical analysis in which optimal entry and exit points are identified by comparing prices to the True Open.
Thus, by focusing on keywords like Quarterly Theory ICT, True Open, Accumulation, Manipulation, Distribution, Continuation/Reversal, ICT, fractal time, smart algorithms, technical analysis, price patterns, trading positions, stop-run, and liquidity, the Quarterly Theory ICT strategy acts as a coherent framework for predicting market trends and developing trading strategies.
🔵b]Settings
Cycle Display Mode: Determines whether the cycle is displayed on the chart or on the indicator panel.
Show Cycle: Enables or disables the display of the ranges corresponding to each quarter within the micro cycles (e.g., Q1/1, Q1/2, Q1/3, Q1/4, etc.).
Show Cycle Label: Toggles the display of textual labels for identifying the micro cycle phases (for example, Q1/1 or Q2/2).
Table Display Mode: Enables or disables the ability to display cycle information in a tabular format.
Show Table: Determines whether the table—which summarizes the phases (Q1 to Q4)—is displayed.
Show More Info: Adds additional details to the table, such as the name of the phase (Accumulation, Manipulation, Distribution, or Continuation/Reversal) or further specifics about each cycle.
🔵 Conclusion
Quarterly Theory ICT provides a fractal and recurring approach to analyzing price behavior by dividing time into four quarters (Q1, Q2, Q3, and Q4) and defining the True Open at the beginning of the second phase.
The Accumulation, Manipulation (Judas Swing), Distribution, and Continuation/Reversal phases repeat in each cycle, allowing traders to identify price patterns with greater precision across annual, monthly, weekly, daily, and even micro-level time frames.
Focusing on the True Open as the primary reference point enables faster recognition of potential trend changes and facilitates optimal management of trading positions. In summary, this strategy, based on ICT principles and fractal time concepts, offers a powerful framework for predicting future market movements, identifying optimal entry and exit points, and managing risk in various trading conditions.

Correlated asset and Daye's Quarterly TheoryThis indicator is based on the Quarterly Theory concepts from Daye. You can find him mainly on X as traderdaye.
It works on a new panel and the quarters will be drawn over the chart of the correlated that you set on its settings.
You can use every asset to compare with the main one to make easier to find divergences between days, sessions and 90 minutes cycles.
In different timeframes, the indicator could show more or less information about quarters, but will always show the compared asset one. This is due to limitations of the candles start (for example, the Session's Q2 open won't be shown on an hourly chart because it starts after 30 minutes of candle's open).
What can this indicator do for you?
- Show the correlated asset chart.
- Show daily, session and 90 minutes cycle boxes.
- Show Midnight and every session's Q2 open.
- Make easier for the trained eye to determine if the model is AMDX or XAMD, find PO3, turtle soups, SMT divergences, etc.
Do you have any suggestion? Please, leave it on the comments. I'll try to improve this indicator regularly.

Daye Quarterly Theory ~ DQT [Liquidity_Pro]Thanks
This indicator puts the time-based research of trader Daye on your chart. Daye studied the ICT killzones and macro times and presented his findings, as “Quarterly Theory” on YouTube. Thank you Daye for sharing!
This indicator is not the first, so S/O to @toodegrees, @a1tmaniac and @joshuuu for their own excellent Quarterly Theory indicators. Last but not least, huge thanks go to ICT for his trading innovation and generous free price action education and to @twingall for his insight, attention to detail and great teamwork coding this indicator.
Daye’s Quarterly Theory
First, the fundamental concept is that all units of time can be divided by four into quarters -- just as we look at the year’s corporate reporting cycle of Q1, Q2, Q3, and Q4.
Dividing the day by four, into six hour quarters and again into 90 minute quarters and again into 22.5 minute ‘Micro’ quarters we reach the smallest unit shown by this indicator. Apply it to your NQ1! or ES1! charts and you may see remarkable confluence with the ICT macro times!
Why would we want to do this? It helps us understand, visualize and predict ICT’s PO3 concept:
• A - Accumulation (required for a cycle to occur)
• M - Manipulation
• D - Distribution
• X - Reversal/Continuation
The bottom line - we want to sell after a manipulation (M) up, or buy after a manipulation down and Quarterly Theory plots times on your chart where this may occur. Every asset is different, so back-test and research it.
Note, this indicator always shows Q1 as the accumulation quarter (by color), but the order is not fixed and instead of AMDX may appear as XAMD, where Q1 is the Reversal/Continuation quarter. We may eventually offer an update to this indicator which would automatically transpose the quarter colors for you.
The Quarters
Yearly:
• Q1 - Jan, Feb, Mar
• Q2 - Apr, May, Jun
• Q3 - Jul, Aug, Sep
• Q4 - Oct, Nov, Dec
Monthly (starts with the first month’s Monday regardless of the date):
• Q1 - Week 1, first Monday of the month
• Q2 - Week 2, second Monday of the month
• Q3 - Week 3, third Monday of the month
• Q4 - Week 4, fourth Monday of the month
Weekly (Daye ignores Friday and Sunday’s price action):
• Q1 - Mon
• Q2 - Tue
• Q3 - Wed
• Q4 - Thu
Daily (times are all EST / New York):
• Q1 - 18:00 - 00:00 Asia
• Q2 - 00:00 - 06:00 London
• Q3 - 06:00 - 12:00 NY AM
• Q4 - 12:00 - 18:00 NY PM
90 Minute:
• Q1 - 18:00 - 19:30
• Q2 - 19:30 - 21:00
• Q3 - 21:00 - 22:30
• Q4 - 22:30 - 00:00
Micro (22.5 minute quarters, DQT only displays Micros on 7 minute TF or lower)
• Q1 - 18:00 - 18:22:30
• Q2 - 18:22:30 - 18:45
• Q3 - 18:45 - 19:07:30
• Q4 - 19:07:30 - 19:30
About the DQT Indicator
This indicator plots the quarterly time boxes in a panel which can be placed above or below your chart. It allows you to add labels with the opening time and dates and also place time of day markers which can be useful for anyone who wants to mark lunch, and of the trading day or perhaps a favorite ICT macro time. It also works on GOLD (CAPITALCOM), DXY (TVC), currencies and stocks in Regular Trading Hour (RTH) mode.
Note the way that the indicator displays quarters is affected by the time frame you are viewing and as a result you may notice imperfections. Also, the indicator is not tuned to work with every broker, so for example with DXY, you will see the TVC feed is displayed nicely but other feeds are not.
Settings
The DQT indicator offers a great deal of flexibility to customize the display of quarters aesthetically. But it’s designed to work out-of-the-box on both light and dark background charts. It's set up to only show 90 minute and micro quarters initially, but in the settings, you can turn on the daily, weekly, monthly, and yearly quarters. Remember you will only see the Micros on the 7 minute TF or lower.
Lastly, the DQT indicator works well with our DOB indicator allowing you to visualize the confluence of high timeframe PDAs or POIs with manipulation quarters.
If you find our indicators useful, please boost, comment and share -- it's very motivational for us to develop them further and publish new ones!

Daye Quarterly Theory by toodegrees> Introduction and Acknowledgements
The Daye Quarterly Theory° tool encompasses the cyclical Time aspect of the markets as studied and developed by Daye (traderdaye on Twitter).
I am not the creator of this Theory, and I do not hold the answers to all the questions you may have; I suggest you to study it from Daye's tweets and material.
I collaborated directly with Daye to bring a comprehensive Time tool to Tradingview.
S/O to @a1tmaniac and @joshuuu for their previous works on this Theory.
> Tool Description
This is purely a graphical aid for traders to be able to quickly determine Daye's Quarterly Cycles, and save Time while on the charts.
The disruptive value of this tool is that it reliably plots forwards in Time, allowing you to strategize and tape read efficiently; as well as calculating all the Cycles, from Micro Sessions, to the Year.
> Quarterly Theory by Daye
The underlying idea is that Time is to be divided in Quarters for correct interpretation of Market Cycles. The specific starting point of a Cycle will depend on the Timeframe at hand.
Daye being one of the most prominent Inner Circle Trader students, these ideas stem from ICT's concepts themselves, and are to be used hand in hand (PD Array Matrix, PO3, Institutional Price Levels, ...).
These Quarters represent:
A - Accumulation (required for a cycle to occur)
M - Manipulation
D - Distribution
X - Reversal/Continuation
The latter are going to always be in this specific sequence; however the cycle can be transposed to have its beginning in X, trivially followed by A, M, and finally D.
This feature is not automatic and at the subjective discretion of the Analyst.
Note: this theory has been developed on Futures, hence its validity and reliability may change depending on the market Time.
This tool does provide a dynamic and auto-adapting aspect to different market types and Times, however they must be seen as experimental.
> Quarterly Cycles
The Quarterly Cycles currently supported are: Yearly, Monthly, Weekly, Daily, 90 Minute, Micro Sessions.
– Yearly Cycle:
Analogously to financial quarters, the year is divided in four sections of three months each
Q1 - January, February, March
Q2 - April, May, June (True Open, April Open)
Q3 - July, August, September
Q4 - October, November, December
Note: this Cycle is the most difficult to optimize as Timeframes become more granular due to the sheer length of its duration. With Time and advancements it will become more accurate. This is the only Cycle for which accuracy is not 100%.
– Monthly Cycle:
Considering that we have four weeks in a month, we start the cycle on the first month’s Monday (regardless of the calendar Day).
Q1 - Week 1, first Monday of the month
Q2 - Week 2, second Monday of the month (True Open, Daily Candle Open Price)
Q3 - Week 3, third Monday of the month
Q4 - Week 4, fourth Monday of the month
– Weekly Cycle:
Daye determined that although the trading week is composed by 5 trading days, we should ignore Friday, and the small portion of Sunday’s price action.
Q1 - Monday
Q2 - Tuesday (True Open, Daily Candle Open Price)
Q3 - Wednesday
Q4 - Thursday
– Daily Cycle:
The Day can be broken down into 6H quarters. These Times roughly define the sessions of the Trading Day, reinforcing the Theory’s validity.
Q1 - 18:00 - 00:00, Asian Session
Q2 - 00:00 - 06:00, London Session (True Open, Midnight New York Time)
Q3 - 06:00 - 12:00, NY Session
Q4 - 12:00 - 18:00, PM Session
Note: these Times are based on Futures Trading in New York Time, these will vary depending on the market type (experimental).
– 90 Minute Cycle:
Merely dividing one of the Daily Cycle’s Quarters we obtain 90 minute quarters. The first one in a Trading Day – 90min Cycles of the Asian Session – follows as an example, in New York Time.
Q1 - 18:00 - 19:30
Q2 - 19:30 - 21:00 (True Open)
Q3 - 21:00 - 22:30
Q4 - 22:30 - 00:00
– Micro Cycle:
Lastly, dividing a 90 Minute Cycle yields 22.5 Minute Quarters, known as Micro Sessions. An example breaking down the 90 Minute Cycle from 18:00 to 19:30 follows.
Q1 - 18:00 - 18:22:30
Q2 - 18:22:30 - 18:45 (True Open)
Q3 - 18:45 - 19:07:30
Q4 - 19:07:30 - 19:30
Note: trivially, these may not be exact unless the Timeframe is in the seconds, to correctly account for the half minute in each quarter – this said the tool is able to plot these anyways, although slight inaccuracy needs to be taken account depending on the Timeframe.
It is important to remember and be aware that the current chart’s Timeframe will heavily impact the plotted Time Cycles. This tool is in its initial form and it will be improved and adapted as traders start using it on a daily basis.
> Tool Settings
Plot Settings:
"Plot Type" will allow you to decide how the Cycles will be displayed. Out of the box the tool will be plotted on a separate pane, at the bottom of the chart; you can decide the orientation of the cycles from longest cycle at the bottom (Bottom Pane), or top (Top Pane). Alternatively you can move the tool to the chart and have the cycles plot on price (Move To -> Existing Pane Above), specifically above price (Top), or below (Bottom). The cycles will auto adjust their position based on the visible price action.
"Historical Cycles" will show previous Historical Cycles, up to where available in terms of script memory.
"Plot Size" will allow you to vary the height of the Cycle’s boxes
"Show Labels" will give you an auto-adapting legend which will help you determine which Cycle is which if you get lost.
The remaining Settings are self explanatory, allowing you to change colors, and choose which Cycles to see.
The source of the code is hidden due to the use of private libraries of mine. Happy to answer any questions in terms of code, where I will not be able to divulge any detail that concerns said libraries. Thank you for understanding!
Major thanks to Daye for his Time and Knowledge, it was a pleasure to collaborate and work together on this tool.
GLGT!

Daye @joshuuuThis indicator is based on Dayes studies about 90minute cycles and true opens.
Similar to how ICT teaches the true day open at 0.00, Daye came up with his true year, true month, true week and true session opens.
True Year - April 1st
True Month - 2nd Monday
True Week - Monday, 6pm
True Day - 12am (Midnight)
True Session - 1:30am (London), 7:30am (New York), 1:30pm (Afternoon)
Ideally, for a bearish scenario, we would like to see price trade above the opening price to then reverse and trade lower.
Ideally, for a bullish scenario, we would like to see price trade below the opening price to then reverse and trade higher.
The moves into the opposite direction are used my smart money to accumulate their positions and trap traders into wrong positions.
This indicator also shows 90 minutes cycles.
90min Cycle Cheat Sheet:
Q1. (A)ccumulation - Consolidation
Q2. (M)anipulation - Judas Swing (Trade this)
Q3. (D)istribution - LRLR (Trade this)
Q4. (X) - Continuation/Reversal of previous q.
Or
Q1. (X) - Continuation/Reversal of previous q.
Q2. (A)ccumulation - Consolidation
Q3. (M)anipulation - Judas Swing (Trade this)
Q4. (D)istribution - LRLR (Trade this)
This shows that if q1 consolidates and q2 takes out one side and reverses we anticipate q3 to have a strong move.
however, if q2 consolidates, we anticipate q3 to take out one side, reverse and then have a strong move in q4.
