The Trader's Edge (A professional Trader's tool)This is a script which is made by a professional stock trader and this script is capable of drawing Demand / Supply zones as well as capable of scoring the trade as well depending upon freshness, time spent in the zone, it also has the power to calculate the pre - defined risk to reward for every trade that you take as per this indicator. This script also displays the Trendo f the stock on 3 difrerent time frames on one single time frame easy to do multiple time frame analysis. and it also as the power of identifying which zones are falling outside "THE BOLLINGER BANDS" There by signaling an "ALL STAR ENTRY" This tool is A must have for any professional Stock trader.
Индикатор зоны спроса

Liquidity Mix- Supply and DemandLiquidity Mix highlights developing and confirmed supply/demand zones and optional trade guides with entries, stops, targets, and risk/reward math. Benefits: see high-probability reaction areas early, size positions automatically from your risk input, track reward multiples, and receive optional alerts when price tags zones or entries—all in one overlay.

Hidden Zone Detector AI - Crypto/Forex/StockHidden Zone Detector AI - Crypto Forex Stock
Hidden Zone Detector AI is a professional TradingView indicator designed to find hidden supply and demand zones across markets — crypto, forex and stocks — and surface high-probability areas earlier than classical pivot-only methods. It combines price structure analysis, volatility/ATR sizing, volume profiling and multi-mode AI heuristics (Fast / Balanced / Accurate) to generate prediction zones, highlight tested areas, and visually mark zone breakouts. Built with practical trader workflow in mind: configurable anti-repaint options, adaptable Light/Dark UI, clear labels, and candle-coloring for immediate visual context.
How it works
• Detects hidden zones by scanning pivot formations and finding internal “hidden” bars that represent real institutional activity (not just visible swing points).
• Scores zones by size (ATR-relative), volume, and touch characteristics to produce a strength percentage (Weak/Medium/Strong).
• AI heuristics aggregate price, momentum, moving averages, RSI/MACD signals and volume patterns to propose prediction zones — adjustable for speed vs. accuracy.
• Zones are drawn as persistent boxes with optional midlines, labels, and tailored styling when broken or tested.
Main advantages
• Early edge: finds hidden zones that often act before obvious pivots.
• Actionable visuals: labeled zones, color-coded candles, and breakout styling speed decision-making.
• Flexible AI modes: choose Fast for responsiveness, Balanced for day-to-day use, or Accurate for stricter signals.
• Anti-repaint controls: require confirmed bars for predictions to improve signal reliability.
• Multi-market ready: tuned for crypto, forex and stock chart behavior.
• Light/Dark friendly: UI color handling ensures labels remain readable on any chart background.
• Open & reusable: released under Mozilla Public License 2.0 (MPL-2.0) — use and adapt freely with attribution.
Best practices & tips
• Start with Balanced mode and sensitivity ~5; increase sensitivity for earlier but noisier predictions.
• Use prediction confirmation (Require AI Prediction Confirmation) for lower repaint risk.
• Combine zone reads with higher-timeframe context and orderflow/volume tools for stronger entries.
• Adjust max active zones and opacity to keep charts clean on lower timeframes.
License & author
Mozilla Public License 2.0 (MPL-2.0).
Author: a_jabbaroff — created with care for the TradingView community and fellow traders.

Gold 1&5 Min Trading Strategy [TradingFinder] XAU Scalper Signal🔵 Introduction
Scalping in financial markets is based on immediate price reactions and precise analysis of price action behavior. In this trading approach, the trader must identify signals that originate directly from market structure, momentum shifts, candlestick formations, and the position of price relative to key zones.
Supply and demand areas serve as the primary regions of order concentration and form the foundation of scalping analysis, since they provide the most accurate representation of balance or imbalance between buyers and sellers as well as the active flow of liquidity in the market.
In demand zones, price reactions usually begin with the formation of reversal or continuation candlestick patterns. These patterns include structures such as Pin Bar, Engulfing, Doji, Failure, Rejection, and other forms of false breakout behavior, each of which can indicate a potential short term change in direction.
Liquidity plays a central role in these reactions, because price entering a demand zone typically coincides with the absorption of sell side liquidity and the restoration of order flow. This process often leads to rapid movements that are suitable for scalping. Therefore, combining candlestick confirmation with the location of price inside a supply or demand zone is one of the most reliable methods of identifying low risk scalping signals.
Demand zones include several structural variations, each representing a different form of liquidity behavior. One of the most well known examples is the order block, which is the final bearish candle before a strong bullish movement and indicates the presence of unfilled buy side interest.
Another important structure is the Fair Value Gap, which appears when a price void forms across three consecutive candles due to a lack of liquidity during the moment of displacement. The market often returns to this area to restore balance. Imbalance structures also represent one sided pressure in order flow where the market reacts later to correct these inefficiencies.
Breaker structure is another key element in demand analysis. A breaker is formed when an order block is violated and price returns to the same level after collecting liquidity, then continues in the opposite direction. This pattern often appears near liquidity based highs or lows and reflects a shift in the strength of market participants.
Together, order blocks, Fair Value Gaps, imbalances, and breakers form the core of demand analysis in price action and are widely used in precise scalping strategies due to their strong connection with liquidity and the high predictability of price reactions within them.
Bullish Setup :
Bearish Setup :
🔵 How to Use
This strategy is built on price action analysis, market reactions inside supply and demand zones, and confirmation through candlestick patterns. The first step is to identify key areas such as order blocks, Fair Value Gaps, imbalances, or breakers.
After these zones are located, price behavior within them is examined using candlestick structure and momentum direction. Entries are taken only when price reaches a validated zone, a clear sign of liquidity absorption or injection appears, and a confirming candlestick forms inside the zone.
This approach allows the trader to capture fast and precise entries during moments when the market is actively reacting to decision points.
🟣 Long Setup
In the buy setup, a valid demand zone must first be identified. This can be a bullish order block, an unfilled bullish Fair Value Gap, an imbalance at the lower part of structure, or a bullish breaker. When price enters this zone and shows signs of absorbing sell side liquidity, candlestick behavior must be examined.
Formation of reversal signals such as a Pin Bar with a long lower wick, bullish Engulfing, Rejection Candle, or a false breakout of the low, indicates a favorable shift in order flow. After receiving candlestick confirmation, a buy entry is taken within the same zone and the stop level is placed below the liquidity boundary. Targets are typically based on filling gaps, reaching supply zones, or returning to structural means.
🟣 Short Setup
In the sell setup, a valid supply zone must be recognized. This may include a bearish order block, a bearish Fair Value Gap, an imbalance at the upper part of structure, or a bearish breaker. When price enters this zone and liquidity accumulates above nearby highs, the probability of a fast momentum shift increases.
Confirmation occurs when a bearish reversal pattern forms such as Engulfing, Pin Bar with a long upper wick, indecisive Doji followed by rejection, or a false breakout of the high. After confirmation, the sell entry is placed and the stop level is set above the liquidity zone. Targets are selected based on filling lower Fair Value Gaps, reaching demand zones, or returning to structural midpoints.
🔵 Settings
Last Candle in Signal Direction : When On, a signal is issued only if the last candle moves in the direction required by the signal.
Signal in Nearly Zone : When enabled, the signal becomes valid even if the candle is near the zone rather than strictly inside it. When disabled, only signals formed inside the zone are allowed.
Allow Both Side Signals : When On, signals from both sides of the structure can be issued even if a limiting level exists. When disabled, only signals that do not violate the limiting level are allowed.
🔵 Conclusion
Using price action, supply and demand zones, and candlestick confirmation alongside liquidity analysis creates an effective framework for identifying fast market reactions in scalping conditions. Focusing on structures such as order blocks, Fair Value Gaps, imbalances, and breakers allows the trader to recognize shifts in momentum and changes in order flow with greater precision.
In this approach, entries are taken only when price reaches a validated zone, liquidity behavior is observable, and the confirming candle forms at the correct location. This leads to organized, low risk scalping signals that are aligned with the real time behavior of the market.

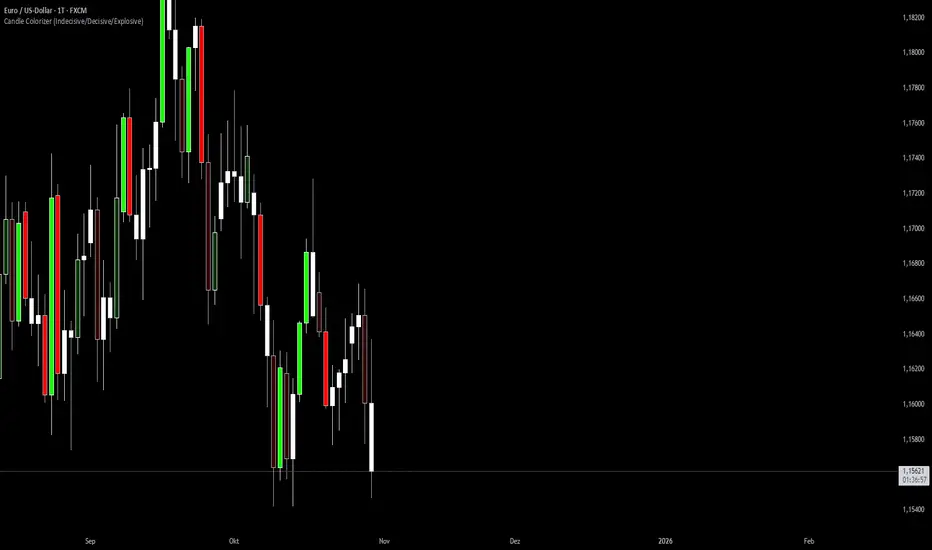
Candle Colorizer (Indecisive/Decisive/Explosive)Classifiaction of candles in indecisive/decisive/explosiv to more quickly identify supply and demand zones
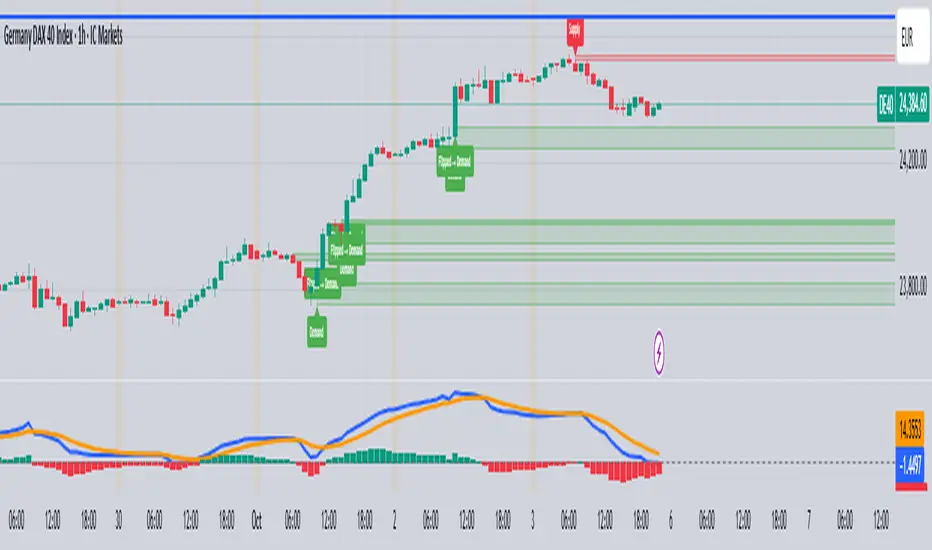
HTF Supply & Demand Zones 📊 Overview
Advanced supply and demand zone indicator that automatically detects institutional-level price zones on higher timeframes and dynamically adapts zone colors based on price position. Zones below price act as demand (support) and zones above price act as supply (resistance).
✨ Key Features
🎯 Dynamic Zone Recognition
- Smart Color Adaptation: Zones automatically change from demand (green) to supply (red) when price crosses them
- Higher Timeframe Analysis: Detect zones from any timeframe while trading on lower timeframes
- Base/Blast Pattern Detection**: Identifies strong institutional zones using base-blast candle methodology
- Automatic Zone Flipping: Broken demand zones become supply and vice versa
📈 Zone Detection Method
Uses the proven Base & Blast candle pattern:
- Base Candle: Small consolidation candle with minimal wick
- Blast Candle: Strong momentum candle breaking from the base
- Customizable Ratio: Adjust base/blast body size ratio (default 8:1)
- Wick Filter: Ensures clean base candles for higher probability zones
🎨 Visual Features
- Clean Zone Boxes: Extended zones with customizable colors and transparency
- Smart Labels: Display zone type and touch count
- Touch Counter: Track how many times price has tested each zone
- Info Dashboard: Real-time statistics in top-right corner
⚙️ Zone Management
- Auto-Delete After X Touches**: Remove zones after specified number of tests (default: 5)
- Optional Break Deletion**: Choose whether to delete zones when price breaks through
- Maximum Zone Limit**: Control chart cleanliness by limiting displayed zones
- Extended Zones**: All zones extend to the right for forward visibility
🔧 Settings
Detection Parameters
- Higher Timeframe: Select any timeframe for zone detection (empty = current timeframe)
- Base/Blast Ratio: 4.0 to 30.0 (default: 8.0) - Higher = stronger zones, fewer signals
- Wick Threshold: 0.1 to 0.5 (default: 0.3) - Maximum base candle wick size
Display Options
- Toggle demand/supply zones independently
- Maximum zones to display (1-50)
- Show/hide zone labels
- Customizable colors for demand and supply zones
- Adjustable border width
Zone Management
- Delete after X touches (1-30 touches)
- Delete on break option
- Touch counter displays current/max touches
💡 How to Use
For Swing Trading
1. Set timeframe to Daily or Weekly
2. Use 8:1 ratio for high-quality zones
3. Enable auto-delete after 3-5 touches
4. Trade pullbacks to green zones (demand) for longs
5. Trade rallies to red zones (supply) for shorts
For Day Trading
1. Set timeframe to 1H or 4H
2. Use 6:1 ratio for more zones
3. Watch for zone color changes as confirmation
4. Enter when price retests zones in the direction of the higher timeframe trend
For Scalping
1. Set timeframe to 15m or 1H
2. Use 5:1 ratio for frequent signals
3. Focus on first touch of fresh zones
4. Use lower timeframes for precise entries
📋 Best Practices
✅ DO:
- Use zones from higher timeframes for better reliability
- Wait for zone color change as confirmation of flip
- Focus on first 2-3 touches of a zone
- Combine with trend analysis
- Use zones as targets and entry levels
❌ DON'T:
- Trade every zone - quality over quantity
- Ignore the touch counter
- Use on very low timeframes without HTF context
- Trade zones that have been tested many times
🎓 Understanding Dynamic Colors
Green Zones (Demand) = Below current price = Support = Look for bounces
Red Zones (Supply) = Above current price = Resistance = Look for rejections
When price breaks a green zone downward, it flips to red (former support becomes resistance)
When price breaks a red zone upward, it flips to green (former resistance becomes support)
📊 Info Dashboard
The top-right table displays:
- Active timeframe
- Current demand zones count (below price)
- Current supply zones count (above price)
- Active base/blast ratio
- Maximum touches setting
🔔 Trading Signals
High Probability Setups:
- Fresh zones (0-1 touches) on higher timeframes
- Zones that align with major support/resistance
- First test after a zone color flip
- Multiple timeframe confluence
Avoid:
- Zones with 4+ touches
- Zones in choppy/ranging markets
- Counter-trend zones during strong momentum
⚡ Performance Notes
- Maximum 500 boxes and lines supported
- Optimized for real-time scanning
- Minimal resource usage
- No repainting - all zones are confirmed
🎯 Recommended Settings by Trading Style
Conservative (Higher Quality)
- Ratio: 10:1
- Wick Threshold: 0.2
- Delete After: 3 touches
Balanced (Default)
- Ratio: 8:1
- Wick Threshold: 0.3
- Delete After: 5 touches
Aggressive (More Signals)
- Ratio: 6:1
- Wick Threshold: 0.4
- Delete After: 7 touches
---
📖 Additional Resources
For more information on supply and demand trading:
- Study institutional order flow
- Learn base and blast candle patterns
- Understand market structure and liquidity zones
- Practice on demo before live trading
Risk Warning: This indicator is a tool for technical analysis. Always use proper risk management and combine with your trading strategy. Past performance does not guarantee future results.
---
Compatible with all markets: Forex, Stocks, Crypto, Futures, and Indices
Version: 1.0 | Language: Pine Script v5

Demand Supply Zones with MTFDemand Supply Zones with Multi-Timeframe Analysis
Overview:
Advanced institutional demand/supply zone detector with multi-timeframe analysis, proximity alerts, and trend dashboards. Identifies high-probability reversal areas using intelligent base detection and breakout validation across 4 simultaneous timeframes.
Core Unique Features:
• 💎 Elite Base Factor: Auto-detects institutional base patterns using pre-breakout candle body ratio analysis (adjustable 0.1-2.0).
• 🌐 4-Timeframe Zone Detection: Simultaneous MTF zones with individual "👁️ Tested" toggles for granular control - unprecedented in demand/supply indicators.
• 🚨 Proximity Dashboard: Real-time distance tracking to nearest zones (current + all MTF). Visual "APPROACHING!" alerts when price within threshold %.
• 📊 Zone Analytics Dashboard: Live counters for active/tested zones per timeframe with date range display and MTF status tracking.
• 📈 Multi-Timeframe Trend Analysis: 4-TF trend direction
• 🎯 Advanced EMA System: 10 multi-timeframe EMA-20 lines + Golden/Death Cross alerts with customizable styling.
• 📅 Date Range Filter: Performance optimization with calendar-based zone limits (10-500 zones).
• 🧩 Gap Filling: Optional gap bridging between base and leg-out candles for continuous zones.
• 🔐 No Repainting: MTF zones created only on confirmed bars with lookahead bias disabled.
How It Works:
1. Base Detection: Identifies consolidation candles (1-4 consecutive) with customizable body % threshold. Elite mode auto-detects when pre-breakout candle is significantly smaller.
2. Leg-Out Validation: Confirms breakout strength of legout
3. Zone Extension: Projects zones forward (10-500 bars).Fresh zones (green/red) turn gray when tested.
4. MTF Integration: Detects zones from 4 higher timeframes with independent parameters. Each MTF has individual tested zone toggle.
5. Analytics: Proximity dashboard calculates real-time distance to nearest zones. Trend dashboard shows direction across 4 TFs.
Important Notes:
• Educational Purpose: This indicator is for analysis and learning only. Does not guarantee future results.
• Risk Management Required: Always use stop losses and proper position sizing.
• Chart Type: Use standard Candlestick charts. Non-standard charts (Heikin Ashi/Renko) not recommended for accurate zone detection.
• Timeframe Requirements: MTF zones appear only when viewing lower timeframe than selected MTF (e.g., view 1H chart to see Daily MTF zones).
• Performance: Enable Date Range Filter when using multiple MTF timeframes to reduce computational load.
• Past Performance Disclaimer: Historical accuracy does not guarantee future trading results.
⭐ If you find this indicator valuable, please like and share!

SD Demand & Supply IndicatorSD Demand & Supply Indicator automatically identifies and displays demand and supply zones across multiple timeframes.
The indicator detects:
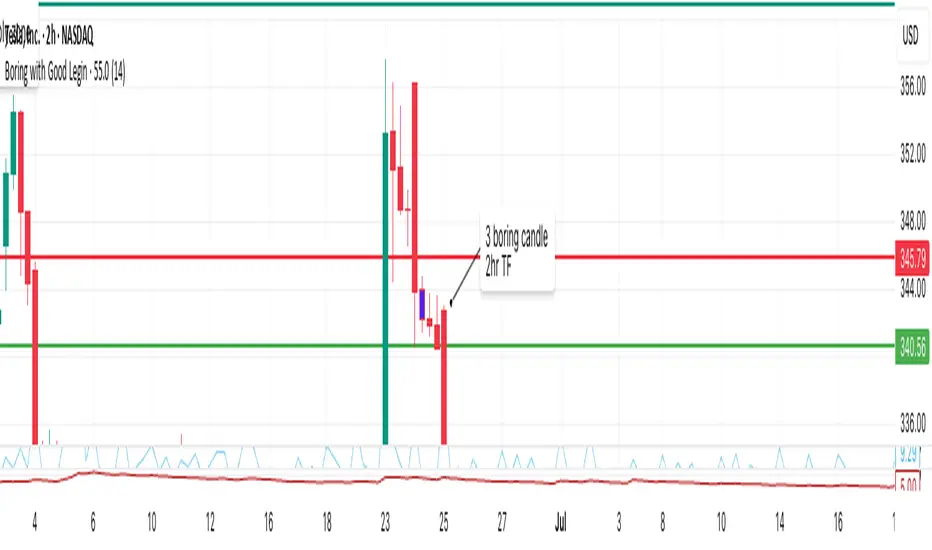
Demand Zones: Drop–Boring–Rally (DBR) and Rally–Boring–Rally (RBR) formations
Supply Zones: Rally–Boring–Drop (RBR) and Drop–Boring–Drop (DBD) formations
When a Demand Zone is detected, it plots a blue Label below the relevant boring candle. When a Supply Zone is detected, it plots a red Label above the relevant boring candle — making it easy to visualize potential reversal areas.
With built-in alert functionality, you can also set alerts on your preferred symbols and timeframes to get instant notifications whenever new Demand or Supply Zones are formed.
How the Script Works?
1. The script scans the price action of three to five consecutive candles to identify potential Demand and Supply patterns based on the open, High, Low and close prices.
2. The script evaluates every candle’s price movement based on set conditions to confirm a valid demand or supply pattern.
3. For demand cases, the script recognizes specific formations such as Drop– Boring –Rally (DBR) and Rally– Boring –Rally (RBR), which indicate potential buying zones.
4. For supply cases, it identifies Rally– Boring –Drop (RBD) and Drop– Boring –Drop (DBD) structures, indicate potential selling zones.
5. When a valid Demand Zone is detected, the script plots a Blue label below the relevant Boring candle.
6. When a valid Supply Zone is found, it plots a Red label above the relevant Boring candle.
7. The script includes an alert feature that notifies users in real-time whenever a valid demand or supply pattern is formed, allowing timely action
How Users can get benefited using this Script?
1. The labels and text plotted by the script help traders visually identify potential entry and exit points.
2. When a valid Demand Zone is detected and the price revisits it, it may indicate a potential bullish reversal.
3. When a valid Supply Zone is detected and the price revisits it, it may indicate a potential bearish reversal.
4. Users can integrate this script with other indicators, fundamental data, or sentiment analysis to confirm signals and make more informed decisions.
5. Traders should use proper risk management strategies, including stop-loss orders to limit losses and targets when the trade moves in their favor.
Settings Explained
1. Boring & Legin Ratio
This is the ratio between the Legin candle and the Boring candle.
A default value of 2 means the Legin candle size (High–Low) is twice the size (High–Low) of the Boring candle.
2. Leg-In & Leg-Out Ratio
This is the ratio of Legin candle and Legout candle.
A default value 2 means the Legout candle size (High-Low) is twice the size (High-Low) of the Legin candle.
3. Leg-In & Three-Leg-Out Ratio
This is the ratio of Legin candle and to the combined size of three Legout candles. A default value 2 means the overall size of the three Legout candles is twice that of the Legin candle.
4. Leg-In Body to Wick Ratio
It is the ratio between the body size of a candle and its total wick length.
A default value of 0.6 means that 60% of the total candle length should be the body.
Zone Selection Filters
1. All Possible Zones
Displays all types of zones, including with or without Clear Area and with or without True Range (TR) vs Average True Range (ATR) criteria
2. All Zones with TR Vs ATR
Shows all zones but with True Range (TR) vs Average True Range (ATR) criteria.
3. Clear Area Zone Only
It will show the Zone with Clear Area and either with or without TR Vs ATR compliance
Clear Area Zone – is considered when the body of the Legout candle does not overlap the Boring candle. In other words, the right side of the Boring candle area remains completely free
4. Clear Area Zone with TR vs ATR Compliance
It will show the Zone with Clear Area and with TR Vs ATR compliance
Note: No. 1 and 2 is suitable for Forex, and crypto market segment
No. 3 and 4 is suitable for commodity and stock market segment
What is TR Vs ATR Criteria?
TR (True Range) vs ATR (Average True Range) criteria is used to validate the strength of a Demand or Supply Zone and it is very important criteria.
For Legin Candle (first candle of the pattern from left) — TR value should be greater than the ATR value.
For Boring Candle (second candle of the pattern from left) — TR value should be smaller than the ATR value.
For Legout Candle (third ,fourth & fifth candle of the pattern from left) — TR value should again be greater than the ATR value,
Important:
Due to the high calculation effort, the history is limited to maximum 10 Zones in total. All zones prior to that will not be displayed so that chart remain clear. Once our indicator has started displaying a Zone, then zone will be visible until it exceeds maximum 10 Zone history. This indicator does not repaint. All signals remain fixed once a candle closes.
What Makes this Indicator Unique?
The Smart Dude Indicator stands out because it doesn’t just mark Demand and Supply Zones — it qualifies them using advanced candle behavior and volatility analysis by using TR Vs ATR analysis .
Unlike typical zone indicators that rely only on price structure, Smart Dude combines candle-to-candle ratio logic with TR vs ATR criteria
Why traders use this indicator?
This strategy is already being used by many experienced traders, including some of my close trading associates. They’ve seen results and even encouraged me to publish it so that more traders can benefit from it. The indicator combines key elements like candle ratio and TR vs ATR criteria, giving users a structured and reliable way to identify zones.
How this Indicator Is Original?
The Smart Dude Indicator is a fully original work — designed and coded from scratch with a unique logic structure.
It is not copied or derived from any existing open-source script.
Key points that make it unique and original:
Exclusive Candle Ratio Logic
TR vs ATR Integration
Clear Area Detection
Fully Hand-Written Logic
Every condition — from candle identification to ratio calculation and plotting — has been manually coded line by line without importing or modifying any existing public logic.
Disclaimer:
This indicator is only for educational purposes and that highlights potential market opportunities. It should not be treated as financial or investment advice.
Trading in financial markets involves risk. The indicator is designed to assist you in making more informed decisions but outcomes depend on your due intelligence and zone validation skills

Khosro XAUUSD Strategy [TradingFinder] Trading Room Hunter Setup🔵 Introduction
The Trading Room Hunter (TRH) strategy is an analytical model based on the Smart Money Concept, developed by Khosro, an Iranian international trader based in Dubai. This approach is built upon a deep understanding of liquidity engineering, market structure shifts, and institutional order flow. Its core objective is to identify the so-called TRH Zone, the area where market liquidity gets trapped and institutional investors begin accumulating positions. Unlike traditional indicator-based methods, the TRH Zone focuses purely on price behavior and supply & demand dynamics to pinpoint the most precise reversal zones in the market.
Within Smart Money logic, every impulsive move in price results from the displacement or absorption of liquidity in a specific range. In the TRH model, the last pivot preceding the impulsive move (Origin Pivot) is defined as the Distal Line, and the Break Candle, which disrupts the market structure, forms the Proximal Line. The area between these two points defines the Trading Room Hunter Zone, a reaction zone where price, after creating a displacement or Break of Structure (BoS), often returns to fill an imbalance and provide a precision entry opportunity.
In essence, the TRH Zone is the region where smart money seeks re-entry after a liquidity sweep and a confirmed CHoCH or BoS. It frequently lies between supply/demand boundaries and fair value gaps (FVGs), forming one of the strongest decision-making frameworks within modern price-action theory. Due to its structural accuracy, the TRH setup can also function as a Set & Forget Setup, where the trader defines the zone, places a limit order, and lets the market naturally react, eliminating emotional decision-making and allowing for automated execution aligned with institutional logic.
🔵 How to Use
In the TRH strategy, entries are taken based on price returning to the area between the last impulsive pivot and the break candle. This range (the TRH Zone) represents the region where liquidity from the previous move remains concentrated. Before continuing its main direction, price often revisits this zone to fill imbalances or mitigate unfilled orders. The logic is simple: every explosive move originates from a point where large orders were executed, and TRH precisely highlights that institutional footprint.
🟣 Bullish Setup
When the market breaks a structural high after a strong bearish leg, liquidity shifts from sellers to buyers. The last bearish candle before the breakout marks the origin of the bullish move, and the zone between that candle and the break candle becomes the smart-money entry area. As price revisits this zone and signs of exhaustion in selling pressure appear, that’s the optimal point for a long position. Stop-loss is placed slightly below the origin pivot, and targets are set at the next supply zone or upper liquidity pool.
🟣 Bearish Setup
Conversely, when the market breaks a structural low after a sharp bullish leg, liquidity transitions from buyers to sellers. The last bullish candle before the drop is identified as the origin pivot, while the bearish break candle defines the lower boundary of the zone. The range between these two points forms the TRH Supply Zone, where late buyers are trapped and fresh institutional selling begins. As price retraces into this zone, short entries can be placed near the upper boundary, with stops above the pivot and targets toward the next liquidity pool below.
Because of its structural precision and clearly defined reaction behavior, TRH is one of the most effective Set & Forget setups in Smart Money trading. Simply mark the zone, place your order, and let the market do the rest.
🔵Setting
🟣 Spike Filter | Movement
Minimum Spike Bars : Defines the minimum number of consecutive candles required for a valid spike.
Movement Power : Enables or disables the momentum-based spike filter.
Movement Power Level : Sets the strength threshold; higher values filter out weaker moves and only detect strong spikes.
Pivot Period : Defines the lookback range used to detect swing highs and swing lows in market structure. A higher value smooths out smaller fluctuations and focuses on major pivots, while a lower value increases sensitivity and identifies minor turning points more frequently.
🟣 Position Management
Stop-Loss Threshold : Enables or disables the stop-loss threshold feature.
Stop-Loss Threshold Value : Defines the value of the stop-loss threshold for risk management.
Risk-Reward Ratio : Sets the desired risk-to-reward ratio (e.g., 1:1 or 1:2).
Wide Zone Filter : Filters out zones that exceed a defined width threshold, preventing detection of overly broad TRH areas.
🟣 Display Settings
Display Mode : Chooses between Setup (showing setups) or Signal (showing trade signals).
Show Entry Levels : Displays entry levels on the chart (buy/sell zones) when enabled
Only Display the Last Position : Displays only the most recent position on the chart when enabled.
Setup Width Drawing : Adjusts the visual width of the setup drawings on the chart for better visibility.
🔵 Conclusion
The TRH strategy is a precise structural model of liquidity flow that identifies zones where smart money is most likely to enter and where price is most likely to react. By combining the Origin Pivot and Break Candle, TRH isolates the key areas that drive institutional order flow. Without relying on indicators, it focuses purely on price structure, making it highly effective for both reactive entries and Set & Forget setups.
Ultimately, TRH creates a balance between market structure and liquidity flow, enabling traders to identify institutional decision zones on the chart with minimal risk and maximum clarity

Two-Part Supply & Demand Zones with Role ReversalWill show demand and supply with boxes
Once a zone is used it will be removed to keep the chart clean
Odds Enhancer: Volume + RSI DivHow it Works: This flags potential demand zones where price hits a 20-bar low with a volume spike and bullish RSI divergence. Customize for supply zones by flipping logic.

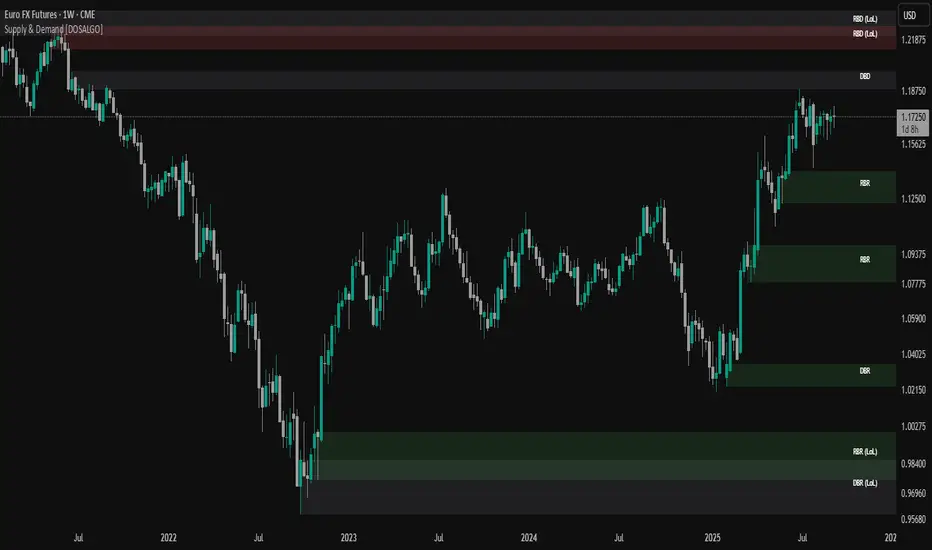
Supply & Demand Limited [DOSALGO]The Supply & Demand Limited indicator is a powerful tool designed to automatically identify and plot significant supply and demand zones on your chart. Based on the core principles of price action, this indicator pinpoints areas where buying or selling pressure has historically been strong enough to cause a substantial shift in the market. By visualizing these key institutional levels, traders can gain a clearer perspective on potential turning points, support/resistance areas, and high-probability trade setups.
This "Limited" version is specifically optimized for higher timeframe analysis and will function exclusively on Daily and Weekly charts, helping traders focus on the most significant market structure.
Key Features
Automatic Zone Detection: The indicator's internal calculation method scans the price action to detect valid supply and demand zones, saving you the time and effort of manual charting.
Identifies Key Patterns: It recognizes classic supply and demand patterns, including Rally-Base-Drop (RBD), Drop-Base-Rally (DBR), and continuation patterns like Rally-Base-Rally (RBR) and Drop-Base-Drop (DBD).
Dynamic Zone Interaction: Zones are not static. The indicator tracks price interaction, changing a zone's color once it has been touched. It can also automatically remove zones that have been significantly penetrated, keeping your chart clean and relevant.
"Level on Level" (LoL) Detection: A unique feature that identifies when new zones form within or overlapping existing ones. These "stacked" zones can often indicate particularly strong areas of confluence.
Built-in Alerts: Never miss an opportunity. Set up custom alerts to notify you the moment a new supply or demand zone is formed or when the price touches an existing zone.
Fully Customizable: Tailor the indicator to your exact trading style with extensive customization options. Adjust everything from the zone definition and colors to the number of zones displayed on your chart.
How to Use This Indicator
The primary goal of this indicator is to highlight potential areas where the market may reverse or pause.
Identify Potential Reversal Points: A supply zone (red) above the current price may act as resistance, presenting a potential area for short entries. A demand zone (green) below the current price may act as support, offering a potential area for long entries.
Confirm with Other Tools: For best results, use these zones in conjunction with your existing trading strategy. Confirm signals with other indicators, trend analysis, or fundamental factors to increase confidence.
Set Stop-Loss and Take-Profit: The boundaries of the zones can serve as logical guides for placing stop-loss orders (e.g., just above a supply zone or just below a demand zone) and for setting profit targets.
Settings Explained
Zone Definition
Show "Level on Level" (LoL) Labels: Toggles the "(LoL)" text on zones that are stacked on top of each other.
Include Continuation Patterns?: Choose whether to display only reversal patterns (RBD, DBR) or also include continuation patterns (RBR, DBD).
Zone Type: Select how zones are drawn.
Wider: Uses the full high/low of the base candles for a larger zone.
Preferred: Uses a more precise calculation to define the zone, often resulting in a tighter, more refined area.
Max Base Candles in Zone: Sets the maximum number of consolidation (base) candles allowed for a valid zone to be formed.
Zone Display & Limits
Limit Supply/Demand Zones: Toggle on or off to limit the number of zones displayed.
Max Supply/Demand Zones: When the limit is on, this sets the maximum number of the most relevant supply or demand zones to show on the chart.
Zone Interaction
Delete Zone on Deep Wick Penetration?: If enabled, the indicator will automatically remove a zone from the chart if the price penetrates it by a significant amount.
Remove Tested Zone %: Defines how much the price must penetrate a zone (as a percentage of the zone's height) to be considered "deep" and trigger its removal.
Colors & Style
Full customization over the colors for fresh and touched supply and demand zones, as well as the appearance of the zone labels.
Alerts
Alert on New Zone Creation?: Enable to receive an alert when a new zone is confirmed.
Alert on Zone Touch?: Enable to receive an alert when the price first enters an existing zone.
Disclaimer: This indicator is a tool for technical analysis and should not be considered financial advice. All trading involves risk. Always conduct your own research and analysis before making any trading decisions. Past performance is not indicative of future results.

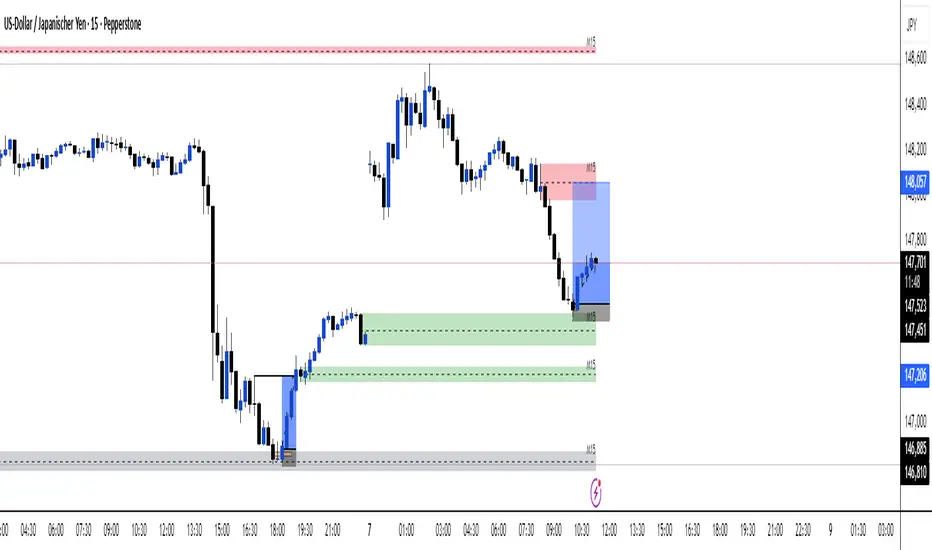
Supply Zone & Demand M15Supply Zone & Demand M15
This indicator automatically detects and plots supply and demand zones based on 15-minute pivots and impulse strength.
🔎 Features
Multi-timeframe visibility: Zones are detected on M15 pivots but can be viewed on any lower timeframe (M1, M5, etc.).
Zone validation: Zones appear only after a strong impulsive move, measured against ATR.
Retest counting: Each time price retests a zone, a counter is displayed.
Retests can be merged by time window (No merge, 30 minutes, or 1 hour).
Zone merging: Nearby overlapping zones are automatically combined with a tolerance setting.
Configurable display: Choose between immediate display of zones or only after N retests.
Customizable style: Full control over colors, extension to the left, and max number of zones kept.
⚙️ Settings
Pivot strength: Minimum bars for swing highs/lows.
Impulse filter: Require ATR-based momentum before validating a zone.
Zone width: Defined as a multiple of ATR.
Retest merge: Select None, 30 minutes, or 1 hour.
Invalidation: Option to remove zones once broken.
Display mode: Show zones immediately or only after the required number of retests.
✅ Use Cases
Identify high-probability reversal areas.
Track how many times a zone has been retested.
Spot confluence when historical zones align with current price action.
⚠️ Disclaimer: This indicator is a technical tool, not financial advice. Always combine with proper risk management.

Demand & Supply by DaoEADemand & Supply by DaoEA
This indicator is designed to help traders identify key demand and supply zones, displaying strong price action patterns such as Pin Bar, Engulfing, Hammer, and Shooting Star to confirm reversal points.
Key Features
Automatically identifies Supply & Demand Zones and extends them to the right.
Displays Break of Structure (BOS) when prices break out of these zones.
Tracks Swing Highs/Lows and analyzes HH, HL, LH, and LL.
Highlights strong price action patterns such as Bullish/Bearish Pin Bars, Engulfing, Hammer, and Shooting Star.
Customizable zones, colors, and labels.
Overlay zone protection. To avoid over-cluttering the chart,
Usage
Use with higher timeframes (H1 and above) to identify high demand and supply points.
Switch to smaller timeframes (M15–M30) to identify entry and exit opportunities.
Wait for a strong BOS + PA to confirm the signal.
Suitable for scalpers, swing traders, and Smart Money Concept (SMC) traders who want to clearly understand market structure.

3CRGANG - SUPPLY/DEMAND ZONESOverview
The "3CRGANG - SUPPLY/DEMAND ZONES" indicator is a sophisticated tool designed to identify, classify, and visualize dynamic supply (resistance) and demand (support) zones on your TradingView charts. It goes beyond basic level plotting by incorporating a state-based system that tracks how zones evolve based on price interactions, helping traders anticipate potential reversals, continuations, or breakdowns at key levels. Zones are categorized into states like Untested, Verified, Weak, Flipped, and Broken, providing contextual insights into their strength and reliability. This indicator is particularly useful for swing traders, scalpers, and position traders who rely on price action around institutional levels, as it filters noise and highlights actionable zones with customizable alerts and visual aids.
Built on Pine Script v6, it overlays directly on your chart with semi-transparent boxes for zones, optional labels for quick reference, and alert triggers for zone tests. The invite-only access ensures users benefit from its proprietary enhancements, making it a premium alternative to generic zone indicators.
How It's Built: Core Concepts and Calculations
At its foundation, the indicator detects potential supply and demand zones using a fractal-based pivot detection method, which identifies local highs and lows by comparing a central bar's price to surrounding bars within a validation window. This window is dynamically adjusted via a "Fractal Sensitivity Factor" (default 6.0), which scales the lookback period relative to your chart's timeframe—ensuring zones adapt to market volatility without over- or under-fitting. For example, on a 15-minute chart, this might equate to checking 18-24 bars around a candidate pivot for confirmation.
Once a fractal pivot is confirmed:
Zone Boundaries: The zone is constructed around the pivot high/low, extended by a fraction of the Average True Range (ATR, period 7) using the "Zone Boundary ATR Multiplier" (default 0.3). This creates a band that accounts for typical price fluctuations, preventing overly tight or loose zones. A subtle "Zone Fuzz Factor" (default 0.15) adds a minor buffer to the ATR-derived extension, allowing for fine-tuning in choppy markets without altering the core range.
Merging Overlaps: To avoid clutter, overlapping zones of the same type (or flipped counterparts) are intelligently merged through up to 2-3 passes (configurable via "Max Merge Passes"). This consolidation increases the "test count" for the resulting zone, reflecting cumulative price rejections and enhancing its perceived strength.
Zone Testing and Classification: Price interactions with zones are evaluated using one of two methods:
Dynamic - Bars: Counts tests when price wicks into the zone from outside or closes out after entering, with a minimum gap (0-2 bars) to prevent rapid-fire counts in ranging markets.
Mechanical - Pivots: Enhances the dynamic method by requiring a mechanical pivot (e.g., via TradingView's built-in pivothigh/pivotlow) within the zone during the test, adding a layer of confirmation for more conservative signals. Tests are tallied with a "Weak Zone Test Threshold" (default 1), classifying zones as:
Untested: No interactions yet—fresh levels with high potential.
Weak: 1 or fewer meaningful tests—early signals that may fade.
Verified: Multiple tests (above threshold)—strong, repeatedly respected levels.
Flipped: A broken zone that reverses role (e.g., resistance becomes support), based on a decisive close beyond the boundary.
Broken: Permanently invalidated by a strong breakout, optionally displayed for historical context.
Time and Session Integration: Zones are timestamped and limited to a "Back Limit" (default 500 bars) for performance. It incorporates a custom holiday library (importing from RotemB's LIBRARY_3CRGANG_Holidays_Library) to detect closures across major exchanges (NYSE, LSE, FSE, SSX, TSE, HKSE), adjusting session times for half-days and full holidays. Alerts are filtered by user-selected sessions, weekends, and a "Do Not Disturb" (DND) mode with timezone-aware scheduling (e.g., UTC+3 Jerusalem default, selectable from 90+ global options).
This combination of fractal detection, ATR-based sizing, multi-pass merging, and test-driven state evolution draws from classic supply/demand principles but refines them with proprietary logic to handle real-world market dynamics, such as volatility clustering and institutional session biases.
Why It’s Useful
Supply and demand zones are foundational to price action trading, representing areas where large orders accumulate and cause reversals or pauses. This indicator streamlines the process by automating zone discovery and maintenance, saving time compared to manual drawing. Its state system adds predictive value: Verified zones often signal high-probability bounces, while Flipped ones highlight role reversals for trend continuation trades. Alerts notify you of tests in real-time, ideal for multi-chart monitoring, and session/holiday filters reduce false signals during low-liquidity periods (e.g., no alerts on Christmas for NYSE-linked assets).
Traders benefit from reduced emotional bias—zones "age out" beyond the back limit, focusing on recent action—and customizable visuals prevent chart overload. In volatile markets like forex or crypto, the ATR-adjusted boundaries adapt better than fixed-percentage methods, while the test count helps gauge exhaustion (e.g., over-tested Weak zones may signal impending breaks). Overall, it enhances decision-making by providing not just levels, but their evolving context.
How to Use It
Add to Chart:
Search for "3CRGANG - SUPPLY/DEMAND ZONES" in TradingView's invite-only scripts (access required). Apply to any timeframe from 1-minute to yearly, though it shines on intraday (15M-4H) for active trading.
Configure Inputs:
Test Mode: Choose "Dynamic - Bars" for sensitive, wick-focused testing or "Mechanical - Pivots" for stricter, pivot-confirmed interactions. Adjust "Minimum Test Gap" (0-2) to filter rapid tests and "Weak Zone Test Threshold" (1-3) to define strength tiers.
Pivot Filters: Tune "Fractal Sensitivity Factor" (5-14) for fewer/more zones—higher values for smoother trends, lower for chop.
Zone Width: Set "Zone Boundary ATR Multiplier" (0-1) for tighter/wider bands; use "Zone Fuzz Factor" (0-1) sparingly for boundary tweaks.
Visual: Select zone style (Solid/Dashed/Dotted), linewidth (1-3), and horizontal extension (None/Right/Both). Toggle visibility per state (e.g., hide Broken for cleaner charts).
Labels: Enable "Show Labels" for state/type info; add "Show Zone Size" (in pips/$) and "Show Test Count" for details. Adjust shift for positioning.
Alerts: Enable per state (Untested/Weak/Verified/Flipped). Filter by sessions (e.g., enable NYSE for US equities), holidays, weekends, and DND (set time ranges in your timezone to mute notifications).
Colors: Customize per state/type for intuitive visuals (e.g., red shades for resistance).
Trading Application:
Entries: Buy at Verified Demand (green) tests, sell at Verified Supply (red). Use Flipped zones for breakout confirmation.
Exits/Risk: Place stops beyond zone boundaries; trail profits on Weak/Flipped signals indicating fading strength.
Alerts Setup: In TradingView's alert dialog, select this indicator and configure for "alert() function calls only" to receive zone-test notifications.
Multi-Timeframe: View higher-TF zones on lower charts for confluence (e.g., daily zones on 1H).
Best Practices: Combine with volume or oscillators; backtest on your asset to optimize sensitivity.
Chart Example: XAG/USD (m5 timeframe)
Chart Notes
The chart displays zones on XAGUSD (M5 timeframe), presenting a clear price action structure with three distinct zones. A green Verified Support zone, marked with a translucent green box, indicates a robust demand level that has been tested multiple times and held firm. A blue Weak Support zone, outlined with a lighter blue box, reflects a less-tested support level with fewer rejections, suggesting lower reliability. A gold Flipped Resistance zone, highlighted with a golden box, initially acted as a resistance with rejections before breaking through and retesting as a support zone, showcasing its transition. Labels appear to the right of each zone, displaying details such as "VERIFIED SUPPORT (6.72 points, T=3)" for the Verified zone, "WEAK SUPPORT (6.9 points, T=1)" for the Weak zone, and "FLIPPED SUPPORT (3.85 points, T=10)" for the Flipped zone, with sizes in dollars (or pips if under $1) and test counts included. Zones extend horizontally to the right based on the user-defined shift setting, with customizable dashed or dotted borders for enhanced visual clarity.
Requires 500 bars of history for optimal performance. Alerts are muted during holidays (e.g., Lunar New Year) or Do Not Disturb periods.
Settings
Test Mode: Choose method (Dynamic - Bars or Mechanical - Pivots), set minimum test gap (0-2 bars), and weak zone threshold (1-3 tests).
General: Adjust back limit (250-1000 bars).
Pivot Filters: Set fractal sensitivity factor (5-14) and max merge passes (1-3).
Zone Width: Define ATR multiplier (0-1) and fuzz factor (0-1).
Visual: Select zone style (Solid, Dashed, Dotted), line width (1-3), shift end right (1-50 bars), and extension (None, Right, Both).
Visibility: Toggle display for each state (Untested, Verified, Weak, Flipped, Broken).
Labels: Enable labels, set shift (1-50 bars), size, and show size/test counts.
Alerts: Enable alerts by state (Untested, Weak, Verified, Flipped).
DND Settings: Set timezone, Do Not Disturb hours, and weekend alerts.
Sessions Alerts: Filter alerts by exchange (NYSE, LSE, etc.) and holiday settings.
Colors: Assign colors to each zone state and type.
Why It's Unique and Worth Invite-Only Access
While supply/demand indicators exist, this one stands out through its integrated ecosystem: adaptive fractal pivots with sensitivity scaling, multi-pass overlap merging that preserves test history, and a nuanced state machine that evolves zones based on configurable test mechanics—far beyond simple high/low plotting or basic breakouts. The proprietary blending of ATR fuzzing, retroactive test validation during zone creation, and global exchange holiday/session filtering (with half-day adjustments) minimizes irrelevant alerts, a common pain point in public scripts. It doesn't rely solely on built-ins or educational code; instead, it enhances them with custom logic for zone lifecycle management, making it resilient across assets and timeframes.
This originality justifies its closed-source nature—revealing the full interplay of fractal windowing, merge algorithms, and alert conditioning could dilute its edge. As an invite-only script, it provides clear value through premium features like timezone-aware DND, comprehensive holiday integration (e.g., Lunar New Year for HKSE), and state-aware alerts, which aren't replicated in free alternatives. Traders seeking an efficient, low-noise tool for institutional-level analysis will find it worth the access, as it delivers actionable insights that generic indicators overlook.
Disclaimer
This indicator assists in zone identification but does not guarantee success. Trading involves risk, and past performance is not indicative of future results. Always use proper risk management.

Multi TF - HTF→LTF OrderblocksMulti TF — HTF→LTF Orderblocks
Identify higher-timeframe (HTF) order blocks and project them onto your lower-timeframe (LTF) chart—clean, fast, and publication-ready.
The script automatically detects swing breaks on your chosen HTF, builds the originating order block, and renders that zone on your current chart so you can execute on lower timeframes with higher-timeframe context.
--------------------
How it works
HTF swing structure is tracked via pivot highs/lows and a user-selected break confirmation (Close or Wick).
On a valid break, the script backtracks to the last opposite candle and creates the HTF order block (wick-to-wick or body-only depending on your setting).
The OB is projected to the LTF and extended bar-by-bar until:
Mitigation: price penetrates at least 50% of the zone → the box is marked “old” (dimmed) or optionally auto-deleted.
Close-break: price closes beyond the far edge → zone is optionally removed immediately.
Each zone includes a centerline and an inside label showing the original HTF (e.g., “M15”, “H1”).
Key features
True HTF→LTF overlay: trade M1/M5 with M15/H1/H4 context.
Mitigation logic (≥50%): first meaningful touch turns the zone “old” or deletes it (your choice).
Close-break handling: auto-remove zones broken by close, to keep charts clean.
Overlap control: choose how to handle overlapping zones on the same side:
Keep Latest, Union (merge), or Intersection (refine).
Wicks vs. Bodies: build zones from full candle range or just the body.
Lightweight UI: only the relevant inputs in the panel; sensible defaults.
Alert included: fires on the first 50% mitigation of any fresh zone.
Performance-friendly limits: cap the number of active zones to fit Pine limits.
Inputs (quick overview)
HTF for Order Blocks: timeframe to scan (e.g., 15, 60, 240, D).
Swing Length (Pivot L/R): pivot sensitivity for structure.
Break Confirmation: Close (recommended) or Wick.
Zones use Wicks: on/off for wick-to-wick zones.
OB Lookback before Break: how far to search for the opposite candle.
Max Active Zones: hard cap for chart cleanliness & performance.
Delete on Close-Break: remove zones that are invalidated by a close.
Delete after Mitigation: remove once a 50% touch occurs.
Handle Overlap: None, Keep Latest, Union (merge), Intersection (refine).
Colors & Border: fresh/old zone colors (default ~35% opacity) and optional borders.
Default profile (as shipped):
Break by Close, zones use wicks, Union overlap handling, 250 lookback, 250 max zones, borders off, and HTF label printed inside each zone.
How to use (suggested workflow)
Pick an HTF (e.g., H1 for intraday) and drop to your execution TF (e.g., M5/M1).
Wait for price to tap ≥50% of a fresh OB → look for your LTF trigger (CHOCH, iFVG, PA).
Place SL beyond the zone (or beyond the LTF swing) and manage to your targets (e.g., 2R–3R or to the next HTF OB).
Keep charts clean by enabling Delete on Close-Break and (optionally) Delete after Mitigation.
Alerts
“OB: Zone berührt (Erstkontakt)” — triggers on the first ≥50% mitigation of any fresh zone.
Create additional TradingView alerts with this condition to get notified in real time.
Notes & limitations
Built with request.security(..., lookahead_off) to avoid future-bar peeking; zones only form after a confirmed HTF break.
As with all pattern-based tools, use alongside your risk management and a defined entry model.
Pine has strict limits on drawings; use Max Active Zones to balance coverage and performance.
Credits
Designed for traders who want HTF precision with LTF execution—a clean, opinionated OB overlay that focuses on what matters: fresh zones, first touch, and invalidation.
True Order Block (OB) True Order Block (OB)
This script automatically detects and plots Order Blocks (OBs) based on the presence of Fair Value Gaps (FVGs).
Only Order Blocks are displayed on the chart.
🔎 How it works
The script looks for Fair Value Gaps (FVGs) according to a relaxed 3-candle definition.
Once an FVG is detected:
For a Bullish FVG → the last bearish candle before the gap is marked as the Bullish Order Block.
For a Bearish FVG → the last bullish candle before the gap is marked as the Bearish Order Block.
OBs are extended into the future until price either:
mitigates the zone (optional auto-removal), or
the number of live OBs exceeds the user’s maximum (FIFO cleanup).
⚙️ User settings
Draw Order Blocks (enable/disable plotting)
Minimum OB length (how far each zone extends initially)
Remove OB after violation (auto delete invalidated zones)
Max active OBs (limit on displayed zones for clarity)
Bullish/Bearish OB colors
✅ Key features
Fully automated OB detection
No clutter – only OBs are plotted (FVG logic hidden in the background)
Smart cleanup: mitigated zones are removed automatically
Customizable colors & limits
⚠️ Notes
This tool is designed for educational and analytical purposes only.
It does not generate trade signals.
Always combine with your own strategy, market context, and risk management.

Smart support and Resistancehelps you find out where smart money has done bulk buying/selling.
the levels can give you confidence on your existing views and find high reward low risk setups.

Volume Reinforced Supply/Demand Zoneswhen trading supply and demand i found a way to see which zones are high quality zones. this indicator tries to do that for you. its not nearly as good as doing it manually, but its pretty decent. feel free to fine tune the settings and see which works best for you.
the indicator uses volume and price movement to draw supply and demand zones. if the zone is tested, it will change color to let you know, so you can decide whether or not to use the zone.
if a zone is broken, it will display a signal which tells you which candle broke through the zone.
you can change in the settings the requirements for an area to be considered a zone.

Futures Trade Entry Indicator (MTF)Work in Progress with the help of Claude. Not ready for active trading. Public for help improving. This will be a multi-timeframe futures trading indicator with supply/demand zones, Fair Value Gaps (FVGs), and sophisticated entry/exit logic.I've created a comprehensive Pine Script v6 indicator that matches all your specifications! Here's what the script includes:
## **Key Features Implemented:**
### **🔄 Multi-Timeframe Logic**
- **1H Chart Data**: Detects Supply Zones, Demand Zones, and Fair Value Gaps
- **Current Timeframe**: Monitors for re-entry and confirmation signals
### **📊 Zone Detection**
- **Supply Zones**: Identified using pivot highs with configurable strength
- **Demand Zones**: Identified using pivot lows with touch validation
- **Fair Value Gaps**: Both bullish and bearish FVGs detected automatically
- **Auto-Expiry**: Zones expire after 24 hours (configurable)
### **⚡ Entry Logic**
- **Dual Confirmation Required**:
- ✅ Engulfing candle pattern (bullish/bearish)
- ✅ Market structure shift (HH→LL or LL→HH)
- **Zone Re-entry**: Price must be within identified zones/FVGs
### **🎯 Probability System**
- **Smart Scoring**: Based on zone age, strength, and risk/reward ratio
- **Color-Coded**: Green (High), Yellow (Medium), Red (Low)
- **Real-time Calculation**: Updates with each potential entry
### **🎨 Visual Elements**
- **Colored Zones**: Supply (red), Demand (green), FVGs (blue/orange)
- **Entry Labels**: 🟩 LONG / 🟥 SHORT markers
- **Probability Labels**: Display confidence levels
- **Confirmation Shapes**: Triangle indicators for pattern completion
### **⚙️ Manual Controls**
All the requested toggles are available in the settings panel:
- Show/Hide Supply Zones
- Show/Hide Demand Zones
- Show/Hide FVGs
- Show/Hide Labels
- Show/Hide Probability
- Zone strength and expiry settings
- Custom colors for all elements
### **🔔 Alert System**
- Entry opportunity alerts
- Includes probability assessment
- Ticker symbol identification
## **Usage Instructions:**
1. **Apply to 15m chart** for active trading signals
2. **Configure settings** based on your preferences
3. **Set up alerts** for automated notifications
4. **Monitor probability levels** for trade quality assessment
The script automatically handles the complex multi-timeframe analysis while keeping the interface clean and user-friendly. All zones update dynamically and expire appropriately to avoid clutter.
Would you like me to adjust any specific parameters or add additional features?

Boring w/Prev LeginThis TradingView Pine Script highlights “boring” candles that follow a specific “legin” candle, based on strict supply/demand zone and price action rules inspired by your trading strategy.
A candle will be highlighted if it meets all of these:
The current candle is “boring” (low volatility, small range).
The previous candle was a “legin” (high volatility, big move).
The previous “legin” was much larger than the current “boring” candle (by TR or size).
The boring candle has both upper and lower wicks (not a marubozu).
The legin candle had a strong body (≥70% of its size) and a wick on its close side (showing strong price rejection).
Vera Support Resistance FinderVera Support & Resistance Zones is an educational technical analysis tool that automatically detects potential support and resistance levels based on pivot highs and lows.
Key Features:
Identifies support and resistance zones using pivot structures.
Marks previously broken levels and displays how many times each level has been broken. (This feature can be toggled on or off.)
Shows the distance from current price to each level with dynamic labels.
Groups nearby levels within a user-defined percentage range and shows how many points are merged into each zone. (This percentage is adjustable and the feature can be enabled/disabled.)
Optimization is possible through adjustable depth and level count parameters.
Each timeframe and each chart may require different settings. It’s recommended to adjust the depth, point count, and percentage settings depending on the structure of the asset and timeframe being analyzed.
Color Coding:
Green: Support
Red: Resistance
Navy Blue: Levels acting as both support and resistance
Important Note:
This indicator is developed for educational and visual assistance purposes only.
While it helps identify price reaction zones, manual drawing and validation are strongly recommended.
Since it works based on a defined algorithm, it may not capture critical levels as precisely as the human eye and experience can.
— Developer: C. İnanç ÖZYALIM | Dedicated to Vera 💜

Supply & Demand (OTC)Supply & Demand - Advanced Zone Detection
Overview
This indicator is a sophisticated tool designed to automatically identify and draw high-probability supply and demand zones on your chart. It analyzes pure price action to find key areas where institutional buying and selling pressure has previously occurred, providing you with a clear map of potential market turning points.
Unlike basic supply and demand indicators, this script is built with a proprietary engine that intelligently defines zone boundaries and filters for the most relevant price action patterns. It's designed to be a clean, professional, and highly customizable tool for traders who use supply and demand as a core part of their strategy.
Features
Advanced Zone Detection: Automatically finds and draws supply and demand zones based on significant price imbalances.
Reversal & Continuation Patterns: Identifies all four major price action patterns: Rally-Base-Drop (RBD), Drop-Base-Rally (DBR), Rally-Base-Rally (RBR), and Drop-Base-Drop (DBD).
"Level on Level" (LoL) Analysis: Automatically detects and labels zones that are stacked closely together, highlighting areas of potentially high liquidity and significance.
Wider vs. Preferred Zones: Choose between two zone definition modes. "Wider" mode draws the zone based on the full range of the consolidation, while "Preferred" mode refines the entry line based on key price action within the base, offering more precision.
Smart Zone Display: Intelligently displays only the most relevant zones closest to the current price, keeping your chart clean and focused. Supply zones above the current price and demand zones below are automatically prioritized and displayed based on your settings.
Customizable Zone Interaction: Control how zones react after being tested. Zones can change color on a first touch and be automatically deleted after a significant violation, which you can define by a percentage.
Customizable Visuals & Alerts: Fully customize the colors of all zones and candles. Enable or disable alerts for new zone creation and zone touches to stay on top of market movements.
How to Use
Identify Zones: The indicator will automatically plot supply zones (red) above the price and demand zones (green) below the price. These are potential areas to look for trade entries.
Assess Zone Strength: The strongest zones are typically "fresh" (untouched) and are formed by a strong, explosive move away from a tight consolidation (a small number of base candles).
Use Labels for Context: The floating labels (RBD, DBR, RBR (LoL), etc.) provide immediate context about the price action structure that formed each zone. "LoL" indicates a "Level on Level" zone, which may be of higher importance.
Wait for Confirmation: For the highest probability setups, wait for the price to return to a zone and show signs of rejection (e.g., reversal candlestick patterns) before considering an entry.
Settings Overview
Zone Definition: Control the core logic, such as including continuation patterns, setting the max number of base candles, and choosing between Wider and Preferred zone types.
Zone Display & Limits: Toggle limits on or off, and specify the maximum number of supply and demand zones to show on the chart.
Zone Interaction: Define how zones react to being tested, including the percentage required to delete a zone.
Colors & Style: Fully customize the appearance of zones, labels, and price candles.
Alerts: Enable or disable alerts for key events.
Disclaimer
This indicator is a tool for market analysis and should not be considered financial advice or a signal provider. Always use proper risk management and conduct your own analysis before making any trading decisions. Past performance is not indicative of future results.