FuTech : Earnings (All 269 Fundamental Metrics of Tradingview)FuTech : Earnings Indicator
The FuTech : Earnings Indicator is a revolutionary tool, offering the most comprehensive integration of all 269 fundamental financial metrics available from the TradingView platform.
This groundbreaking indicator is designed to empower financial researchers, traders, investors, and analysts with an unmatched depth of data, enabling superior analysis and decision-making.
Overview
"FuTech : Earnings Indicator" is the first-ever indicator to provide a holistic comparison of fundamental financial metrics for any stock, covering quarterly, yearly, and trailing twelve months (TTM) periods.
This tool brings together key financial data from income statements, balance sheets, cash flows, and other critical metrics found in company annual reports.
It also incorporates additional unique features like per-employee data, R&D expenses, and capital expenditures (CapEx), which are typically hidden within dense financial statements of Annual Reports.
---
Key Features and Capabilities
1. Comprehensive Financial Metrics
- "FuTech : Earnings Indicator" offers access to all 269 fundamental metrics available on TradingView platform. This includes widely used data such as revenue, profit margins, and EPS, alongside more niche metrics like R&D expenditure, employee efficiency, and financial scores developed by renowned analysts.
- Users can explore income statement data (e.g., net income, gross profit), balance sheet items (e.g., total assets, liabilities), cash flow metrics, and other financial statistics such as Altman Score, per employee expenses etc. in unparalleled detail.
2. Comparison Across Time Periods
- "FuTech : Earnings Indicator" allows users to analyze data for:
- Quarterly periods (e.g., Q1, Q2, Q3, Q4).
- Yearly comparisons for a broad historical view.
- TTM analysis to observe the most recent trends and developments.
- Users can select a minimum of 4 periods up to an unlimited range for detailed comparisons in both quarter.
3. Dynamic Data Display
- Users can select up to 5 key metrics alongside the stock price column to focus their analysis on the most relevant data points.
- Highlighting with green and red symbols offers an intuitive and visual representation:
- Green : Positive trends or improvements.
- Red : Negative trends or deteriorations.
4. Automated Averages
- "FuTech : Earnings Indicator" automatically calculates averages of selected metrics across the chosen periods. This feature helps users quickly identify performance trends and smooth out anomalies, enabling faster and more reliable research.
5. Designed for Research Excellence
- FuTech serves a wide audience, including:
- Corporate finance professionals who need a deep dive into financial metrics.
- Individual investors seeking robust tools for investment analysis.
- Broking companies and equity research analysts performing stock analysis.
- Traders looking to incorporate fundamental metrics into their strategies.
- Technical analysts seeking a better understanding of price behavior in relation to fundamentals.
- Fundamental research aspirants who want an edge in their learning process.
6. Unmatched Detail for Deeper Insights
- By pulling all 269 Financial metrics from the TradingView, "FuTech : Earnings Indicator" enables:
- Cross-comparison of a stock’s performance with its historical benchmarks.
- Evaluation of rare data like R&D expenses, CapEx trends, and employee efficiency ratios for enhanced investment insights.
- This ensures users can study stocks in greater depth than ever before.
7. Enhanced Usability
- Simple to use and visually appealing, "FuTech : Earnings Indicator" is designed with researchers in mind.
- Its intuitive interface ensures even novice users can navigate the wealth of data without feeling overwhelmed.
Applications of FuTech : Earnings Indicator
FuTech : Earnings Indicator is incredibly versatile and has applications in diverse fields of financial research and trading:
1. Corporate Finance
- Professionals in corporate finance can leverage "FuTech : Earnings Indicator" to benchmark company performance, study efficiency ratios, and evaluate financial health across various metrics.
2. Investors and Traders
- Long-term investors can use the tool to study the fundamental strengths of a stock before making buy-and-hold decisions.
- Traders can incorporate "FuTech : Earnings Indicator" into their analysis to align comprehensive fundamental trends with their targeted technical signals.
3. Equity Research Analysts
- Analysts can streamline their workflows by quickly identifying trends, outliers, and averages across large datasets.
4. Education and Research
- "FuTech : Earnings Indicator" is ideal for students and aspiring financial analysts who want a practical tool for understanding real-world data.
How FuTech : Earnings Indicator Stands Out
1. First-Ever Integration of All Financial Metrics
- It's an exclusive tool which offers the ability to explore all 269 financial metrics available on TradingView for a single stock research in-depth for quarters, years or TTM periods.
2. Period Customization
- Users have complete flexibility to select and analyze data across any range of time periods, allowing for customized insights tailored to specific research goals.
3. Data Visualization
- The intuitive use of color-coded symbols (green for positive trends, red for negative) makes complex data easy to interpret at a glance.
4. Actionable Insights
- The automated average calculations provide actionable insights for making informed decisions without manual computations.
5. Unique Metrics
- Metrics such as research and development costs, CapEx, and per-employee efficiency data offer unique angles that aren’t typically available in traditional analysis tools.
Why to Use FuTech : Earnings Indicator ?
1. Boost Your Research Power
- With FuTech, you can unlock a world of data that gives you the edge in analyzing stocks. Whether you’re a seasoned analyst or a beginner, this tool offers something for everyone.
2. Save Time and Effort
- The automated features and intuitive interface eliminate the need for time-consuming manual calculations and formatting.
3. Make Better Decisions
- "FuTech : Earnings Indicator's" detailed comparison capabilities and insightful visual aids allow for more accurate assessments of a stock’s performance and potential.
4. Broad Appeal
- From individual investors to financial institutions, FuTech is a valuable tool for anyone in the world of finance.
---
Conclusion
- The FuTech : Earnings Indicator is a must-have for anyone serious about financial analysis.
- It combines the depth of all 269 fundamental metrics with intuitive tools for comparison, visualization, and calculation.
- Designed for ease of use and powerful insights, FuTech : Earnings Indicator is set to transform the way financial data is analyzed and understood.
Thank you !
Jai Swaminarayan Dasna Das !
He Hari ! Bas Ek Tu Raji Tha !
Отчётность

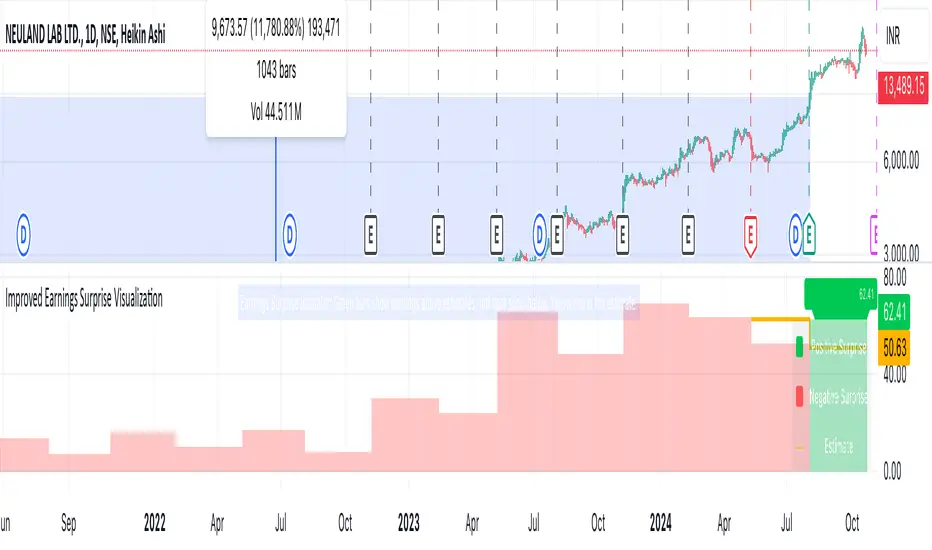
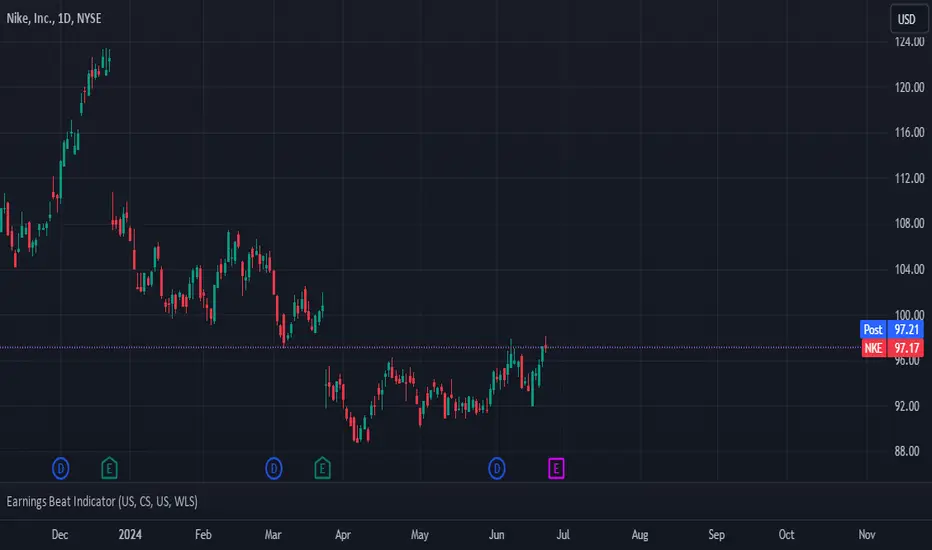
Earnings Surprise Indicator (Post-Earnings Announcement Drift)What It Does:
- Displays a company's actual earnings vs. analysts' estimates over time
- Shows "earnings surprises" - when actual results beat or miss expectations
- Helps identify trends in a company's financial performance
How It Works:
- Green bars: Positive surprise (earnings beat estimates)
- Red bars: Negative surprise (earnings missed estimates)
- Yellow line: Analysts' earnings estimates
Correlation with Post Earnings Announcement Drift (PEAD): PEAD is the tendency for a stock's price to drift in the direction of an earnings surprise for several weeks or months after the announcement.
Why It Matters:
- Positive surprises often lead to upward price drift
- Negative surprises often lead to downward price drift
- This drift can create trading opportunities
How to Use It:
1. Spot Trends:
- Consistent beats may indicate strong company performance
- Consistent misses may signal underlying issues
2. Gauge Market Expectations:
- Large surprises may lead to significant price movements
3. Timing Decisions:
- Consider long positions after positive surprises
- Consider short positions or exits after negative surprises
4. Risk Management:
- Be cautious of reversal if the drift seems excessive
- Use in conjunction with other technical and fundamental analysis
Key Takeaways:
- Earnings surprises can be fundamental-leading indicators of future stock performance, especially when correlated with analyst projections
- PEAD suggests that markets often underreact to earnings news initially
- This indicator helps visualize the magnitude and direction of surprises
- It can be a valuable tool for timing entry and exit points in trades
CAPE / Shiller PE RatioThe CAPE (Cyclically Adjusted Price-to-Earnings) or Shiller PE ratio is a popular valuation measure used by investors to assess whether a stock or index is over or undervalued relative to its historical earnings. Unlike the traditional P/E ratio, the CAPE ratio smooths earnings over ten years, adjusting for inflation and providing a more stable and long-term view of valuation.
This indicator lets you quickly calculate and visualize the CAPE ratio for any stock on TradingView, helping you make informed decisions about the sustainability of current price levels. With its clear presentation and intuitive setup, you can compare historical CAPE levels and identify potential opportunities for long-term investments or avoid overvalued markets.
Advantages of the CAPE Ratio:
Long-Term Focus : Smooth earnings over ten years, reducing the impact of short-term volatility.
Inflation-Adjusted : Provides a more precise, inflation-adjusted valuation measure over time.
Historical Comparison : Allows for benchmarking against long-term historical averages.
Market Sentiment Indicator : Can highlight overvalued or undervalued markets for long-term investors.
Reduces Noise : Filters out short-term earnings fluctuations, offering a more stable view.
Disadvantages of the CAPE Ratio:
Ignores Recent Earnings : Misses short-term earnings changes, which can affect current valuations.
Outdated Data : Relies on old earnings data that may not reflect recent company performance.
Less Effective for Growth Stocks : May undervalue high-growth stocks focused on future earnings.
Sector Limitations : Works best for broad markets, less so for fast-changing industries.
Debated Predictive Power : It’s unreliable for timing short-term market movements.
In short, the CAPE ratio is excellent for long-term valuation but has limitations for short-term or growth-focused investing.
Disclaimer
Please remember that past performance may not be indicative of future results.
Due to various factors, including changing market conditions, the strategy may no longer perform as well as in historical backtesting.
This post and the script don’t provide any financial advice.

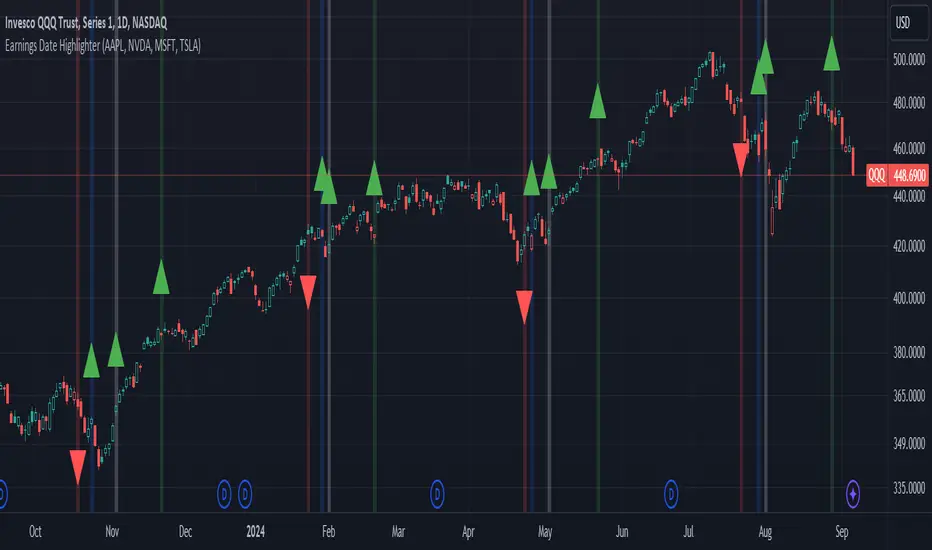
Earnings Date Highlighter - from0_to_1This indicator, called "Earnings Date Highlighter," is designed to visualize earnings data for up to four different stocks on a single chart. It's particularly useful for traders or investors who want to track earnings events for multiple companies simultaneously, such as the top holdings of an ETF.
Key features:
1. Tracks earnings data (estimates and actuals) for four user-defined symbols.
2. Plots earnings data points with customizable colors for each symbol.
3. Highlights earnings dates with background colors.
4. Displays green up arrows for earnings beats and red down arrows for earnings misses.
Why someone would use it:
1. To monitor earnings events for multiple stocks in a single view.
2. To quickly identify potential market-moving events for key components of an ETF or portfolio.
3. To spot patterns in earnings performance across different companies or sectors.
4. To help with timing trades or adjusting positions around earnings announcements.
This tool can be particularly valuable for investors focused on ETFs, as it allows them to visualize earnings dates and performance for the ETF's major holdings all in one place, potentially providing insights into how the ETF might behave around these key events.
Author:
www.tradingview.com
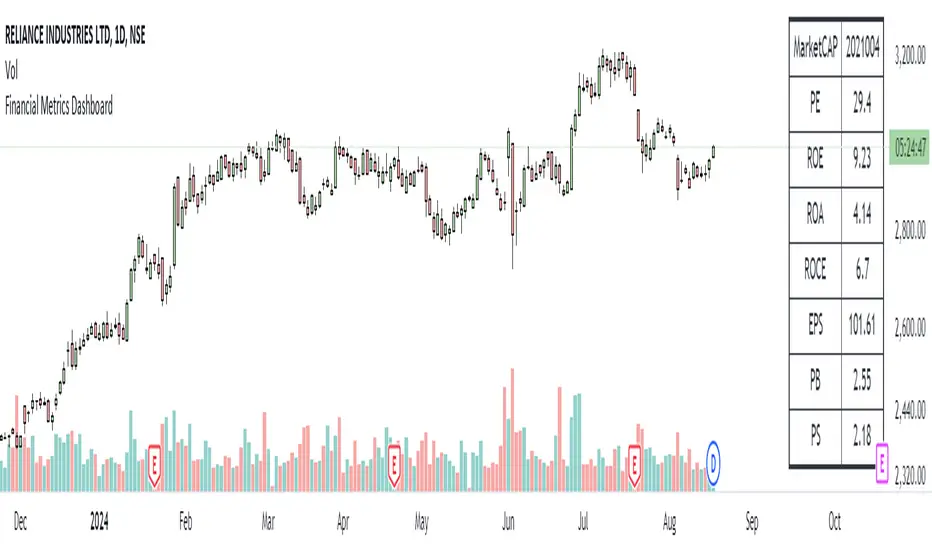
Financial Metrics DashboardThis TradingView Pine Script, written in version 5, is designed to display key financial metrics of a selected ticker in a customizable table format. The script calculates and presents several financial ratios and values, including Market Capitalization, Price-to-Earnings (P/E) Ratio, Return on Equity (ROE), Return on Assets (ROA), Return on Capital Employed (ROCE), Earnings Per Share (EPS), Price-to-Book (P/B) Ratio, and Price-to-Sales (P/S) Ratio.
Users can adjust the table's size and position on the chart, allowing flexibility in how the data is displayed. The data is dynamically retrieved using the request.financial function, making the script adaptable to various stocks and financial instruments available on TradingView.
PE Ratio Intrinsic ValueThe "Median PE Ratio and Intrinsic Value" indicator is designed for traders and investors who wish to evaluate the intrinsic value of a stock based on a comparative analysis of Price-to-Earnings (PE) ratios across multiple stocks. This tool not only provides insights into whether a stock is undervalued or overvalued but also allows you to visualize the intrinsic value directly on the chart.
Comparison Across Multiple Stocks:
This indicator calculates the PE ratio for up to five different stocks, allowing you to compare the target stock's valuation against four other same sector companies. By default, the stocks included are Apple (AAPL), Google (GOOG), Microsoft (MSFT), and Amazon (AMZN), but you can customize these symbols to fit your analysis needs.
Dynamic PE Ratio Calculation:
The indicator calculates the PE ratio for each stock by dividing the current price by the earnings per share (EPS). The EPS data is retrieved based on the selected period, which can be one of the following:
FY (Fiscal Year)
FH (Fiscal Half-Year)
FQ (Fiscal Quarter)
TTM (Trailing Twelve Months)
You can easily switch between these periods using the provided input options, enabling a more customized analysis based on your preferred financial timeframe.
Once the PE ratios for the selected stocks are computed, the indicator calculates the average PE ratio. The average value is a robust measure that reduces the influence of outliers and provides a balanced view of market valuation.
The intrinsic value of the stock on the chart is calculated by multiplying its EPS by the median PE ratio of the selected stocks. This gives you an estimate of what the stock should be worth if it were to trade at a fair valuation relative to the chosen peers.
The intrinsic value is plotted directly on the price chart as a step line with breaks. This step line style is chosen to represent changes in intrinsic value clearly, with breaks indicating periods where the calculated value is not valid (e.g., negative intrinsic value). Only positive intrinsic values are displayed, helping you focus on meaningful data.
You can easily customize the stocks analyzed by entering the ticker symbols of your choice. Additionally, the indicator allows you to adjust the timeframe for EPS data, giving you flexibility depending on whether you are focused on long-term trends or shorter financial periods.
How to Use:
Compare the current stock price to the plotted intrinsic value. If the current price is below the intrinsic value, the stock may be undervalued. Conversely, if the price is above the intrinsic value, the stock might be overvalued. By comparing your stock against major market players, you can gauge whether it's trading at a premium or discount relative to other key companies in the sector. Use the period selection (FY, FQ, TTM) to adapt your analysis to different market conditions or earnings cycles, giving you more control over your valuation assessment.
Ideal For:
Long-term Investors looking to assess the intrinsic value of a stock based on comparative analysis.
Fundamental Analysts who want to combine multiple stocks' PE ratios to estimate a fair valuation.
Value Investors interested in finding undervalued opportunities by comparing the market price to intrinsic value.

Stock Value RainbowStock Valuation based on Book Value, Dividends, Cashflow, Earnings and Estimates and Money Multiplier
There are many ways to measure stock valuations: some methods are using book value, some are using dividends, some are using cashflow, some are using earnings and some using estimates data. Most of these valuation methods are based on multiplier effect which measure how many times the stock price could expand from their valuation base. This indicator attempts to unify all these measurements using just simple addition of all measurements such as: book value per share, dividend per share, cashflow per share, earning per share, and estimates of earning per share and then using multiplier effect to create beautiful rainbow to see how far the stock has growing up above or below their valuation base. The higher the stock price on rainbow spectrum means it is more expensive and the lower in the rainbow spectrum means it is cheaper. Here is the basic formula explanation:
SV = (BVPS + DPS + CFPS + EPS + EST) * MM
BVPS = Book Value Per Share (Asset - Liability)
DPS = Dividends Per Share
CFPS = Free Cash Flow Per Share
EPS = Earnings Per Share
EST = Estimates of EPS
MM = Money Multiplier (1x, 2x, ... ,10x)
- The gray line represents the stock value SV
- The rainbow above the gray line represents the multiplication factors from 1x, 2x, ..., 10x
- The rainbow below the gray line represents the division factors from 0.8x, 0.6x, ..., 0.2x
Check other script to value stock and index:
- Stock Value Rainbow: script to value stock based on book value, dividend, cash flow, earning and estimates.
- Index Value Rainbow: script to value index based on fed balance sheet and base money supply
- Gold Value Rainbow: script to value gold based on global money supply
- Stock Value US: script to check US stock value
- Stock Value EU: script to check EU stock value
- Stock Value JP: script to check JP stock value
- Stock Value CN: script to check CN stock value

Earnings Beat IndicatorThis indicator seeks to predict whether a stock will beat or miss earnings by forecasting revenues, and subsequently net income, using linear regression. The y-values of this regression are revenues and the x-axis is an economic series of your choosing. Double-click the status line (the words "US" and "GDP") to change economic datasets. The full list of economic datasets available in TradingView is in the Help Center.
Instructions:
1. Double-click on the status line (the fields "US" and "GDP"). The inputs tab will pop up.
2. Type in the country and data codes for the economic datasets you believe have the highest correlation with revenues and net margins respectively.
3. Check the correlation coefficient between financial data and economic data by interpreting the white and gray numbers on the status line - white for the correlation coefficient between revenues and your chosen economic dataset, and gray for the correlation coefficient between net margins and your chosen economic dataset. These numbers should be as close to +1 or -1 as possible.
4. Interpret the results - the blue number indicates whether revenues will beat estimates and the green number indicates whether earnings will beat estimates. A 1 for both outputs indicates a double beat, a 1 and a 0 indicates a revenue beat but not an earnings beat, a 0 and a 1 indicates an earnings beat but not a revenue beat, and a 0 and a 0 indicates a double miss.
- DickZhones
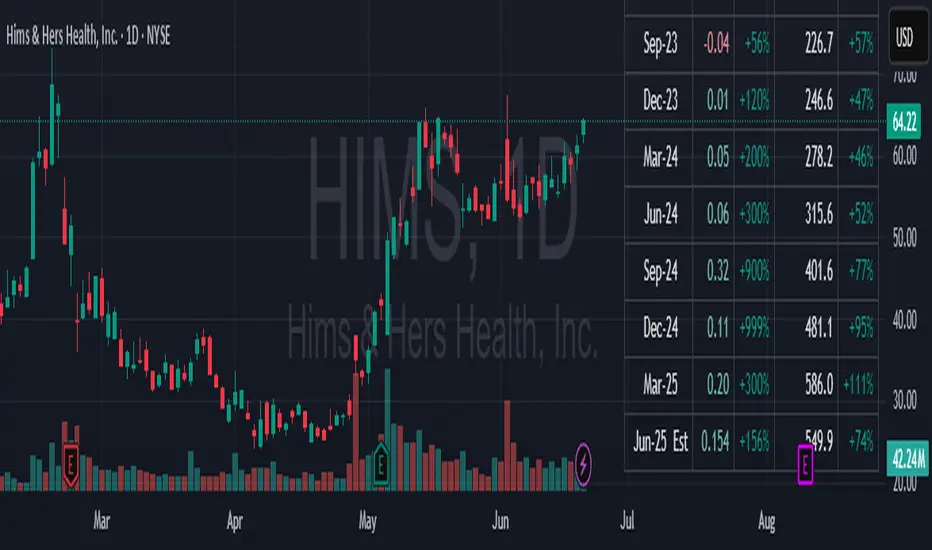
Earnings X-RayThe script presents earnings and revenues in a tabular format. Particularly, it calculates percentage changes.
Earnings data can be found in TradingView Financials. However, percentage changes are not provided. Can TradingView implement this in the future?
Displaying earnings table on the chart has its benefits. No additional clicks required to access the data. This significantly streamlines the stock scanning process.
It is important to quickly evaluate a company's earnings when scanning for stocks. The script provides this capability.
Similar scripts have been created previously. This script corrects calculations and improves presentation with the concise code.
Data access:
Earnings = request.earnings(syminfo.tickerid, earnings.actual)
FutureEarnings = earnings.future_eps
FutureRevenue = earnings.future_revenue
Can more than one quarter of future earnings estimates become available in Pine Script in the future?
The script was validated against MarketSurge.
Features:
Quarterly or Yearly data
Configurable number of fiscal periods
Configurable location on the chart
Optional Dark mode
[INVX] P/E band (panel)What is it?
The P/E Bollinger Band indicator is a hybrid tool combining fundamental analysis (P/E ratio) with technical analysis (Bollinger Bands).
It uses Bollinger Bands around a company's P/E ratio to identify potentially overvalued or undervalued zones.
The P/E ratio itself measures a stock's price relative to its earnings per share.
The Bollinger Bands, based on standard deviations, create a dynamic upper and lower band around the average P/E ratio.
Why P/E Bollinger Band?
Provides a visual representation of a company's relative valuation compared to its historical P/E range.
Can help identify areas where the P/E ratio might be deviating significantly from its historical norm.
Who should use it
Investors who combine technical and fundamental analysis for a more comprehensive stock evaluation.
Value investors seeking to identify potentially undervalued companies.
How to use
A P/E value that breaches the upper Bollinger Band suggests potential overvaluation, indicating the stock might be due for a price correction.
Conversely, a P/E value that falls below the lower Bollinger Band might signal undervaluation, presenting a potential buying opportunity (considering the company's fundamentals remain sound).

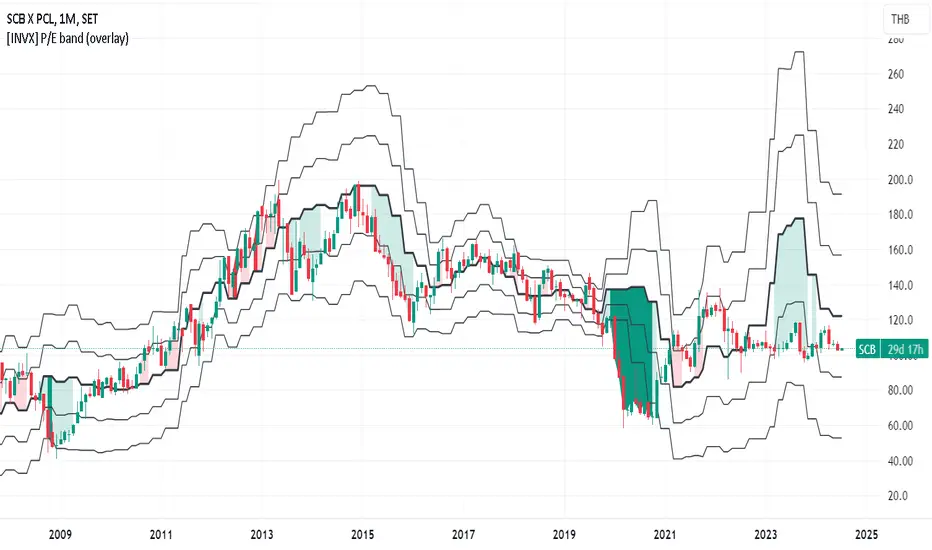
[INVX] P/E band (overlay)What is it?
The P/E Bollinger Band indicator is a hybrid tool combining fundamental analysis (P/E ratio) with technical analysis (Bollinger Bands).
It uses Bollinger Bands around a company's P/E ratio to identify potentially overvalued or undervalued zones.
The P/E ratio itself measures a stock's price relative to its earnings per share.
The Bollinger Bands, based on standard deviations, create a dynamic upper and lower band around the average P/E ratio.
Why P/E Bollinger Band?
Provides a visual representation of a company's relative valuation compared to its historical P/E range.
Can help identify areas where the P/E ratio might be deviating significantly from its historical norm.
Who should use it
Investors who combine technical and fundamental analysis for a more comprehensive stock evaluation.
Value investors seeking to identify potentially undervalued companies.
How to use
A P/E value that breaches the upper Bollinger Band suggests potential overvaluation, indicating the stock might be due for a price correction.
Conversely, a P/E value that falls below the lower Bollinger Band might signal undervaluation, presenting a potential buying opportunity (considering the company's fundamentals remain sound).
Quaterly Earnings,Sectors/Industry,Moving AveragesDescription:
The EPS & Revenue indicator is designed to provide detailed financial insights into a company's performance by displaying key financial metrics such as Earnings Per Share (EPS), Total Revenue, Free Float, Operating Income, and Return on Equity (ROE). The indicator also calculates and visualizes the percentage changes in these metrics over different quarters, offering a comprehensive view of the company's financial health.
Features:
Table Display:
A customizable table that can be positioned in various locations on the chart (e.g., top left, top center, bottom right, etc.).
Color-coded cells to indicate positive and negative changes in financial metrics.
Dynamic text size and color for better readability.
Financial Metrics:
EPS (Earnings Per Share): Displays the EPS values for the current and previous quarters.
Total Revenue: Shows revenue values in crores (Cr) for multiple quarters.
Free Float: Represents the number of freely floating shares.
Operating Income (OP): Indicates the operating income for the company.
Return on Equity (ROE): Displays the ROE values for multiple quarters.
Calculations:
EPS Year-over-Year (YoY) Change: Calculates the YoY percentage change in EPS.
Quarter-over-Quarter (QoQ) Change: Computes the percentage change in EPS and sales for different quarters.
Sales in Crores: Displays sales values in crores (Cr) and calculates the QoQ changes.
Operating Profit Margin (OPM): Calculates the operating profit margin as a percentage of sales.
52-Week High/Low: Shows the highest and lowest prices over the past 52 weeks.
Average Daily Range (ADR): Computes the average daily range percentage.
Turnover: Displays the average turnover period and current turnover values.
Relative Volume (Rvol): Indicates the relative trading volume compared to the average.
Color Coding:
Uses different colors to highlight significant changes in metrics (e.g., dark green for strong positive changes, light green for moderate positive changes, red for negative changes).
Adjustable transparency based on the magnitude of the change.
Customization:
User inputs for table position, color settings, and calculation periods for turnover and relative volume.
Text labels for various columns and rows in the table to enhance clarity.
How to Use:
Add the EPS & Revenue indicator to your TradingView chart.
Customize the table position and color settings as per your preference.
Analyze the displayed financial metrics and percentage changes to gain insights into the company's performance.
Use the color-coded cells to quickly identify significant changes and trends in EPS, revenue, operating income, and other key metrics.
Example Output:
The table will display current and past EPS values, percentage changes in EPS and sales, operating profit margins, ROE values, turnover, relative volume, and the percentage up from 52-week low and down from 52-week high.
The data will be color-coded to indicate positive and negative changes, making it easier to interpret the company's financial performance at a glance.
This indicator is ideal for investors and traders who want to keep a close eye on a company's financial health and make informed decisions based on detailed financial data.

DaysToEarningsAn useful tool for investors/traders who want to keep track of upcoming earnings event.
Here's a breakdown of the indicator and its features:
Functionality:
#1 Displays the next earnings date for a company and additionally shows the number of days remaining until the earnings event.
#2 Offers three display modes:
Default: In this view both the earnings date and the number of days left is displayed
Head-less: A compact view without the headers
Mini-Mode: Super compact view, showing only the number of days
#3 Allows setting a custom baseline number of days. Based on this value the background color if the number of days in the indicator changes - red (if days remain is less than the number of days provided) else a gradient color in the shades of green.
As many stocks shows a drastic increase in volatility near the earnings date, this feature is very useful for visually being reminded of the days left.
***Lastly the footprint is very small making this important event reminder available on the chart without much fuss.***
Internals:
To calculate the days remaining until the earnings report, it uses the tv built-in variable "earnings.future_time" and uses a custom function for color grading.
How to use:
Once the indicator is applied on the chart you can input a custom number as reference day value. Based on this value the color coded background is generated for the days remaining to produce a visual impact - red (actual days remaining less than reference days) else its shades of green (gradient from lime to teal)
Next, choose the display modes (for default both "Head-less" and "Mini-Mode" is unchecked)
Finally choose the placement Top/Middle/Bottom + Center/Left/Right combination as per your convenience from the table options section.
I hope this tiny script adds value to your trading! Cheers :)

Alpha Edge Pro - Intraday [LevelUp]Alpha Edge Pro™ is a collection of tools for intraday analysis built in collaboration with Brian Shannon, CMT, creator of the anchored VWAP (AVWAP) and the author of two best-selling books on technical analysis.
🔹—— Key Features ——🔹
▪ AVWAP auto-anchored on 1-day, 2-day, week-to-date and month-to-date.
▪ AVWAP works with any global exchange, respecting trading days, hours & holidays.
▪ AVWAP and the TradingView Replay are excellent for historical analysis.
▪ 5-day moving average auto-calculated based on the chart timeframe.
▪ 5-day moving average auto-adjusts the minutes in the trading day for crypto and futures.
▪ View up to two daily moving averages on intraday charts.
▪ Pivot points (floor trader pivots) highlight support/resistance levels (R1/S1, R2/S2, etc).
▪ Highlight current and prior day highs/lows as these are areas of potential support and resistance.
▪ Comprehensive stats tables for AVWAP, price highs/low, pivots and ATR (average true range).
▪ Custom alerts for AVWAP, pivot points and 5-day moving average.
🔹—— AVWAP ——🔹
The Volume Weighted Average Price (VWAP) is the cumulative average price a stock traded for one day. AVWAP is the same as the VWAP with the exception that the start point (the anchor) is configurable based on a trader's preference, not simply the start of the trading day. From the anchor point forward, on each bar, AVWAP is calculated based on the cumulative volume and average price.
The AVWAP shows the relationship between price and volume over any time period based on the anchor point. At a glance we can see who is in control, the buyers (bulls) or the sellers (bears).
AVWAP Concepts
▪ When a stock is above an advancing AVWAP, buyers are in control for that timeframe, as the average price is increasing.
▪ When prices are below a declining AVWAP, sellers are in control for that timeframe, as the average price is declining.
▪ When prices oscillate above and below the AVWAP it indicates indecision for that timeframe.
What's unique about AVWAP in this indicator is that it is auto-anchored on 1-day, 2-day, week-to-date and month-to-date. In addition, Alpha Edge supports any exchange around the globe, respecting trading days, hours and holidays. You can also use the TradingView Replay feature with this indicator, a powerful tool for historical and post-mortem analysis.
▪ 1-Day, 2-Day and Week-To-Date
▪ Saudi Exchange (Tadāwul)
Trading Days: Sunday to Thursday, 10:00am to 3:00pm.
Auto-Anchor: Detects start of trading week.
▪ London Stock Exchange (LSE)
Trading days: Monday to Friday, 8:00am to 4:30pm.
Auto-Anchor: Detects U.K. bank holiday.
▪ Review Historical Data and Past Trades
🔹—— 5-Day Moving Average ——🔹
A common trend following theme is to look for stocks where the trend of the 50-SMA is upward. We can view intraday charts to see if the price action is setting up for a low risk trade by verifying that the shorter timeframe aligns with the longer. As we look at various timeframes, we need to make sure the moving average is consistent across the timeframes, which is done via the 5-day moving average as explained by Brian Shannon:
"If you want to see a five DAY moving average on a chart with 10 minute candles, you have to consider how many 10 minute periods of trading there are in the trading day. The US equities markets are open from 9:30- 4:00 each day, which is 6.5 hours per trading day. In each hour of trading, there are 6-10 minute periods, so during the regular session for equities, the market is open for 390 minutes or 39-10 minute periods per day. If we are to get a five day moving average, we would take the 39-10 minute periods the market is open each day and then multiply that by five days. 39 x 5 = 195. So a 5 DAY moving average is represented by a 195 PERIOD moving average when looking at a 10 minute timeframe."
As trend followers, our goal is to find stocks where the 5-day moving average is trending up.
In Alpha Edge, the default value for the minutes per day is 390, the number of minutes in one trading day in the U.S. This value can be changed to match any exchange. For example, if trading the India National Stock Exchange (NSE), which is open from 9:15am to 3:30pm, the minutes per day could be set to 375.
Minutes per day are auto-adjusted for crypto and futures:
▪ Crypto: 1440 minutes per day based on 24 hrs per day.
▪ Futures: 1380 minutes per day based on 23 hrs per day.
▪ 5-Day Moving Average Trending Up
Important Note: Based on the math as described above using the minutes in the trading day, there will be chart timeframes where the 5-day moving average is not shown. If you have the 5-day moving average enabled from within the indicator Settings, yet the 5-day line is not visible, try changing to another timeframe.
🔹—— Vertical Start Line - Anticipating Direction ——🔹
By placing a vertical line on the bar where the 5-day moving average begins, one can anticipate the trend by viewing the bars that will fall off the moving average as new bars are added. This can be helpful to gauge if the trend will continue in its current trajectory or begin to move in a different direction.
▪ 5-Day Vertical Line
🔹—— Intraday and Daily Moving Averages ——🔹
In addition to custom moving averages based on intraday price action, there are two configurable daily moving averages. Viewing daily moving averages on intraday charts can be helpful as they often act as areas of support/resistance.
▪ Daily 10-EMA on Intraday Chart - Acting as Support
▪ Daily 50-SMA on Intraday Chart - Acting as Resistance
🔹—— Current and Prior Day Highs & Lows ——🔹
Linda Raschke, a legendary trader featured in Jack Schwager’s book, New Market Wizards, on the importance of tracking the previous day's price range:
"If I could trade with only one indicator, it would be with the previous day’s high and low. The reason why they are so important is this is where support and resistance come in and they are also the most visible chart points for all market participants. They are very strong psychological markers.”
With Alpha Edge, there are clear visual indicators, with optional price data, marking both current and prior day high/low values. This makes it easy to view potential areas of support/resistance. These areas can also be considered for entering, exiting or profit taking.
▪ Prior Day & Current Day Highs/Lows
🔹—— Pivot Points ——🔹
Floor trader pivot points are price levels that may act as areas of support or resistance. These pivot points were initially created by floor traders operating within the trading pits of the equity futures exchange in Chicago, Illinois.
The calculations for determining these pivots are based on the prior day's high, low and close:
Pivot (P) = (prevHigh + prevLow + prevClose) / 3
Resistance R1 = (2 * P) - prevLow
Support S1 = (2 * P) - prevHigh
Resistance R2 = P + (prevHigh - prevLow)
Support S2 = P - (prevHigh - prevLow)
Resistance R3 = prevHigh + (2 * (pivot - prevLow))
Support S3 = prevLow - (2 * (prevHigh - pivot))
▪ R1 Acting as Resistance
▪ S1 Acting as Support
🔹—— Stats Table ——🔹
With the stats table, at a glance you can view AVWAP values, current and prior days highs/lows, pivot points as well as the ATR (average true range). Each section in the table can be toggled on/off.
▪ Stats Table
🔹—— Custom Alerts ——🔹
Alpha Edge indicator supports the following custom alerts:
▪ 1-day & 2-day AVWAP cross.
▪ WTD/MTD AVWAP cross.
▪ R1/R2 and S1/S2 cross.
▪ 5-day moving average cross.
🔹—— Best Practices ——🔹
▪ Look for confirmation of an uptrend on multiple timeframes.
▪ Use multiple signals and/or patterns for confirmation of the trend.
▪ Avoid chasing extended stocks.
▪ Always define risk before entering a trade — know where you’ll exit.
▪ Size positions based on volatility and conviction, not emotion.
▪ Be patient — trends take time to develop.
Paid script

True stock performance based on EY Bar divergenceI created this indicator to be used in conjunction with my other indicator "True stock performance based on Earnings Yield". I've detailed in that description how true performance is calculated. In short it measures how much EY is moving in relation to the stock price. The theory is that if stock price is moving heavily while EY isn't you have a sentiment driven trend and the stock isn't traded on fundamentals.
This indicators marks bars when stock performance divergences from true performance.
Green upward triangle = The true performance closes lower than previous while stock price is closing higher. This indicates a optimistic sentiment as stock price is pushed up even though price based on EY is moving down.
Red downward triangle = The true performance closes higher than previous while stock price closing lower. This indicates a negative sentiment as stock price is pushed down even though price based on EY is moving up.
How do I use it?
I use it to confirm when sentiment has taken taken over a stock. If you have a fair uptrend (when both stock performance and true performance are doing higher highs), optimistic divergencies are welcome. I've used NVIDIA from 2017 to 2019 to demonstrate.
But if true performance starts to make lower highs while stock performance keeps going up and you see optimistic divergencies, you can tell that the market is getting overoptimistic.
When the stock had crashed it eventually bottomed and started to make higher lows together with an uptrend of true performance, which I count as a fair uptrend. Regardless of that you start to see some negative divergencies indicating that people are scared that the stock will drop again and oversell. These opportunities can be good places to buy more.
But i don't care about earnings, I'm a technical trader. Do i have any use for it?
You possibly could, yes. If you want to follow the crowd, optimistic divergencies confirms that the market is still interested in the stock and may keep pushing the price up. But be careful. Negative divergencies almost never marks any tops, it often confirms downtrends and may indicate bottoms. Often the optimistic divergencies marks the top so don't buy more blindly using this indicator.

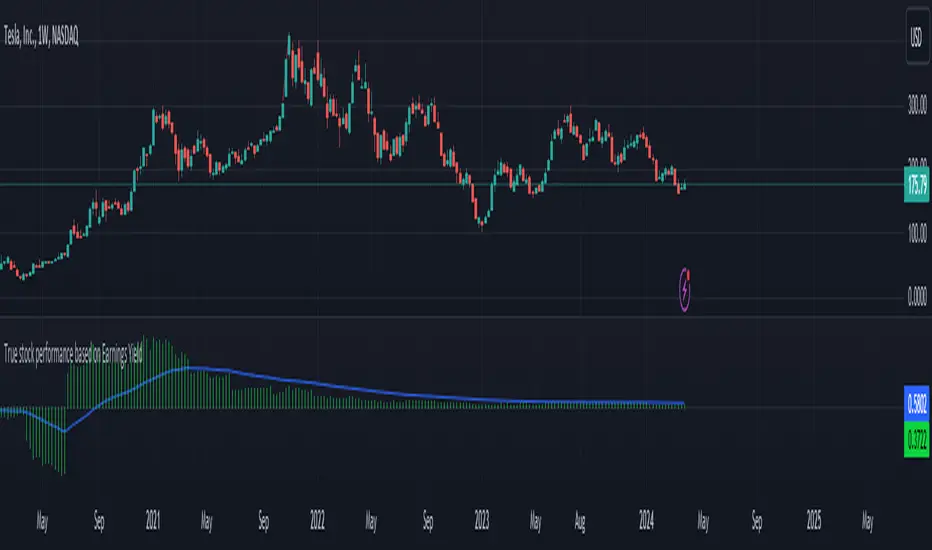
True stock performance based on Earnings YieldThe whole basis of the stock market is that you invest your money into a business that can use that money to increase it's earnings and pay you back for that investment with dividends and increased stock value. But because we are human the market often overbuy stocks that cant keep up their earnings with the current inflow of investments. We can also oversell a stock that is keeping up with earnings in regards to the stock price but we don't care because of the sentiment we have.
Earnings Yield is simply the percentage of Earnings Per Share in relation to the stock price. Alone, it's a great fundamental indicator to analyze a company. But I wanted to use it in another way and got tired of using the calculator all the time so that's why I made this indicator.
The goal is to see if the STOCK price is moving accordingly to the BUSINESS earnings. It works by calculating the difference of EY (TTM) previous close (1 bar) to the close thereafter. It then calculates the stock performance of the latest bar and divides that to get decimal form instead of percent. Then it divides the stock performance in decimal form with the difference of EY calculated before. The result shows how much the stock prices moves in relation to how much EY is moving. The theory is that if EY barely moves but the stock price moves heavily, you have a sentiment driven trend.
Example: Week 1 EY = 1.201. Week 2 EY = 1.105.
1.201 - 1.105 = 0.096
Week 2 performed a 11,2% increase in stock price. = 0.112 in decimal form.
0.112 / 0.096 = 1.67
1.67 is the multiple that plots this indicator.
Here is an good example of a stock that's currently in a highly sentiment driven trend, NVIDIA! (Posted 2024-03-30)
Here is an example of a Swedish stock that retail investors flocked to that have been blowned out completely.
When do I buy and sell?
This indicator is not meant to give exact entries or exits. The purpose is to scout the current and past sentiment, possible divergencies and see if a stock is over or under valued. I did add a 50 EMA to get some form of mean plotted. One could buy when true performance is low and sell when true performance drops below the 50 EMA. You could also just sell a part of your position and set a trailing exit with a ordinary 50 EMA or something like that. Often the sentiment will keep driving the price up. But if it last for 1 month or 1 year is impossible to tell.
Try it out and learn how it works and use it as you like. Cheers!
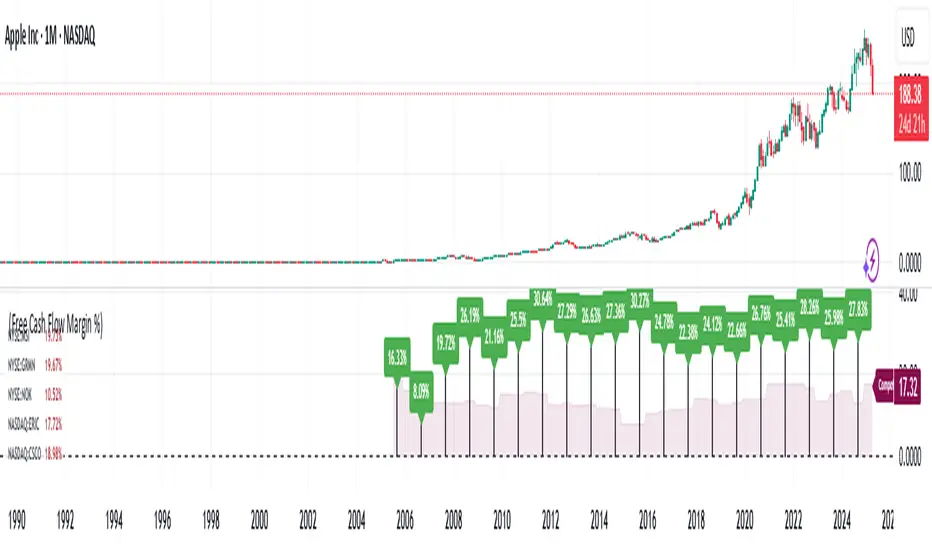
Financial Ratio Analysis (with / without Competitors)What Is Financial Ratio Analysis?
Financial Ratio Analysis is a quantitative technique used to assess a company's liquidity, operational efficiency, and profitability by examining its financial statements, including the balance sheet, income statement, and cash flow statement. It provides valuable insights into a company's performance over time and allows for comparisons with other companies within the same industry or sector.
What Are the Uses of Financial Ratio Analysis?
Analysis of financial ratios serves two main purposes:
1. Track company performance
Determining individual financial ratios per period and tracking the change in their values over time is done to spot trends that may be developing in a company.
Current Ratio for Adobe Inc. NASDAQ:ADBE
2. Make comparative judgments regarding company performance
Comparing financial ratios with those of major competitors enables the identification of whether a company is performing better or worse than the industry average. This comparative analysis aids in understanding the company's competitive position and potential areas for improvement.
For comparison, the script would automatically select a maximum of 5 competitors from the US markets based on the ticker's industry. This ensures a relevant comparison with industry peers to evaluate performance and assess competitive positioning.
To compare the Free Cash Flow Margin of Apple Inc. NASDAQ:AAPL with its competitors.
To compare the Free Cash Flow Margin of Apple Inc. NASDAQ:AAPL with its competitors’ average.
Customized competitors list
To customize your own competitors list, you can specify the companies or tickers you want to include in the comparison. This allows for a tailored analysis based on your specific preferences and industry knowledge.
Example:
To compare PayPal NASDAQ:PYPL with NASDAQ:MELI , NASDAQ:DLO , and NYSE:PAY , users can input the following text into the competitors list:
NASDAQ:MELI,NASDAQ:DLO,NASDAQ:PYPL,NYSE:PAY;
This will ensure that the comparison includes these specific companies alongside PayPal.
Financial ratios are grouped into the following categories:
Liquidity ratios
Leverage ratios
Efficiency ratios
Profitability ratios
Market value ratios
Liquidity Ratios
Liquidity ratios are financial ratios that measure a company’s ability to repay both short-term and long-term obligations.
Current Ratio measures a company’s ability to pay off short-term liabilities with current assets:
Current ratio = Total current assets / Total current liabilities
Cash To Debt Ratio measures a company’s ability to pay off short-term liabilities with cash and cash equivalents. A high ratio indicates a company can pay off its debt and remain solvent into the foreseeable future. In addition, it also means that if necessary, the company can take on a larger amount of debt because it has the cash to support that.
Cash to debt ratio = Cash and Short Term Investments / Total debt
Leverage Financial Ratios
Leverage ratios measure the amount of capital that comes from debt. In other words, leverage financial ratios are used to evaluate a company’s debt levels.
Debt To Assets Ratio measures the relative amount of a company’s assets that are provided from debt. This indicator is a measure of assets that are growing at the expense of debt. Because of this, you can see how a company acquired its assets over time. It can be used to assess a company's ability to meet its current debt obligations.
Debt to assets ratio = Total debt / Total assets
Debt To Equity Ratio calculates the weight of total debt and financial liabilities against shareholders’ equity:
Debt to equity ratio = Total liabilities / Shareholder’s equity
Interest Coverage Ratio shows how easily a company can pay its interest expenses:
Interest coverage ratio = Operating income / Interest expense
Efficiency Ratios
Efficiency ratios, also known as activity financial ratios, are used to measure how well a company is utilizing its assets and resources.
Research & Development (R&D) Expense to Revenue Ratio measures the percentage of sales that is allocated to R&D expenditures.
R&D to revenue ratio = Research and development expense / Total revenue * 100%
Asset Turnover Ratio measures a company’s ability to generate sales from assets. The higher it is, the more efficient the company is, since higher ratios mean that the company generates more income per dollar of assets. Conversely, if the company has a low Asset turnover, this indicates that it is inefficiently using its assets.
Asset turnover ratio = Revenue / Average total assets for two periods
Inventory Turnover shows how quickly a company sells its stock. A low turnover can mean weak sales, while a high one can mean good sales or insufficient stock. Inventory turnover is an important indicator of a company's performance.
Inventory turnover = Cost of goods sold / Total inventories
Days Sales Outstanding measures the average number of days it takes for a company to collect cash from credit purchases.
Days sales outstanding = Average Accounts Receivable / Revenue x 365 Days
Days Inventory shows the time in days that is spent turning a company's inventory into sales. This metric is an indicator of a company's inventory management. Low values are preferred for Days Inventory, which means items are selling faster and there is a quick turnaround. Large values indicate that a company has invested too much in stocks and does not have time to sell them.
Days inventory = Average inventories / Cost of goods sold * Days in period
Profitability Ratios
Profitability ratios measure a company’s ability to generate income relative to revenue, balance sheet assets, operating costs, and equity.
Gross Margin compares the gross profit of a company to its net sales to show how much profit a company makes after paying its cost of goods sold:
Gross margin % = Gross income / Total revenue * 100
Operating Margin , sometimes known as the return on sales ratio, compares the operating income of a company to its net sales to determine operating efficiency:
Operating margin = Operating income / Revenue * 100%
Free Cash Flow Margin is a profitability ratio that compares a company's free cash flow to its revenue to understand the proportion of revenue that becomes free cash flow. The higher the percentage, the more cash is available from sales. A company that shows an increasing cash flow margin from year to year is certainly getting stronger with time. This is a good indicator of its probability for long-term success.
Free cash flow margin = Free Cash Flow / Total Revenue
Return On Assets measures how efficiently a company is using its assets to generate profit. A high ROA indicates that a company successfully converts invested money into income.
Return on assets = Net income before discontinued operations / Total average assets
Return On Equity measures how efficiently a company is using its equity to generate profit:
Return on equity = Net income / Shareholder’s equity
Revenue Growth refers to the increase in a company’s total revenue or income over a specific period
Revenue growth = (Current period revenue - previous period revenue) / Previous period revenue * 100%
Earnings Per Share Growth illustrates the growth of earnings per share over time.
Earnings per share growth = ( Current period EPS - previous period EPS ) / Previous period EPS * 100%
Operating Cash Flow Growth is the long term rate of growth of operating cash, the money that is actually coming into the bank from business operations.
Operating cash flow growth = ( Current period operating cash flow - previous period operating cash flow) / Previous period operating cash flow* 100%
Market Value Ratios
Market value ratios are used to evaluate the share price of a company’s stock.
Book Value Per Share calculates the per-share value of a company based on the equity available to shareholders. In case of the company liquidation, the book value per share shows the monetary value remaining for common shareholders after all assets are sold and all debt is paid. If a company’s Book value per share is higher than a market price of its share, then the stock may be considered undervalued.
Book value per share = Total common equity / Total common shares outstanding
Dividend Yield measures the amount of dividends attributed to shareholders relative to the market value per share:
Dividend yield = Dividends TTM for the primary issue excluding special dividends / Price of the primary issue
Diluted Earnings per Share (Diluted EPS)
EPS stands for earnings per share. Investors use EPS to measure how much money a company makes for every outstanding share the company has. Diluted EPS is slightly different in that it measures the earnings per share for a company if all convertible securities (such as preferred stocks, convertible debt instruments, stock options and warrants) were used to calculate the metric.
Earnings Line+Growth stock investors are concerned with Earnings per share that is growing, Sales (Revenue) that is growing and Increasing gross margins. This indicator helps view each of these parameters.
On the chart is Tesla (TSLA) gross margin (blue line) on a 12 trailing months basis (TTM). As you can see, TSLA's margins appear to be eroding.
The user selects one of the following parameters to display from the input drop down menu:
"EARNINGS_PER_SHARE_BASIC", "TOTAL_REVENUE", or "GROSS_MARGIN".
The value axis for your selection will appear on the left side of the chart.
The user also selects one of the following periods: "FY", "FQ" or "TTM" (Fiscal year, fiscal quarter or 12-trailing months). You have an option to display the inputs by checking the box. This is useful as a reminder but can be removed if the label is in the way.
The chart will render on any chart time scale, however longer time scales will probably be of more value. Weekly charts work well.
It is not possible to display more than one line simultaneously because of axis incompatibilities. However, it is possible to load this indicator multiple times and select different items in each. In this case additional left-side scales will be shown as well as additional lines. Common pairings are Revenue (Sales) and Earnings, or, Revenue and Gross Margin.
@ jmikes

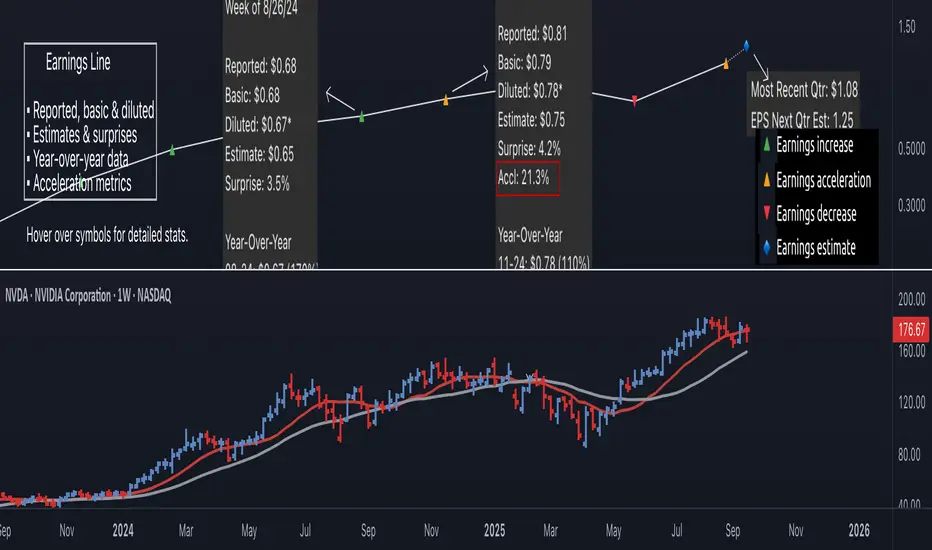
Earnings Line Pro - EPS Tracker [LevelUp]Earnings Line Pro plots quarterly earnings data, including earnings surprises and estimates, while also highlighting earnings acceleration. It allows you to track and visualize the trend of earnings across daily, weekly, and monthly timeframes.
🔹—— Key Features ——🔹
▪ Quarterly earnings per share, surprises and estimates.
▪ View earnings based on type: reported (non-GAAP), basic or diluted.
▪ Visualize the estimated trajectory of the next quarter earnings estimate.
▪ Year-Over-Year (YOY) data is included for each quarterly earnings summary.
▪ Visualize earnings acceleration, quarter over quarter.
▪ Plot on daily, weekly and monthly timeframes.
🔹—— Earnings Data ——🔹
Earnings are a foundational concept in stock analysis, often exerting a significant influence on a company's long-term performance. By visualizing earnings data as a plot rather than just a table of statistics, investors can more easily spot patterns of acceleration or deceleration. For instance, a steep upward slope between earnings releases — or a sequence of progressively higher earnings — signals a robust earnings trajectory. The sharper the acceleration, the greater the likelihood that the stock will outperform the broader market.
Historical studies show that top-performing companies consistently deliver steady earnings growth. Whether your focus is short-term trading or long-term investing, recognizing the direction and rate of earnings growth is essential for evaluating potential price movement.
While quarterly earnings data remains consistent across all timeframes, the perspective shifts depending on your goals. A monthly chart highlights multi-year growth and is ideal for investors with a buy-and-hold mindset. In contrast, weekly or daily charts have fewer data points, making them better suited for traders focused on positions lasting weeks or months.
🔹—— Choose Earnings Type ——🔹
With the Earnings Line indicator, you can view reported (non-GAAP), basic and/or diluted earnings.
▪ Reported (non-GAAP) earnings typically refer to a company’s net income as disclosed in its financial statements. This figure represents overall profitability after accounting for all expenses, taxes, and adjustments.
▪ Basic earnings per share (EPS) is calculated by dividing net income by the weighted average number of common shares outstanding during the reporting period. It provides a straightforward measure of earnings attributable to each existing share.
▪ Diluted earnings per share (EPS) goes a step further by incorporating the potential impact of additional shares from convertible securities, stock options, or warrants. This presents a more conservative, “what-if” scenario that assumes all possible dilution has occurred.
Reviewing these various types is important as they provide a bigger picture view of company performance: reported earnings show overall profitability, basic EPS reflects earnings per existing share, and diluted EPS highlights the potential impact of share dilution.
In the Settings dialog, select your preference on the earnings type. Check the box "Show Data For All Earnings Types" to view all types when hovering over an earnings data point.
🔹—— Year-Over-Year Data ——🔹
Viewing year-over-year (YOY) data for earnings is essential because it provides a clear picture of a company's growth trajectory by comparing current earnings to the same period in the prior year, helping to identify sustainable trends rather than short-term anomalies.
This metric helps eliminate seasonal fluctuations, offering a more accurate assessment of operational performance and efficiency improvements over time. Additionally, consistent YOY earnings growth can signal a company's competitive strength and potential for stock price appreciation, aiding in informed investment decisions.
🔹—— Earnings Acceleration ——🔹
Looking for earnings acceleration — where the rate of earnings growth is increasing — helps identify companies with strengthening momentum. This often reflects improving business operations, market expansion, or competitive advantages that can drive outsized returns. Viewing acceleration data can help you spot potential leaders early while avoiding stocks with flat or slowing earnings that may underperform the market.
🔹—— Visualize Earnings Estimate ——🔹
At a glance, view the next-quarter estimate to gauge the likely direction of the earnings trend. These forward-looking insights provide an early view of a company’s expected financial performance and can help anticipate potential stock price movements depending on whether actual results meet, exceed, or miss expectations.
The estimates — often based on analyst consensus — reflect market sentiment and can highlight both growth opportunities and risks.
🔹—— Plot Earnings Line On Main Chart ——🔹
By default, earnings data is plotted in a separate pane below the main chart. Follow the steps below to plot the earnings line on the main chart.
▪ Click on the indicator name on left side of the chart.
▪ Select the "..." option.
▪ Use the "Move-to" option to change the location of the earnings line.
▪ To hide the EPS scale on the left, select the "..." option.
▪ In "Pin to scale" select the "No scale (fullscreen)" option.
🔹—— Best Practices ——🔹
▪ Compare year-over-year, not just quarter-over-quarter as YOY changes help filter out seasonality.
▪ Positive surprises can spark strong price reactions, recurring surprises strengthen confidence.
▪ Look for divergence. If earnings accelerate but price lags, it may signal an early opportunity.
▪ Review daily, weekly, and quarterly charts to align short and long-term trends.
▪ Combine fundamentals with technicals, including volume analysis.
▪ Always define risk before entering a trade — know where you’ll exit.
▪ Size positions based on volatility and conviction, not emotion.
▪ Be patient — trends take time to develop.
Paid script
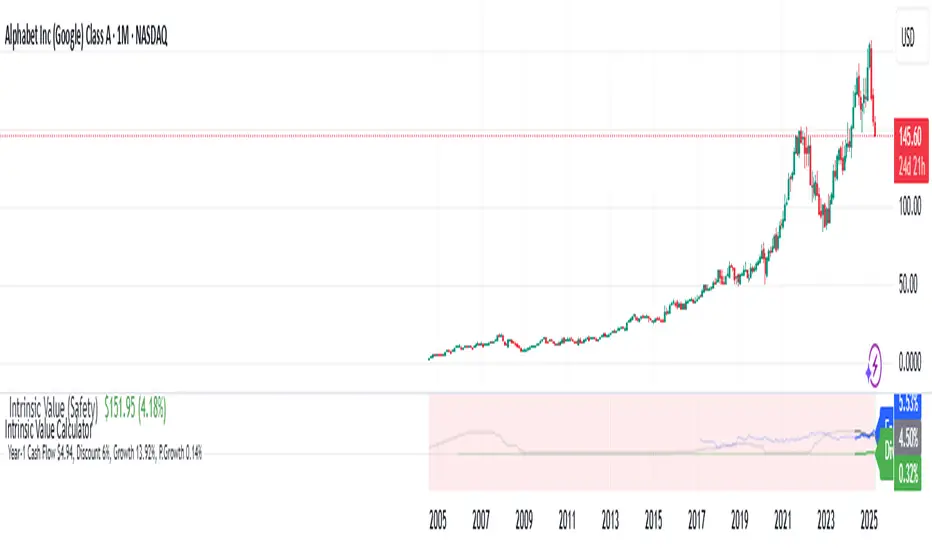
Intrinsic Value Calculator - Earnings/Dividend Yield (%)
This Intrinsic Value Calculator is a stock valuation Calculator that uses proven and science-based valuation methods to automatically estimate the intrinsic value of stocks.
What Is Intrinsic Value?
Intrinsic value is a measure of what a company's stock is worth. Intrinsic value is different from the current market price of a stock. However, comparing it to that current price can give investors an idea of whether the stock is undervalued or overvalued.
How to Calculate Intrinsic Value
To calculate the intrinsic value of a stock, we use two valuation methods: Discounted Cash Flow (DCF) Valuation and Relative Valuation. We take the average of these two methods to estimate the intrinsic value as accurately as possible.
Using Discounted Cash Flow (DCF) analysis, cash flows are estimated based on how a business may perform in the future. Those cash flows are then discounted to today’s value to obtain the company's intrinsic value. The discount rate we used is a risk-free rate of return (Fixed Deposit Interest Rate).
While intrinsic valuation models see to value a business by looking only at the company on its own, relative valuation models seek to value a business by comparing the company to other Low-Risk investment opportunities, Fixed Deposit Return.
Line Graph : Earnings Yield vs Fixed Deposit Interest Rate vs Dividend Yield
Other than automatically estimating the intrinsic value of a stock, this script would plot the Earnings Yield, Fixed Deposit Interest, and Dividend Yield of a stock.
Investors should monitor Earnings Yield, Fixed Deposit Interest, and Dividend Yield of a stock for a few key reasons:
Earnings Yield:
Earnings Yield is a crucial metric that provides insight into a company's profitability. It is calculated by dividing the company's earnings per share (EPS) by the current stock price. A higher Earnings Yield indicates that the company is generating more profit for each dollar invested by shareholders. This metric is particularly useful when comparing a company's profitability against other investment options, such as fixed deposits, bonds, or other stocks.
Fixed Deposit Interest:
The Fixed Deposit Interest Rate, also known as the risk-free rate, is the return an investor can expect from investing in a risk-free asset such as a government bond or a fixed deposit. This rate serves as a benchmark for evaluating the returns offered by other investments, including stocks.
Dividend Yield:
Dividend Yield is a measure of the annual dividend income received by an investor relative to the stock price. It is calculated by dividing the annual dividend per share by the current stock price. Dividend-paying stocks often appeal to income-oriented investors seeking regular cash flow.
Monitoring these metrics can help investors make informed decisions about their investments, assess the relative attractiveness of different investment options, and manage their investment portfolios effectively.
Key Financial Ratio display
Key investment ratios play a crucial role in helping investors make informed investment decisions. By providing valuable insights into a company's financial health, ratios such as the Gross Margin, R&D Ratio, Net Margin, Return on Equity (ROE) Ratio allow investors to quickly assess a company's profitability, liquidity, and financial stability.
Gross margin is the percentage of a company's revenue that it retains after direct expenses, such as labor and materials, have been subtracted. Gross margin is an important profitability measure that looks at a company's gross profit compared to its revenue.
The Research & Development (R&D) to Sales Ratio is a measure to compare the effectiveness of R&D expenditures between companies in the same industry. It is calculated as R&D expenditure divided by Total Sales.
The net profit margin, or simply Net Margin , measures how much net income or profit is generated as a percentage of revenue. It is the ratio of net profits to revenues for a company or business segment.
The Return on Equity (ROE) Ratio is a measure of a company's profitability and efficiency in using its shareholders' investments to generate profits. It's calculated by dividing a company's net income by its shareholder's equity. This ratio is a reflection of how well a company is utilizing its shareholders' capital to generate returns.
The Operating Cash to Debt Ratio measures the percentage of a company's total debt that is covered by its operating cash flow for a given accounting period. If the company’s ratio were higher, it would indicate a strong fiscal position, considering its cash flow from operations is higher than its total debt.
Free Cash Flow Margin is a significant financial metric that measures a company's ability to generate cash from its operations after accounting for capital expenditures. It evaluates the percentage of free cash flow relative to total revenue. A high Free Cash Flow margin suggests that a company is efficient at converting its revenue into cash flow.
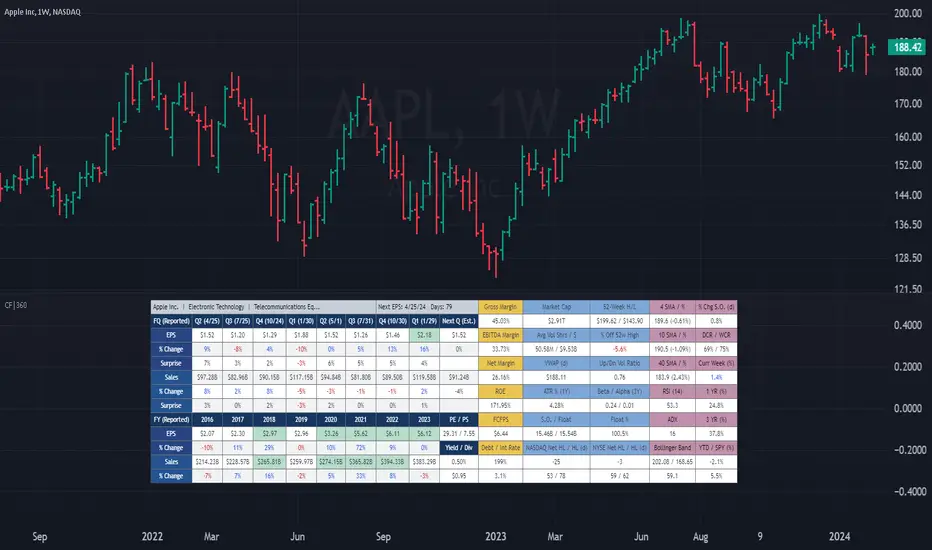
(CF|360) Caruso Financial DashboardThe Caruso Financial 360 Dashboard (CF|360) revolutionizes your TradingView charts by seamlessly integrating comprehensive Fundamental, Statistical, Technical, Performance, and Event information into an intuitively organized dashboard. This empowers users to make informed investment decisions effortlessly, eliminating the need to switch between pages or applications.
The dashboard is strategically divided into five distinct sections, each color-coded for user-friendly navigation. A quick glance at the dark blue "Fundamentals" table reveals two years of quarterly EPS and Sales data, YoY % change, and Surprise %, complete with report dates. Users can explore eight years of annual data and choose between Non-GAAP EPS, Diluted EPS, and Basic EPS for versatile analysis. Opting for Non-GAAP EPS also unveils next quarter estimates. The Fundamentals section further encompasses P/E and P/S data, alongside TTM dividend and dividend yield information.
In the yellow "Extended Fundamentals" section, users gain insights into Gross, EBITDA, and Net margins for easy profitability comparisons within the same industry group. Return on Equity data and Free Cashflow per share provide perspectives on profitability, efficiency, and financial flexibility.
The light blue "Statistics" section furnishes essential statistical measures for a rapid grasp of a company's trading characteristics. Metrics such as Market Cap, Average Volume per day (Shares and $ value), VWAP, Up/Down volume ratio, ATR%, Alpha, Beta, Shares Outstanding & Float, 52-week High/Low, and % distance from the 52-week high are presented. Additionally, market breadth is depicted through Nasdaq and NYSE 52-week high/low data.
The purple "Technical & Performance" section seamlessly integrates both Technical Analysis data and Performance statistics, enabling users to assess the stock's technical context and performance against the market over different periods. Technical indicators, including three customizable moving average types, RSI, ADX, Bollinger Band, Keltner Band, and daily and weekly closing ranges, are featured.
The grey top "Events" section offers a quick overview of the next earnings release date, countdown, and associated color changes as the date approaches. Company name, sector, and industry details are also presented.
To enhance information visibility, record EPS and Sales data are highlighted, emphasizing new records, along with highlights for new 52-week highs and lows.
The CF|360 offers customization options , including three display styles for Desktops, Desktop Slim, and Mobile devices.
Users can also tailor the lengths of technical indicators to suit their preferences. International market enthusiasts will appreciate that the CF|360 provides financial and market data for various regions, including the US, EU, Canada, and beyond.
88 Metrics Included:
Fundamentals Section (Dark Blue Group)
EPS (Adjusted Non-GAAP, Diluted, Basic)
- Quarterly, YoY % Chg, Surprise, Report Date, Next Quarter Estimate (Adjusted EPS only)
- Annual, YoY % Chg
Sales
- Quarterly, YoY % Chg, Surprise, Report Date, Next Quarter Estimate
- Annual, YoY % Chg
P/E ratio
P/S ratio
Dividend TTM
Dividend TTM Yield
Fundamentals Extended (Yellow Group)
Gross Margin
EBITDA Margin
Net Margin
Return on Equity (ROE)
Free Cashflow per Share (FCFPS)
Debt to Equity (Debt)
Effective Interest Rate (Int Rate)
Statistics (Light Blue Group)
Market Cap
Average Daily Volume (Shares)
Average Daily Volume (Dollar Value)
VWAP (Daily)
Average True Range Percent
Shares Outstanding
Shares in Float
Percentage of Share in Float
52-Week High
52-Week Low
% off of 52-Week High
Up / Down Volume Ratio
Beta
Alpha
Nasdaq Net 52-Week High/Lows
Nasdaq 52-Week Highs
Nasdaq 52-Week Lows
NYSE Net 52-Week High/Lows
NYSE 52-Week Highs
NYSE 52-Week Lows
Technical & Performance (Purple Group)
Moving Average Value (3 different averages)
Distance from Moving Average (3 different averages)
Relative Strength Index (RSI)
Average Directional Index (ADX)
Bollinger Band Value (Upper/Lower)
%b
Keltner Band Value (Upper/Lower)
%k
Percentage Changes Since Today’s Open
Daily Closing Range (DCR)
Weekly Closing Range (WCR)
Current Week % Change
1 Month % Change
3 Month % Change
6 Month % Change
1 Year % Change
3 Year % Change
YTD % Change
S&P 500 YTD % Change
Name, Group, & Events (Grey Section)
Company Name
Sector
Industry
Next Earnings Date
Days Until Next Earnings Date
Event Highlights
Record EPS (Quarterly/Annual)
Record Sales (Quarterly/Annual)
52-Week High
52-Week Low
Layout Types
Desktop
Get the full experience with the Desktop view.
Desktop Slim
Save screen real estate with a slim version of the dashboard.
Mobile
Take the most vital metrics with you on your mobile device. For the best experience, view in landscape mode.
Earnings CountdownSince TradingView for some reason removed the small UI element in the symbol details window showing the amount of days left til a company releases its next earnings report, I decided to make my own.
A simple script with options for choosing the position and at what amount of days left the displayed color should change to red (mimicking the old feature).
I would suggest placing the indicator somewhere else than the main price chart, since it will be difficult to place it somewhere where it doesn't obscure something. Default is bottom and right since I place it on a separate volume indicator where the number is clearly visible.

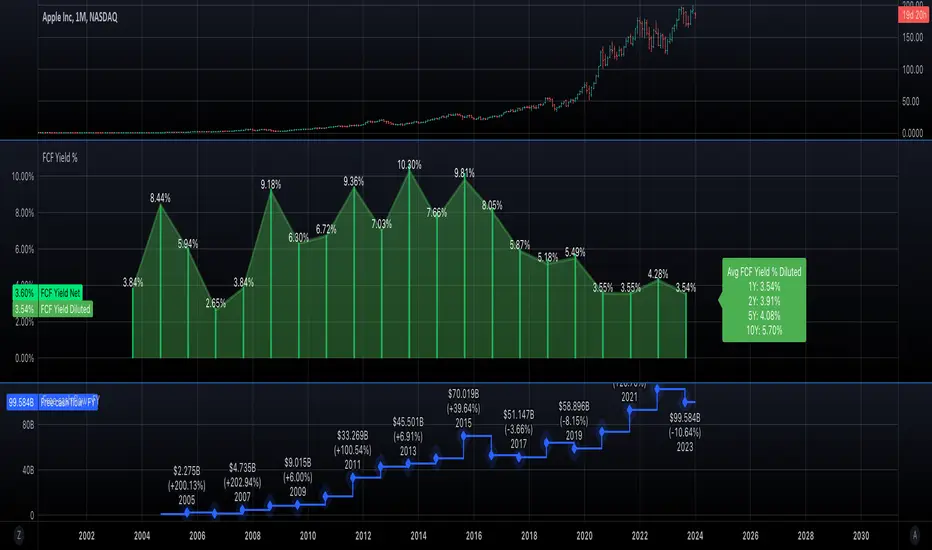
Free cash flow yieldThis script shows
- FCF Yield Net based on enterprise value. See reference: www.investopedia.com
- FCF Yield Diluted: which reduced CFC net by dilution amount.
- FCF % change.
This should give you a good overview on how well the company is at growing FCF and how efficiently they are creating FCF.