Gold THB per Baht (XAU -> Thai baht gold)What it does
This indicator converts international gold prices (XAU) into Thai retail “baht gold” price (THB per 1 baht gold weight) in real time. It multiplies the XAU price (per troy ounce) by USD/THB and converts ounces to Thai baht-weight using the exact gram ratios.
Formula
THB per baht gold = XAU (USD/oz) × USDTHB × (15.244 / 31.1035) × (1 + Adjustment%) + FlatFeeTHB
1 troy ounce = 31.1035 g
1 Thai baht gold = 15.244 g
Conversion factor ≈ 0.490103
Educational

SH/SL with Trend TableHelps in identify Swing High and Swing Low in chart time frame.
Trend is also mentioned in Chart.

True Previous Day/Week High & LowTrue Previous Day/Week High & Low
What makes this indicator unique:
Unlike most previous day high/low indicators that only track SESSION data (e.g., 6:00 PM - 5:00 PM for futures), this indicator calculates the TRUE calendar day high and low from MIDNIGHT TO MIDNIGHT (00:00 - 23:59) in New York time.
Why this matters:
- Session-based indicators miss crucial price action that occurs during overnight hours
- True midnight-to-midnight calculation gives you the ACTUAL daily range
- Essential for traders who need accurate previous day levels for support/resistance
- Works perfectly on 24-hour markets like futures (NQ, ES, YM, etc.)
Features:
✓ True calendar day high/low (00:00-23:59 NY time)
✓ Previous week high/low
✓ Customizable line colors, widths, and styles (solid, dashed, dotted)
✓ Optional labels with adjustable size, color, and spacing
✓ Values displayed on price scale
✓ Toggle individual levels on/off
✓ Optimized for 1-minute charts but works on all timeframes
Perfect for:
- Futures traders (NQ, ES, YM, RTY)
- Day traders using previous day levels as key support/resistance
- Swing traders tracking weekly ranges
- Anyone who needs accurate 24-hour high/low levels
Settings are clean and intuitive - just add to your chart and customize the appearance to match your setup!

Prev Daily Closes — Prev1 & Prev2 (intraday) RAJESH MAYEKARit gives last 2 days close line. when last 2 days close broke you get momentum for BTST

AutoPivot Levels with Alerts [ChartWhizzperer] – Dynamic EditionAuto-Pivot Levels 4 methods with alerts – Dynamic Edition
Now with
- Live Mode
- 4 Pivot Methods
- 7 Session Types (5m, 15m, 30m, Hourly, Daily, Weekly, Monthly)
- PineConnector-Ready Alerts!
Free, Open Source, Pine Script v6-compliant.
NEW: Live Mode (Ultra-Dynamic, Repainting) – Switchable in UI!
Instantly switch between Classic (session-based, repaint-free) and Live (rolling window, real-time, repainting) using the simple checkbox in the settings!
Live Mode recalculates all pivots on every tick/bar, using the current high/low/close for the chosen session (5m, 15m, 30m, hourly, daily, weekly, monthly).
Perfect for:
- Scalping and high-frequency trading
- Real-time bot/automation setups (PineConnector-ready)
- Fast-moving or breakout markets
Classic Mode: For traditional, stable levels based on confirmed session data – ideal for backtesting and trading history.
Four Calculation Methods (Choose What Fits YOU)
1. Classic
Standard pivot calculation.
Based on previous session’s High, Low, Close.
Simple, proven, and suitable for any asset.
2. Fibonacci
Projects levels using Fibonacci ratios of the prior session’s range.
Great for traders who want to align pivots with fib retracements and extensions.
3. Camarilla
Uses unique multipliers for support/resistance, focusing on mean reversion and volatility.
Popular among futures and forex day traders.
4. Woodie
Puts extra weight on previous Close for more responsive pivots.
Often used in trending or choppy conditions.
Switch methods anytime in the UI – the script recalculates instantly and keeps your chart clean!
Level-Specific Alerts – PineConnector Ready!
Dedicated alert for EVERY level and direction (Up/Down):
Pivot (P), R1, R2, R3, S1, S2, S3
No configuration hassle:
All alerts are pre-defined in the TradingView Alert Panel and work across all session types (5m → monthly).
Machine-readable message format:
PIVOT=R1 DIR=UP SYMBOL={{ticker}} PRICE={{close}}
Direct plug-and-play with PineConnector, webhooks, Discord, Telegram, bots, and other automation tools.
Never miss a breakout, reversal, or key support/resistance touch!
Powerful Customization & Performance
- Session selection: 5m, 15m, 30m, Hourly, Daily, Weekly, Monthly (choose what suits your trading style).
- Show/hide any level (Pivot, R1–R3, S1–S3) for minimal chart clutter.
- Color selection for each level to match your theme or highlight key pivots.
- Auto-cleanup: Old lines and labels are cleared on every recalculation or session change for maximum performance and visual clarity.
- Zero runtime errors: Strict Pine Script v6 practices for stability.
How To Use – Quick Start
1) Add the indicator to your TradingView chart.
2) Pick your calculation method (Classic, Fibonacci, Camarilla, Woodie).
3) Set session type (5m, 15m, 30m, Hourly, Daily, Weekly, Monthly).
4) Switch between Classic and Live Mode with a single click in settings.
5) Customize your levels (on/off, colors).
6) Open the Alert Panel, select any pre-configured alert (e.g. "R2 Cross Down"), and go live!
7) Connect with PineConnector or any webhook system instantly using the pre-formatted alert messages.
Who Is It For?
- Active scalpers & bot traders: Live Mode + PineConnector-ready alerts = instant, automated reactions.
- Swing and position traders: Use Classic Mode for stable, repaint-free levels.
- Strategy developers: Seamless integration into automated and manual trading workflows.
License & Community
Open Source, Non-Commercial:
Free for personal & educational use under CC BY-NC-SA 4.0.
Feedback, bug reports & ideas:
Drop a comment, or contact me for feature requests.
Trade smart. Trade dynamic. Unlock the true power of pivots – with ChartWhizzperer!

Apertura SemanalIdentifica las aperturas semanales de cada grafico y resalta las aperturas mensuales

OSPL Ichimoku + Multi-Trend DashboardOSPL Ichimoku + Multi-Trend Dashboard
A professional multi-indicator trend analyzer that fuses Ichimoku Cloud with volume, momentum, and price-based confirmations — all visualized in a dynamic dashboard.
🔍 Overview
The OSPL Ichimoku + Multi-Trend Dashboard is a comprehensive market-structure and momentum visualization tool built for serious traders who value clarity, precision, and confirmation.
It combines the powerful Ichimoku Cloud system with VWMA, SuperTrend, RSI, and VWAP to provide a 360-degree view of market direction, trend strength, and trade zones.
This indicator allows traders to instantly read multi-indicator alignment through a color-coded dashboard, helping filter out noise and improve timing for entries and exits.
⚙️ Core Features
🟢 1. Ichimoku Cloud Framework
Displays all major Ichimoku elements: Tenkan-Sen, Kijun-Sen, Senkou Span A & B (Kumo Cloud).
Detects Bullish and Bearish Tenkan-Kijun Crossovers.
Identifies Cloud Trend Bias (price above, below, or inside the Kumo).
Marks Buy / Sell / Wait Zones automatically based on price structure and line alignment.
⚡ 2. Multi-Indicator Confirmation Layer
Enhance trend validation using:
VWMA (Volume-Weighted Moving Average): Measures volume-driven price trend.
SuperTrend: Uses ATR to confirm trend direction and detect reversals.
RSI (Relative Strength Index): Gauges market momentum — above 50 indicates bullish bias, below 50 bearish.
VWAP (Volume-Weighted Average Price): Tracks institutional and fair value price zones.
Each of these indicators contributes to a synchronized dashboard view that instantly reveals market bias.
📊 3. Interactive Dashboard Display
Clean, modern bottom-right table summarizing indicator values and their current trend status.
Color-coded trend map:
🟢 Green = Bullish 🔴 Red = Bearish 🟡 Yellow = Neutral / Wait
Quick visual reference — ideal for active traders who rely on multiple confirmations before taking trades.
🌥 4. Kumo Visualization
Smoothly shaded Ichimoku Cloud fill highlights dominant market phase (bullish or bearish).
Dynamic transition coloring enhances visibility of potential breakouts or reversals.
🎯 How to Use
Use the dashboard as a trend alignment and confirmation tool:
Bullish Confluence Example:
Price above Kumo Cloud
Tenkan-Sen > Kijun-Sen
RSI > 50
SuperTrend below price
VWMA and VWAP trending upward
Bearish Confluence Example:
Price below Kumo Cloud
Tenkan-Sen < Kijun-Sen
RSI < 50
SuperTrend above price
VWMA and VWAP trending downward
When most indicators align in the same direction, the system provides high-probability trade zones.
It can be used across all timeframes, from intraday scalping to multi-day swing trading.
🧩 Why Use This Indicator
✅ Filters false signals by combining multiple trend tools.
✅ Eliminates the need to switch between multiple indicators.
✅ Offers an at-a-glance visual assessment of overall market bias.
✅ Adaptable to any asset: stocks, indices, forex, commodities, or crypto.
✅ Ideal for traders using trend-following, momentum, or confirmation-based strategies.
🧠 Professional Tips
Combine the dashboard signals with price action and volume breakouts for enhanced accuracy.
Use higher timeframe Ichimoku structure as a directional filter (e.g., check the 1-hour trend while trading on 15-minute).
Apply ATR-based stop loss and multi-timeframe confluence to further strengthen entries.
Works exceptionally well with Heikin Ashi candles for smoother visual trends.
💡 Suggested Use Cases
Intraday & Swing Trading
Trend Continuation & Reversal Identification
Multi-Indicator Confirmation System
Dashboard-Style Strategy Testing and Backtesting
⚠️ Disclaimer
This indicator is designed for educational and analytical purposes only.
It is not financial advice and does not guarantee profitability.
Always perform independent analysis and apply prudent risk management before executing trades.

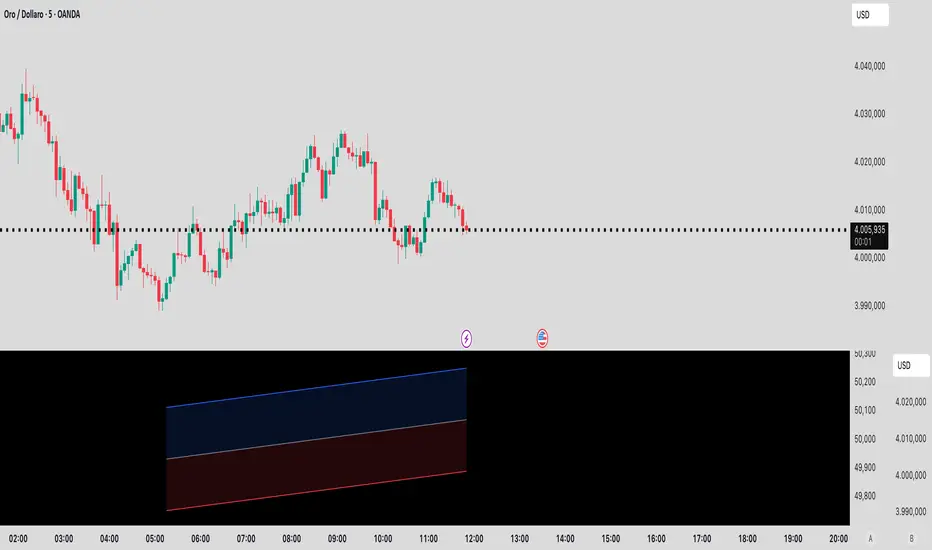
Custom Background color Blank Visual Panel – For Overlays, Text This indicator creates a clean, customizable visual panel in a separate chart area (pane), designed to act as a background layer for other indicators that output text, statistics, labels, or custom graphics.
It allows you to:
Choose any background color (for better contrast or layout design)
Optionally extend the color to the entire chart (including main price area)
Display a customizable horizontal line (position, thickness, and color)
Simulate full background extension into the future using a thick horizontal line — a workaround for TradingView’s limitation where bgcolor() cannot fill future bars
📌 Important: To properly view other indicators above this background panel, you may need to adjust the visual stacking order manually using the Object Tree in TradingView (right-click → "Object Tree").
🧩 Ideal for:
Overlaying custom Pine indicators (with plottext, label, etc.)
Building clean dashboards for signal monitoring or data outputs
Creating visual separation or focus zones in your chart layout
🔍 Note: This indicator does not show any market data, and is intentionally minimal.
Use it as a visual base panel to support your custom tools.
📷 The example image is for demonstration purposes only – it includes a personal custom indicator added on top of this panel.
Pannello Visivo Vuoto – Per Testo, Overlay e Dashboard Personalizzate
Questo indicatore crea un pannello visivo pulito e personalizzabile in un’area secondaria del grafico, pensato per fungere da sfondo neutro su cui sovrapporre altri indicatori che mostrano testo, statistiche, etichette o output grafici personalizzati.
Ti permette di:
Scegliere liberamente il colore di sfondo (per contrasto o layout)
Estendere opzionalmente il colore all’intero grafico (zona candele inclusa)
Aggiungere una linea orizzontale personalizzabile (livello, spessore, colore)
Simulare un’estensione visiva dello sfondo nel futuro tramite una linea orizzontale molto spessa — utile per aggirare il limite di TradingView che non permette a bgcolor() di colorare le barre future
📌 Importante: per visualizzare correttamente altri indicatori sopra questo pannello di sfondo, potrebbe essere necessario regolare manualmente la priorità visiva tramite l’Albero Oggetti di TradingView (tasto destro → "Albero oggetti").
✅ Ideale per:
Sovrapporre indicatori Pine personalizzati (con testo, label, ecc.)
Costruire dashboard di controllo per segnali o dati
Creare zone visive pulite per separare o mettere in evidenza elementi
ℹ️ Nota: questo indicatore non mostra alcun dato di mercato ed è volutamente minimale.
Usalo come base visiva di supporto per i tuoi strumenti personalizzati.
📷 L’immagine di esempio ha solo scopo dimostrativo – include un mio indicatore personale sovrapposto al pannello.
Yield Curve Phase Signal - Macro OpticsThe Yield Curve Phase Signal identifies where we are in the 10s–2s curve by detecting pivots and classifying each span as Bull Steepening, Bear Steepening, Bear Flattening, or Bull Flattening with clear background shading and date labels.
A live table tracks 10-year and 2-year yield performance across current, previous, 1-week, 1-month, and 3-month windows, plus the curve delta, so you can see phase shifts in real time.
Use the chart, table, and the Yield Curve Phase Signal PDF presentation slides together to spot regime transitions that tend to precede rotations across equities, rates, and risk assets.
To get your copy of the pdf slides that go with this indicator, go to macro-optics.com

Smart Risk - Three Institutional Models📘 Smart Risk – Three Institutional Entry Models
A precision-engineered institutional framework that blends liquidity, structure, and multi-time-frame confirmation.
🧠 Concept Overview
The Smart Risk indicator models how institutional traders and algorithms engineer entries around liquidity, imbalance, and structural shifts .
It unifies t hree distinct institutional entry models —each built around core Smart Money Concepts (SMC)—and enhances them with a Multi-Time-Frame Confluence (MTF) engine for directional alignment.
This tool doesn’t simply merge indicators.
It connects l iquidity sweeps, order-block reactions, breaker validation, and fair-value-gap mitigation into one cohesive trading logic—filtering every setup through trend, structure, and volume confirmation.
⚙️ How It Works
Setup #1 – Liquidity Sweep + Order Block Revisit + FVG Mitigation
Identifies engineered stop-hunts where price sweeps external liquidity and returns to a prior Order Block or Fair Value Gap (FVG).
Signals reversal-style entries with high probability of mean-reversion or mitigation.
Setup #2 – Supply/Demand + Mitigation / Breaker / FVG Continuation
Captures continuation trades inside trending structure.
When trend bias (via moving-average context) aligns with breaker or mitigation blocks, signals confirm institutional continuation sequences.
Setup #3 – Sweep + Classic FVG Reaction
Tracks clean displacement gaps following a liquidity sweep—ideal for scalpers and intraday reversals where imbalances act as magnets for price.
Each setup can be independently enabled or disabled from the panel.
A built-in signal-cooldown prevents repetitive triggers on the same leg.
🕒 Multi-Time-Frame Confluence
The new MTF module aligns lower-time-frame precision entries with higher-time-frame market structure.
When enabled, each setup only validates if the HTF trend confirms the same directional bias as the LTF pattern—e.g. a 5-minute bullish FVG signal requires a bullish 1-hour structure.
This ensures institutional logic respects global liquidity flow and avoids counter-trend traps.
MTF Controls:
• ✅ Enable MTF Confluence toggle
• ⏱️ Lower Time-Frame (LTF) selector (default 5 min)
• ⏱️ Higher Time-Frame (HTF) selector (default 1 hour)
• 🔄 Automatic SMA-based HTF trend detection
🎨 Visualization & Dashboard
• Order Block / Supply–Demand Zones — highlight institutional footprints
• Fair Value Gaps (FVGs) — reveal displacement inefficiencies
• Liquidity Sweeps (X / $) — mark engineered stops
• BOS & CHoCH — confirm structure continuation or reversal
• Compact Dashboard — live “Armed” state for each setup and MTF bias
Color-coded background cues emphasize active trade phases without clutter.
🧩 Core Algorithm Highlights
• Dynamic swing and pivot structure detection
• Breaker / Mitigation / Volume confirmation filters
• Fair-Value-Gap logic with directional alignment
• Cooldown control for signal throttling
• Multi-Time-Frame bias filter for contextual precision
⸻
📈 How to Use
1. Apply indicator to any asset or timeframe.
2. Select which institutional setups you want active.
3. Optionally enable MTF Confluence (5 min → 1 hr recommended).
4. Wait for BOS/CHoCH confirmation + zone alignment before entry.
5. Use OB and FVG zones for entry/exit planning with risk management.
⸻
💡 Originality Statement
This script introduces a multi-layered institutional logic engine that merges liquidity, mitigation, and imbalance behavior into a unified framework—augmented with time-frame synchronization and signal-cooldown management.
All logic, calculations, and visualization structure were built from scratch for this model.
It is not a mash-up of existing public indicators and offers measurable analytical value through MTF-aware trade validation.
⸻
⚠️ Disclaimer
This tool is intended for educational and analytical purposes only.
It does not provide financial advice or guaranteed trading outcomes.
Always back-test, validate setups, and apply proper risk management.

YUSUF LOG 1.denemeThis indicator integrates multiple data points and uses them together to generate auxiliary buy or sell signals. It relies on volume, overbought/oversold signals, and moving averages. It should not be used alone but rather as part of a broader strategy to aid in decision-making.
Indicador Multi-Estrategia - ComunidadMulti-indicator designed for use by TradingView users with a free account. The intention is to support users who are just starting out in the world of crypto trading.

TradeBee Vol-Pr SentimentThis indicator analyzes volume-weighted price sentiment and short-term scalp potential. It calculates buying vs. selling pressure based on intrabar price positioning and overlays a sentiment label ("Buy", "Sell", or "WAIT") depending on price behavior relative to a moving average. Additionally, it detects scalp setups using percent movement, slope, and volume acceleration — ideal for short-term momentum traders.
The sentiment and scalp signals are displayed in a floating table on the chart, with customizable position and label size.
- Vol-Price Sentiment:
"Buy" → Price above MA and buying pressure dominant
"Sell" → Price below MA and selling pressure dominant
"WAIT" → No clear bias
- Scalp Signal:
"Long Scalp" → Strong upward move with slope and volume confirmation
"Short Scalp" → Strong downward move with slope and volume confirmation
"No Setup" → No qualifying scalp conditions
Its optimal to have Wait/Buy and Long Scalp showing when entering a trade.

Volume-Price Shift Box (Lite Version)Description
This indicator is a clean and intuitive visual tool designed to help traders quickly assess the current balance of bullish and bearish forces in the market.
It combines volume, price movement, VWAP, and OBV dynamics into a compact on-chart table that updates in real time.
This version focuses on the core logic and visualization of momentum and volume shifts, making it ideal for traders who want actionable insight without complex configuration.
How It Works
The script measures the combined strength of multiple market components:
VWAP trend indicates price bias relative to fair value.
OBV (On-Balance Volume) tracks volume flow to confirm or contradict price movement.
Volume ratio compares current volume to its recent average.
Momentum evaluates directional price movement over a configurable lookback period.
Accumulation / Distribution (A/D) Line estimates buying or selling pressure within each candle:
↑ — A/D is rising (buying pressure is increasing)
↑↑ — A/D is rising faster than before (acceleration of buying)
↓ — A/D is falling (selling pressure is increasing)
↓↓ — A/D is falling faster than before (acceleration of selling)
Each of these components contributes to an overall shift score.
Depending on this score, the box displays:
🟢 Bullish Shift — strong upward alignment
🔴 Bearish Shift — downward alignment
⚪ Neutral — mixed or indecisive conditions
Key Features
Compact on-chart information box with color-coded parameters
Combined volume-price relationship model
Configurable lookback and sensitivity controls
Real-time shift strength and trend duration tracking
Adjustable EMA/SMA smoothing for all averages
Lightweight design optimized for clarity
Inputs Overview
Box Position / Size – Place and scale the on-chart info box
Lookback Period – Number of bars used for calculations
VWAP Lookback – Period for VWAP distance smoothing
Shift Sensitivity – Adjusts reaction strength of bullish/bearish shifts
Neutral Zone Threshold – Defines when the market is considered neutral
EMA or SMA – Choose exponential or simple moving averages
Component Weights – Set the influence of VWAP, OBV, Volume, and Momentum on the shift score
Display Toggles – Enable or disable metrics shown in the box (Strength, Volume, VWAP, Duration, OBV)
How to Use
Apply the indicator to any symbol and timeframe.
Observe the box on the chart — it updates dynamically.
Look for transitions between Neutral → Bullish or Neutral → Bearish shifts.
Combine with your existing price action or confirmation tools (e.g., support/resistance, trendlines).
Use the “Strength” and “Duration” values to assess consistency and momentum quality.
(This indicator is not a buy/sell signal generator — it is designed as a contextual analysis and confirmation tool.)
How It Helps
Merges several key volume and price metrics into a single view
Highlights transitions in market control between buyers and sellers
Reduces clutter by presenting only relevant context data
Works on any market and timeframe, from scalping to swing trading
⚠️Disclaimer:
This script is provided for educational and informational purposes only. It is not financial advice and should not be considered a recommendation to buy, sell, or hold any financial instrument. Trading involves significant risk of loss and is not suitable for every investor. Users should perform their own due diligence and consult with a licensed financial advisor before making any trading decisions. The author does not guarantee any profits or results from using this script, and assumes no liability for any losses incurred. Use this script at your own risk.


Cora Combined Suite v1 [JopAlgo]Cora Combined Suite v1 (CCSV1)
This is an 2 in 1 indicator (Overlay & Oscillator) the Cora Combined Suite v1 .
CCSV1 combines a price-pane Overlay for structure/trend with a compact Oscillator for timing/pressure. It’s designed to be clear, beginner-friendly, and largely automatic: you pick a profile (Scalp / Intraday / Swing), choose whether to run as Overlay or Oscillator, and CCSV1 tunes itself in the background.
What’s inside — at a glance
1) Overlay (price pane)
CoRa Wave: a smooth trend line based on a compound-ratio WMA (CRWMA).
Green when the slope rises (bull bias), Red when it falls (bear bias).
Asymmetric ATR Cloud around the CoRa Wave
Width expands more up when buyer pressure dominates and more down when seller pressure dominates.
Fill is intentionally light, so candlesticks remain readable.
Chop Guard (Range-Lock Gate)
When the cloud stays very narrow versus ATR (classic “dead water”), pullback alerts are muted to avoid noise.
Visuals don’t change—only the alerting logic goes quiet.
Typical Overlay reads
Trend: Follow the CoRa color; green favors long setups, red favors shorts.
Value: Pullbacks into/through the cloud in trend direction are higher-quality than chasing breaks far outside it.
Dominance: A visibly asymmetric cloud hints which side is funding the move (buyers vs sellers).
2) Oscillator (subpane or inline preview)
Stretch-Z (columns): how far price is from the CoRa mean (mean-reversion context), clipped to ±clip.
Near 0 = equilibrium; > +2 / < −2 = stretched/extended.
Slope-Z (line): z-score of CoRa’s slope (momentum of the trend line).
Crossing 0 upward = potential bullish impulse; downward = potential bearish impulse.
VPO (stepline): a normalized Volume-Pressure read (positive = buyers funding, negative = sellers).
Rendered as a clean stepline to emphasize state changes.
Event Bands ±2 (subpane): thin reference lines to spot extension/exhaustion zones fast.
Floor/Ceiling lines (optional): quiet boundaries so the panel doesn’t feel “bottomless.”
Inline vs Subpane
Inline (overlay): the oscillator auto-anchors and scales beneath price, so it never crushes the price scale.
Subpane (raw): move to a new pane for the classic ±clip view (with ±2 bands). Recommended for systematic use.
Why traders like it
Two in one: Structure on the chart, timing in the panel—built to complement each other.
Retail-first automation: Choose Scalp / Intraday / Swing and let CCSV1 auto-tune lengths, clips, and pressure windows.
Robust statistics: On fast, spiky markets/timeframes, it prefers outlier-resistant math automatically for steadier signals.
Optional HTF gate: You can require higher-timeframe agreement for oscillator alerts without changing visuals.
Quick start (simple playbook)
Run As
Overlay for structure: assess trend direction, where value is (the cloud), and whether chop guard is active.
Oscillator for timing: move to a subpane to see Stretch-Z, Slope-Z, VPO, and ±2 bands clearly.
Profile
Scalp (1–5m), Intraday (15–60m), or Swing (4H–1D). CCSV1 adjusts length/clip/pressure windows accordingly.
Overlay entries
Trade with CoRa color.
Prefer pullbacks into/through the cloud (trend direction).
If chop guard is active, wait; let the market “breathe” before engaging.
Oscillator timing
Look for Funded Flips: Slope-Z crossing 0 in the direction of VPO (i.e., momentum + funded pressure).
Use ±2 bands to manage risk: stretched conditions can stall or revert—better to scale or wait for a clean reset.
Optional HTF gate
Enable to green-light only those oscillator alerts that align with your chosen higher timeframe.
What each signal means (plain language)
CoRa turns green/red (Overlay): trend bias shift on your chart.
Cloud width tilts asymmetrically: one side (buyers/sellers) is dominating; extensions on that side are more likely.
Stretch-Z near 0: fair value around CoRa; pullback timing zone.
Stretch-Z > +2 / < −2: extended; watch for slowing momentum or scale decisions.
Slope-Z cross up/down: new impulse starting; combine with VPO sign to avoid unfunded crosses.
VPO positive/negative: net buying/selling pressure funding the move.
Alerts included
Overlay
Pullback Long OK
Pullback Short OK
Oscillator
Funded Flip Up / Funded Flip Down (Slope-Z crosses 0 with VPO agreement)
Pullback Long Ready / Pullback Short Ready (near equilibrium with aligned momentum and pressure)
Exhaustion Risk (Long/Short) (Stretch-Z beyond ±2 with weakening momentum or pressure)
Tip: Keep chart alerts concise and use strategy rules (TP/SL/filters) in your trade plan.
Best practices
One glance workflow
Read Overlay for direction + value.
Use Oscillator for trigger + confirmation.
Pairing
Combine with S/R or your preferred execution framework (e.g., your JopAlgo setups).
The suite is neutral: it won’t force trades; it highlights context and quality.
Markets
Works on crypto, indices, FX, and commodities.
Where real volume is available, VPO is strongest; on synthetic volume, treat VPO as a soft filter.
Timeframes
Use the Profile preset closest to your style; feel free to fine-tune later.
For multi-TF trading, enable the HTF gate on the oscillator alerts only.
Inputs you’ll actually use (the rest can stay on Auto)
Run As: Overlay or Oscillator.
Profile: Scalp / Intraday / Swing.
Oscillator Render: “Subpane (raw)” for a classic panel; “Inline (overlay)” only for a quick preview.
HTF gate (optional): require higher-timeframe Slope-Z agreement for oscillator alerts.
Everything else ships with sensible defaults and auto-logic.
Limitations & tips
Not a strategy: CCSV1 is a decision support tool; you still need your entry/exit rules and risk management.
Non-repainting design: Signals finalize on bar close; intrabar graphics can adjust during the bar (Pine standard).
Very flat sessions: If price and volume are extremely quiet, expect fewer alerts; that restraint is intentional.
Who is this for?
Beginners who want one clean overlay for structure and one simple oscillator for timing—without wrestling settings.
Intermediates seeking a coherent trend/pressure framework with HTF confirmation.
Advanced users who appreciate robust stats and clean engineering behind the visuals.
Disclaimer: Educational purposes only. Not financial advice. Trading involves risk. Use at your own discretion.

AzaInsideIt shows inside bars, providing a convenient visual representation for traders.
An alert feature has also been added. ✅

VWAP + EMA shows the VWAP + EMA 9/20/50/100/200 all in one indicator... you can adjust VWAP's calculation method + color + the outer bands or remove them.. can remove fill as well.. personally i just keep the VWAP

Pro Maker All in One - FreePro Maker All in One - Free
This indicator provides a simple yet powerful setup combining EMA20, EMA50, and SMA50 trend analysis in one place.
📊 Features:
Dynamic color changes for SMA50 based on trend (Green = Uptrend, Red = Downtrend).
Optional EMA20 & EMA50 with auto color (Blue = Bullish, Pink = Bearish).
Helps identify early trend reversals and overall market direction.
⚙️ Usage:
Enable or disable EMAs/SMA as per your trading style. Works on all timeframes and instruments (stocks, indices, crypto).
💡 Note:
This is a free educational tool designed for learning and basic technical trend analysis. It does not generate buy/sell signals and should not be considered financial advice.

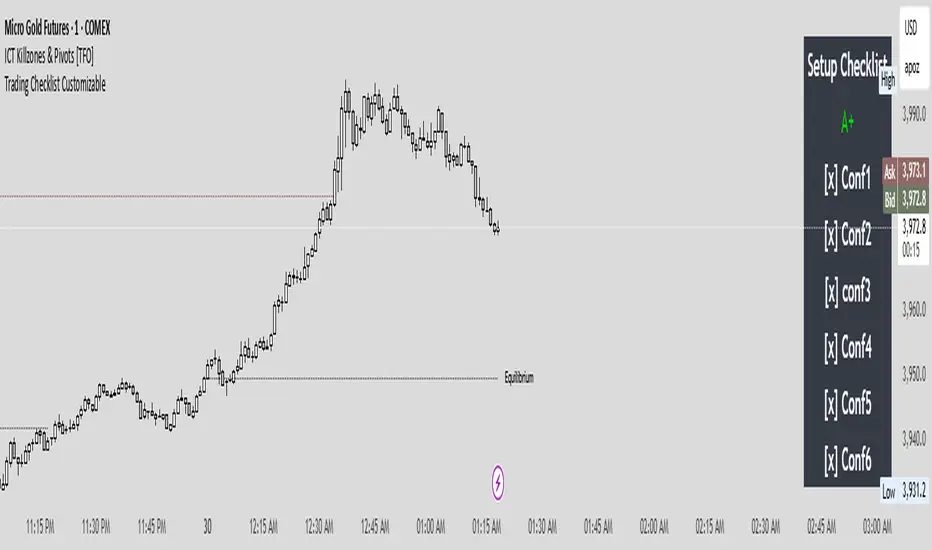
Trading Checklist CustomizableThis Strategy Checklist is a simple but powerful tool designed to help traders follow a structured confirmation process before entering trades. It provides a customizable checklist of confluences that can be edited directly in the settings — ensuring consistency, discipline, and clarity in your trading plan.
This script doesn’t generate signals automatically; instead, it serves as a trader’s personal decision framework. Perfect for ICT-style, price action, or smart money traders who rely on multi-factor confirmations like liquidity sweeps, PD Arrays, and SMTs.
Where it says Conf1 it is customizable to fit your own confluences/entry.
No-Trade Zones UTC+7This indicator helps you visualize and backtest your preferred trading hours. For example, if you have a 9-to-5 job, you obviously can’t trade during that time — and when backtesting, you should avoid those hours too. It also marks weekends if you prefer not to trade on those days.
By highlighting no-trade periods directly on the chart, you can easily see when you shouldn’t be taking trades, without constantly checking the time or date by hovering over the chart. It makes backtesting smoother and more realistic for your personal schedule.

Lynie's V9 SELL🟢🔴 Lynie’s V8 — BUY & SELL (Mirrored, Interlocking System)
Lynie’s V8 is a paired long/short engine built as two mirrored scripts—Lynie’s V8 BUY and Lynie’s V8 SELL—that read price the same way, flip conditions symmetrically, and manage trades with the exact logic on opposite sides. Use either one standalone or run both together for full two-sided automation of entries, re-entries, caution states, and adaptive SL/TP.
✳️ What “mirrored” means here
Supertrend Tri-Stack (10/11/12):
BUY: ST10 primary pierce; ST12 fallback; “PAG Buy” when price pierces any ST while above the other two.
SELL: Exact inverse—ST10 primary pierce down; ST12 fallback; “PAG Sell” when price pierces any ST while below the other two.
Re-Enter Clusters:
BUY: Ratcheted up (Heikin-Ashi green holds/tightens).
SELL: Ratcheted down (Heikin-Ashi red holds/tightens).
Both sides use the same cluster age/decay math, care penalties, session awareness, and fast-candle tightening.
Care Flags (context risk):
Ichimoku, MACD, RSI combine into single and paired flags that tighten or widen offsets on both sides with the same scoring.
VWAP–EMA50 (5m) cluster gate:
Identical distance checks for BUY/SELL. When the mean cluster is present, offsets and labels adapt (tighter/“riskier scalp” messaging).
Golden Pocket A/B/C (prev-day):
Same fib boxes & labeling (gold tone) on both sides to call out TP-friendly zones.
SL/TP Envelope:
Shared dynamic engine: per-bar decay, fast-candle expansion, and care-based compress/relax—all mirrored for up/down.
Caution Labels:
BUY side prints CAUTION SELL if HA flips red inside an active long cluster.
SELL side prints CAUTION BUY if HA flips green inside an active short cluster.
Same latching & auto-release behavior.
🧠 Core workflow (both sides)
Primary trigger via ST10 pierce (structure shift) with an ST12 fallback when ST10 didn’t qualify.
PAG Mode when price is already on the right side of the other two STs—strongest conviction.
Cluster phase begins after a signal: ratcheted re-entry level, session-aware offsets, dynamic tightening on fast bars.
Care system shapes every re-entry & SL/TP label (Ichi/MACD/RSI combos + VWAP/EMA gate + QQE).
Protective layer: SL-wick and SL-body logic, caution flips, and “hold 1 bar” cluster carry after SL to avoid whipsaw spam.
🔎 Labels & messages (shared vocabulary)
Lynie’s / Lynie’s+ / Lynie’s++ — strength tiers (ST12 involvement & clean context).
Re-Enter / Excellent Re-Enter — cluster pullback quality; ratchet shows the “must-hold” zone.
SL&TP (n) — live offset multiplier the engine is using right now.
CAUTION BUY / CAUTION SELL — HA flip against the active side inside the cluster.
Restart Next Candle — visual cue to re-arm after a confirmed signal bar.
⚡ Why run both together
Continuity: When a long cycle ends (SL or caution degradation), the SELL engine is already tracking the inverse without re-tuning.
Symmetry: Same math, same signals, opposite direction—no hidden biases.
Coverage: Trend hand-offs are cleaner; you don’t miss early shorts after a long fade (and vice versa).
🔧 Recommended usage
Intraday futures (ES/NQ) or any liquid market.
Keep the VWAP–EMA cluster ON; it filters FOMO chases.
Honor Caution flips inside cluster—scale down or wait for the next clean re-enter.
Treat Golden Zones as TP magnets, not guaranteed reversals.
📌 Notes
Both scripts are Pine v6 and independent. Load BUY and SELL together for the full experience.
All offsets (re-enter & SL/TP) are visible in labels—so you always know why a zone is where it is.
Alerts are provided for signals, re-enter hits, caution, and SL events on both sides.
Summary: Lynie’s V8 BUY & SELL are vice-versa twins—one framework, two directions—delivering consistent entries, adaptive re-entries, and contextual risk management whether the market is pressing up or breaking down.

Smart Dollar Cost Averaging DashboardThis closed-source TradingView indicator implements a comprehensive Dollar Cost Averaging (DCA) savings plan simulation designed to automate systematic investments. The script allows users to set a fixed investment amount and choose a customizable interval—weekly, monthly, or quarterly—at which purchases are simulated against historical or live price data. The core functionality calculates the average buy-in price dynamically by tracking cumulative invested capital and total acquired shares, providing a true average cost basis rather than simple price signals. This average price is visualized as a persistent, non-draggable horizontal line on the chart, enabling traders to intuitively compare the market price to their average entry point. A movable and toggleable dashboard accompanies the indicator, delivering real-time metrics including total investment, number of purchases, portfolio value, profit/loss both in absolute and percentage terms, and the price gap relative to the computed average buy-in. This transparency helps users understand their position’s health and supports disciplined long-term investment strategies. This script stands unique by combining flexible periodic investment scheduling with real capital calculations and detailed, easy-to-read visual feedback that is rarely bundled so intuitively in similar scripts. Unlike many open-source trend-following or scalping tools, this indicator focuses on systematic investment and passive portfolio growth, ideal for investors pursuing dollar cost averaging. Unlike standard buy/sell signal creators or simplistic moving average crossovers, this script models actual cash flow deployment and quantifies performance in real-time with a clean, professional UI. Its originality lies in marrying realistic capital flow simulation with intuitive visualization and multi-interval flexibility.
How It Works:
Tracks virtual investments of fixed cash amounts at user-defined intervals Converts invested amounts into shares based on closing prices, accumulating holding size Recalculates weighted average purchase price after each simulated buy Continuously displays the average buy-in as a stable graphic element on any price chart Offers detailed investment metrics through an interactive dashboard overlay Supports weekly, monthly, and quarterly investment cadences with user-selectable investment days Use Cases: Ideal for investors employing systematic savings plans to build long-term positions Fits cryptocurrency, stock, ETF, and index investments on TradingView Supports financial education by illustrating dollar cost averaging principles visually Facilitates performance tracking for passive investors who prioritize consistent buying over timing The script is an advanced tool meeting a distinct trading niche: systematic, cash-based, passive investment modeling with transparency and user control. This originality and usefulness justify the closed-source mode to protect intellectual property.
