Multi-MA SuiteMulti-MA Suite - Customizable Moving Averages Indicator
Overview
Multi-MA Suite is a comprehensive moving average indicator that combines both Exponential Moving Averages (EMAs) and Simple Moving Averages (SMAs) in a single, highly customizable tool. Designed for traders who rely on multiple timeframe analysis, this indicator provides up to 9 moving averages (5 EMAs + 4 SMAs) with full control over visibility, color schemes, and parameters.
Key Features
✓ Dual MA Types:
5 Exponential Moving Averages (EMAs) - Responsive to recent price action, ideal for short to medium timeframes
4 Simple Moving Averages (SMAs) - Slow and stable, specifically designed for long timeframe analysis
✓ Full Customization:
Individual toggle switches to show/hide each moving average
Custom color picker for each MA line
Adjustable length and source for all moving averages
Progressive line width (thicker lines for longer periods)
✓ Pre-configured Defaults:
EMA: 9, 21, 50, 100, 200 (common swing trading periods)
SMA: 50, 100, 200, 300 (institutional reference levels for long-term trends)
Color-coded scheme: Warm colors (yellow-orange) for EMAs, Cool colors (blue-purple) for SMAs
✓ Clean Interface:
Organized input groups for easy navigation
Clear labeling and logical parameter ordering
Minimal chart clutter with toggle controls
Key Difference - Speed & Timeframe:
EMAs: Fast and reactive → Best for short to medium timeframes (1-min to 4-hour charts)
SMAs: Slow and smooth → Best for long timeframes (daily, weekly, monthly charts)
Recommended Settings
Day Trading (Short Timeframes):
Focus on EMAs: 9, 21, 50
Use 1-minute to 15-minute charts
SMAs react too slowly for intraday timeframes
Swing Trading (Medium Timeframes):
Use all EMAs with SMA 50 and 200
1-hour to daily charts work best
Mix of EMAs for entries, SMAs for trend context
Position Trading (Long Timeframes):
Focus primarily on SMAs: 50, 100, 200, 300
Daily to weekly charts recommended
SMAs excel here due to their slow, stable nature
Can add EMA 200 for comparison
Investment Analysis (Very Long Timeframes):
SMAs only: 100, 200, 300
Weekly to monthly charts
SMA's slow calculation filters noise perfectly for long-term trends
EMA Timeframe-Specific Recommendations
📌 Important Notes on EMA Usage by Timeframe:
Small Timeframes (5-minute and 15-minute charts):
Use 9 EMA and 21 EMA
These fast EMAs respond quickly to price changes
Perfect for scalping and day trading
The 9/21 EMA crossover is a popular day trading strategy
Medium Timeframes (1-hour to 4-hour charts):
Use 21 EMA and 50 EMA
Balances responsiveness with trend reliability
Ideal for swing trading and intraday position holding
The 21/50 EMA combination filters out noise while staying responsive
Long Timeframes (Daily and Weekly charts):
Use 50 EMA and 200 EMA
The classic trend-following combination
50 EMA for medium-term trend, 200 EMA for major trend
The 50/200 EMA crossover is known as the "Golden Cross" (bullish) or "Death Cross" (bearish)
For very long-term analysis on these timeframes, consider using SMAs instead
Quick Reference Guide:
5m / 15m: EMA 9 & 21
1h / 4h: EMA 21 & 50
1D / 1W: EMA 50 & 200 (or switch to SMAs for even smoother signals)
Practical Trading Strategy with EMAs
📌 Why Use EMAs for Active Trading:
For active trading, use EMAs because they have faster movement compared to SMAs. This faster response to price changes allows you to catch trends earlier and exit trades before major reversals occur.
Three-EMA Trading System:
1. 9 EMA - Quick Trend Recognition:
Use the 9 EMA to understand the trend quickly
When price is above 9 EMA = Short-term uptrend
When price is below 9 EMA = Short-term downtrend
The 9 EMA reacts immediately to price momentum changes
Perfect for entry timing and quick trend identification
2. 21 EMA - Exit Signal and Trend Confirmation:
When the 21 EMA breaks (price crosses it), exit your trade
This is critical because when the 21 EMA breaks, the trend will likely reverse
The 21 EMA acts as your "stop-loss line"
Breaking the 21 EMA signals that the short-term momentum has shifted
Example: In an uptrend, when price crosses below 21 EMA, exit longs immediately
Example: In a downtrend, when price crosses above 21 EMA, exit shorts immediately
3. 50 EMA - Full Correction Understanding:
Use the 50 EMA to understand the complete correction
The 50 EMA shows where the full pullback or correction might end
When price reaches the 50 EMA, it often bounces (in a strong trend)
Breaking the 50 EMA indicates a deeper correction or potential trend reversal
Use it to gauge the strength of the overall trend
Customization Tips
Toggle unnecessary MAs off to reduce chart clutter based on your trading style and timeframe
For the 3-EMA trading strategy, enable only 9, 21, and 50 EMAs
For long timeframes (daily+), disable EMAs and use only SMAs to avoid over-reactive signals
Match your EMA selection to your timeframe using the guide above
Adjust colors to match your chart theme or to highlight specific MAs
Modify lengths to fit specific market conditions or asset volatility
Change source from close to high/low/HL2 for alternative perspectives
Use thicker lines for key decision MAs (edit linewidth in settings)
Color Scheme Rationale
EMAs (Warm Colors):
Yellow → Orange progression represents increasing timeframes while maintaining visual cohesion. The warm palette signals "active" or "fast-reacting" nature of EMAs, perfect for shorter timeframes and active trading.
SMAs (Cool Colors):
Blue → Purple progression provides clear visual distinction from EMAs. The cool palette suggests "stable," "slow," and "smooth" characteristics of SMAs, ideal for long timeframe analysis.
What Makes This Different?
Unlike basic MA indicators, Multi-MA Suite provides:
Both EMA and SMA in one indicator (saves indicator slots)
Optimized MA selection based on speed characteristics - fast EMAs for short timeframes, slow SMAs for long timeframes
Clear timeframe-specific EMA recommendations for immediate use
Practical trading strategy included - 9 EMA for trend, 21 EMA for exit, 50 EMA for corrections
Individual control over each MA (toggle, color, parameters)
Thoughtful default settings based on widely-used trading periods
Color-coded system for instant visual differentiation
Clean, organized interface for efficient workflow
Installation & Usage
Add the indicator to your chart
Open indicator settings to customize
For active trading: Enable 9, 21, and 50 EMAs (the recommended trading system)
Select appropriate MAs for your timeframe (use the EMA timeframe guide above)
Toggle MAs on/off based on your analysis needs
Adjust colors if desired to match your chart theme
Modify lengths and sources as needed for your strategy
⚠️ IMPORTANT DISCLAIMER
EDUCATIONAL AND INFORMATIONAL PURPOSES ONLY
This indicator and its accompanying documentation are provided for educational and informational purposes only. The content does not constitute financial advice, investment advice, trading advice, or any other sort of advice, and you should not treat any of the indicator's content as such.
NO GUARANTEE OF RESULTS
Past performance is not indicative of future results. The strategies, techniques, and concepts discussed herein are provided "as is" without any warranty of any kind. Trading and investing in financial markets involves substantial risk of loss and is not suitable for every investor.
RISK ACKNOWLEDGMENT
You can lose money trading: Trading stocks, forex, futures, options, cryptocurrencies, and other financial instruments carries a high level of risk and may not be suitable for all investors. You may sustain a total loss of your investment.
No guaranteed profits: The use of moving averages or any technical indicator does not guarantee profitable trades. Markets can remain irrational longer than you can remain solvent.
Lagging indicators: All moving averages are lagging indicators based on historical price data and may not predict future price movements.
False signals: Moving averages can produce false signals, especially in choppy, sideways, or low-volume market conditions.
YOUR RESPONSIBILITY
Do your own research: Before making any trading or investment decision, you should conduct your own research and due diligence.
Consult professionals: Consider seeking advice from qualified financial advisors, certified public accountants, or licensed professionals before making financial decisions.
Risk management: Always use proper risk management, including stop-losses, position sizing, and diversification.
Demo trading: Test any strategy on a demo account before risking real capital.
Understand the markets: Ensure you fully understand the markets you're trading and the risks involved.
PERSONAL TRADING DECISIONS
All trading decisions are made at your own discretion and at your own risk. You are solely responsible for all trading decisions you make. The strategies mentioned (including the 9/21/50 EMA system) are examples only and should not be followed blindly without proper testing and risk assessment.
MARKET CONDITIONS VARY
Market conditions change constantly. What works in one market condition may not work in another. Trending strategies (like the ones discussed) typically perform poorly in ranging markets. Adapt your approach based on current market conditions.
USE AT YOUR OWN RISK
By using this indicator, you acknowledge that you have read this disclaimer and agree to be bound by its terms. If you do not agree with any part of this disclaimer, do not use this indicator.
Экспоненциальное скользящее среднее (EMA)

CM's Multi Moving AverageMulti interval and timeframe moving averages in a single indicator, plus VWAP.

CloverKnight## CloverKnight (4H Inside Bar Breakout) — Description for Publishing
**CloverKnight** is a 4H-only inside-bar breakout indicator that identifies **Nested** or **Chained** inside-bar patterns (children candles inside a “mother” candle), then suggests a breakout entry with **EP / SL / TP** and shows a performance summary (Win/Draw/Loss, Win Rate, and ORPT) for a selected backtest window.
This script is designed for traders who want a clean, rule-based inside-bar breakout with optional filters and risk sizing calculations.
---
## What it does
### 1) Inside Bar Pattern Detection
CloverKnight detects inside-bar structures with two pattern styles:
* **Nested**: all child candles must be inside the same mother candle
* **Chained**: each child candle must be inside the previous candle
You control how many child candles are required via **Inside Bar Count**.
### 2) Direction Logic (Buy/Sell)
Direction can be determined by:
* **Last** candle direction
* **Mother** candle direction
* **Vote** (majority of bull/bear candles across mother + children)
You can also restrict trading signals via **Trade Side**:
* Both / Buy Only / Sell Only
### 3) Optional EMA200 Direction Filter
If enabled:
* Buy signals only when price is above EMA
* Sell signals only when price is below EMA
### 4) Day-of-Week Filter
You can allow or block signals by weekday (Mon–Sun).
### 5) Risk & Position Size Estimation
For each valid signal, the script calculates:
* **SL distance (pips)** based on mother range
* **Lot size** based on:
* Account Balance
* Risk per Trade (%)
* Pip Value per 1.0 lot (user input)
> Note: This is an estimation tool. Pip value depends on broker/symbol/contract size.
### 6) Trade Simulation & Outcome Tracking (Simple Backtest)
The script simulates a simplified trade lifecycle:
* Signal creates a **pending** breakout order
* Trade triggers when price hits EP
* Outcomes:
* **Win** if TP hit
* **Loss** if SL hit
* **Draw (BE)** if price reaches **+1R**, then returns to EP
### 7) Summary Table (Top Right)
A compact table shows:
* **W / D / L**
* **WR** (Win Rate)
* **MCL** (Max Consecutive Losses)
* **ORPT** (Optimized Risk Per Trade)
---
## Backtest Modes
### A) Years Mode
Backtest only within the last **X years** (default 5, max 10).
Stats reset when a new “Years window” begins.
### B) Trades Mode
Backtest based on last **N completed trades** (default 100, max 500).
This mode uses a rolling array of outcomes.
---
## Inputs (Quick Guide)
**Pattern**
* Inside Bar Count (Only Children)
* Inside Pattern Type: Nested / Chained
* Direction Source: Last / Mother / Vote
* Trade Side: Both / Buy Only / Sell Only
**Backtest**
* Backtest Mode: Years / Trades
* Lookback (Years) / Lookback (Trades)
**Filters**
* Max SL distance (pips): ignore signals with SL larger than this (0 = no limit)
* EMA200 filter: show line + enable/disable filter
* Day-of-Week filter: allow selected days only
**Risk & Sizing**
* Account Balance
* Risk per Trade (%)
* Maximum Drawdown (%) for ORPT
* Pip Value per 1.0 Lot (adjust per symbol)
**UI**
* Font Size: Tiny / Small / Normal / Large / Huge
* Label Offset Multiplier: controls label distance from pattern range
---
## How to use
1. Apply the indicator on **4H timeframe** (required).
2. Tune **Inside Bar Count** and pattern type to match your style.
3. Enable filters (EMA / Day-of-Week) if you want cleaner signals.
4. Set your **Account Balance**, **Risk %**, and **Pip Value per Lot** for realistic sizing.
5. Use the label output (EP/SL/TP) and the summary table to evaluate behavior over your selected backtest window.
---
## Alerts
The script triggers an alert when a valid signal is found (once per bar), including:
* Buy Stop / Sell Stop
* EP / SL / TP
* RRR and estimated lot sizing
---
## Important Notes / Limitations
* **Timeframe restriction**: This script is intended for **4H only**. It will not operate correctly on other timeframes.
* **Simulation limitation**: This is not a broker-grade backtest engine. It uses candle-based logic (high/low) and simplified assumptions.
* **Lot sizing is approximate**: Pip value varies by symbol and broker contract settings. Always verify before trading.
* This indicator **does not place real orders** (not a strategy, not an EA).

Val FXIndicator combining 3 moving averages (SMA/EMA selectable) and Bollinger Bands. Default lengths: 20, 50, 200. All parameters are customizable.


Witch-Fire ALMA signals: Dynamic Liquidity & Trend GlowThe Witch-Fire ALMA is a high-precision trend bias and liquidity mapping tool designed for price action traders and Smart Money practitioners. Unlike traditional indicators that clutter your chart with lagging signals, this script provides a "clean-yet-powerful" visual anchor to help you stay on the right side of the market while identifying key Points of Interest (POIs).
At its core, the script utilizes an optimized Arnaud Legoux Moving Average (ALMA). Known for its superior ability to balance smoothness and responsiveness, the ALMA effectively filters out market noise and "whipsaws" that often plague standard EMAs.
Key Features:
The Witch-Fire Glow: A neon-styled ALMA line that shifts between Bullish Green and Bearish Red. The white core provides surgical precision for price intersection, while the outer glow visualizes the strength and dominance of the current trend.
Scaled Liquidity Levels: Automatically maps Buy Side Liquidity (BSL) and Sell Side Liquidity (SSL). These levels are dynamic—they scale proportionally with your ALMA settings. This ensures that the liquidity zones you see are always relevant to the trend cycle you are analyzing.
Strategic Bias Background: A subtle background tint provides an instant psychological filter. Only look for Longs in the green zone and Shorts in the red zone to maintain a high-probability strike rate.
How to Trade with Witch-Fire:
Identify the Bias: Look at the Fire ALMA. If the "fire" is red and the price is below the line, your bias is strictly bearish.
Watch the Sweeps: Wait for the price to "sweep" (pierce with a wick) the horizontal SSL (Green) or BSL (Red) lines.
Execution: Look for a strong rejection candle (long wick, small body) at these levels that closes back towards the ALMA line.
Best Used On: 15m, 1H, and 4H timeframes. Works exceptionally well for Crypto, Forex, and Indices.

Support Resistance + RSI + 4 EMA (Doge_SV)Overview
This comprehensive indicator is designed to provide traders with a "bird's-eye view" of the market by combining three essential technical analysis tools into a single, clean interface. It helps in identifying trend direction, key price levels, and momentum across multiple timeframes without cluttering your workspace.
Key Features
1. Dynamic Support & Resistance (S/R)
The script automatically identifies and plots significant Support and Resistance levels based on pivot points.
Dynamic Zones: It highlights areas where price has historically reacted, helping you find high-probability entry and exit points.
Strength Filtering: Includes a built-in algorithm to display only the most "significant" levels based on their historical strength.
Visual Alerts: Lines and labels change color (Lime for Support, Red for Resistance) based on the current price position.
2. Quad-EMA Trend Ribbon (The "Exponential Moving Averages")
The indicator features four of the most widely used EMAs in professional trading to identify trend hierarchy:
EMA 34 (Green): Short-term momentum and immediate support/resistance.
EMA 89 (Blue): Intermediate-term trend filter (The "Trend Core").
EMA 200 (Black): Long-term trend baseline (The "Institutional Level").
EMA 633 (Purple): Ultra-long-term trend, often used for major cycle analysis.
3. Multi-Timeframe (MTF) RSI Dashboard
Stay informed about overbought or oversold conditions across all timeframes simultaneously.
Real-time Table: A neat table in the corner of your chart displays RSI (14) values from 1 minute up to 1 day.
Heatmap Logic: The table cells automatically change color based on intensity:
Red/Orange: Overbought (RSI > 70/80)
Green/Dark Green: Oversold (RSI < 30/20)
White: Neutral zone.
How to Use
Trend Alignment: Look for the 4-EMAs to be stacked in order (34 > 89 > 200 > 633 for a Bullish trend).
S/R Confirmation: When price approaches a Red Resistance line, check the RSI Dashboard. If higher timeframes are also Overbought, it increases the probability of a reversal.
Breakout Detection: Use the Support/Resistance lines to identify potential breakouts or "Role Reversal" (where old resistance becomes new support).

MSP Multi-Timeframe Trend & Momentum DashboardMulti-Timeframe Trend, Momentum, and Bias Dashboard
This indicator provides a multi-timeframe overview by evaluating several technical conditions across multiple timeframes simultaneously.
Its purpose is to help traders assess alignment or divergence between higher and lower timeframes before making trading decisions.
Rather than generating standalone signals, the dashboard summarizes trend, momentum, participation, and trend-strength metrics into a compact visual table.
What the Indicator Evaluates (Per Timeframe)
Each selected timeframe is analyzed independently using:
Trend context
Price position relative to fast and slow moving averages
Momentum
RSI position relative to user-defined thresholds
Directional confirmation
MACD line relative to its signal line
Participation
Current volume compared to its recent average
Trend strength
ADX value to distinguish trending from non-trending conditions
These components are combined to form a directional bias assessment for each timeframe.
Dashboard Overview
The dashboard displays:
Directional bias per timeframe
Aggregate bias across all selected timeframes
Momentum and trend readings
Relative volume strength
Trend-strength values
Alignment status when multiple timeframes agree
This allows users to quickly identify whether market conditions are aligned, mixed, or conflicting across timeframes.
Visual Encoding
Cells within the table are color-coded to improve readability:
Bullish bias
Bearish bias
Neutral or mixed conditions
Color intensity reflects relative strength, helping distinguish weak alignment from stronger confluence.
Optional chart-level visuals can highlight periods of broad alignment or disagreement across timeframes.
Customization Options
Users may adjust:
Timeframes included in the dashboard
Thresholds for momentum, volume, and trend strength
Table size, position, and visual appearance
Alert conditions based on alignment criteria
These settings allow the indicator to be adapted to different instruments, timeframes, and trading styles.
Intended Use
Style: Multi-timeframe analysis and confirmation
Markets: Forex, crypto, equities, index futures
Purpose:
Assess higher-timeframe bias
Improve directional context before entries
Avoid trades against broader trend conditions
The indicator is most useful as a contextual filter, rather than a standalone decision tool.
Important Notes
This script is provided for educational and analytical purposes only.
It does not predict price movement and should be used alongside independent analysis and appropriate risk controls.


EMA Ribbons
The Gray Ribbon (EMA 1–3) is designed for trend trading. When the market is trending, price tends to respect the ribbon and bounce off it. If price frequently chops through the ribbon, the market is likely ranging and the ribbon should be ignored.
The 100 EMA and 200 EMA (EMA 4 & 5) are commonly used as dynamic support and resistance levels.
EMA 6 & 7 are calculated from a higher timeframe to provide broader market context.

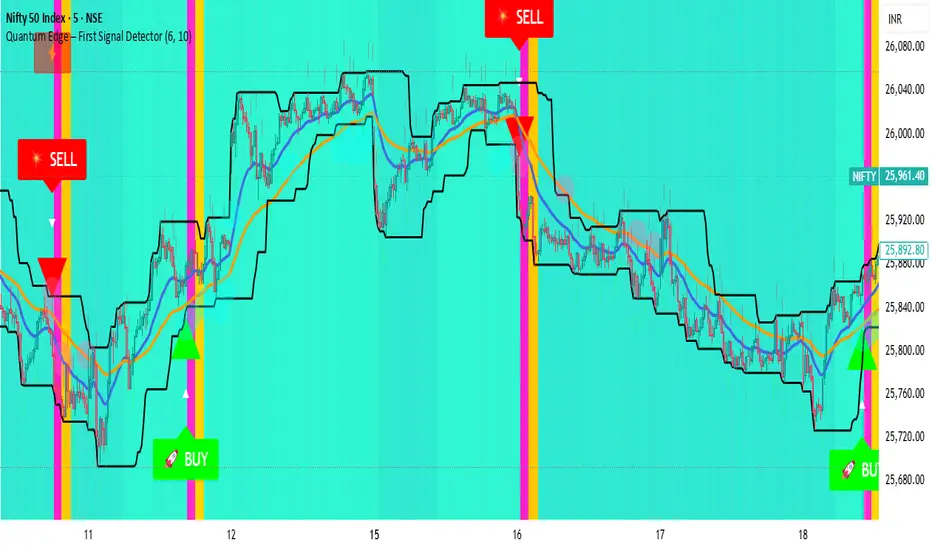
Quantum Edge First Signal DetectorQuantum Edge is a non-repainting, multi-confirmation indicator that detects the first high-probability BUY & SELL signals using momentum, trend, volume, volatility, and price-action voting logic.
🧠 About This Indicator
Quantum Edge – First Signal Detector is designed to solve one common trader problem:
too many late or repeated signals.
Instead of firing continuous entries, this indicator focuses only on the FIRST valid signal after a market shift — helping traders enter early, reduce noise, and avoid over-trading.
It uses a quantum-style voting engine where multiple independent market factors must align before a signal is confirmed.
⚙️ Core Logic (How It Works)
Each candle is evaluated using 6 independent factors:
RSI Momentum
Bullish when RSI > 50
Bearish when RSI < 40
Price Location
Price near recent highs or lows
Volume Expansion
Current volume above moving average
EMA Trend Direction
EMA 20 vs EMA 50
Candle Strength
Strong bullish or bearish candle bodies
Volatility Filter
ATR-based low volatility confirmation
Each factor gives 1 vote.
When minimum confirmations are met, a FIRST BUY or FIRST SELL signal is generated.
🚀 Key Features
✅ First-Signal-Only Logic
Only the first BUY or SELL after trend change
No repeated signals in the same direction
Built-in signal cooldown (user-controlled)
✅ Non-Repainting
Signals are confirmed on candle close
No future data, no repainting
✅ Smart Trend Filtering
EMA-based directional bias
Avoids weak counter-trend entries
✅ Advanced Visual System
Clear BUY / SELL triangles
Trend, volume & momentum backgrounds
Support & resistance zones
Market sentiment bar coloring
✅ Alert Support
Buy alert
Sell alert
📊 Best Timeframes
Scalping: 1m – 5m
Intraday: 5m – 15m
Swing Confirmation: 30m – 1H
Works on:
Forex
Crypto
Indices
Stocks
🎯 How to Trade (Simple Guide)
BUY Setup
✔ First BUY signal appears
✔ Trend is bullish
✔ Use nearby support as reference
SELL Setup
✔ First SELL signal appears
✔ Trend is bearish
✔ Use nearby resistance as reference
Always combine with risk management.
Disclaimer: This indicator is for educational purposes only and does not constitute financial advice. Trading involves risk. Use proper risk management.
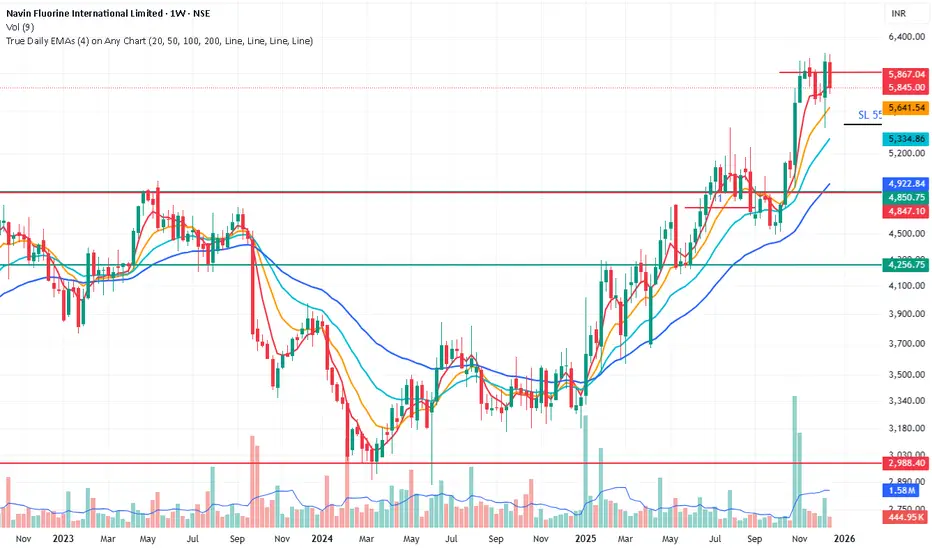
True Daily EMAs (4) on Any ChartIt calculated the 4 EMAs based on days as input. Even on a weekly or monthly chart it shows 20/50/100/200 Day EMAs. Changing the time frame of chart does not effect the EMAs

EMA Strategy Flip/DCA + PnL (Aidan)This is a long only , trend focused EMA strategy designed for capital preservation and entries in sustained market movement, rather than short term trading.
At its core, the system is intentionally simple:
-Uses a dual EMA trend structure to identify bullish and bearish regimes
-Avoids unnecessary exits when price action is indecisive
-Emphasizes staying aligned with the larger market direction
All of these characteristics inherently work best on longer time frames, I typically use the 1D view but have also tested in the 1W and 4H views as well.
Philosophy 🧠
Markets do not move in clean, continuous trends. They alternate between:
-Expansion (breakouts/breakdowns)
-Compression (consolidation/chop)
Most traditional EMA crossover strategies fail because they:
-Overreact during consolidation
-Constantly flip positions
-Slowly bleed capital in sideways markets
This indicator attempts to solve that issue by filtering how sell signals are treated depending on market behavior, rather than blindly acting on every crossover. These are denoted by the "weak sell" indications which are defined by the length of each EMA expansion period.
HOW IT WORKS ⚙️
Buy Signals
Buy signals are generated when the EMA structure flips bullish.
On higher timeframes, these buys aim to align with broader market momentum, not short-term noise.
Weak Sell vs Strong Sell
Not every bearish EMA flip is treated equally. Short, flickering EMA flips (common in consolidation) are treated as “weak sells”, meaning the position is held. The length that defines each "weak sell" can be edited through settings under "flip-distance regime" if you so choose. I keep mine between 20-30 ticks.
Capital is not forced out of the market prematurely. Only when an EMA move shows sufficient trend persistence does the indicator issue a strong sell, fully closing the position.
DCA-Friendly by Design
One of the strengths of this indicator is that it can be used in a dollar-cost-averaging (DCA) mindset.
Some users may choose to:
-Simply buy on each buy signal
-Hold positions through weak sell periods
-Use strong sell signals as higher-confidence exits
This approach can be particularly effective for traders or investors with a long-term outlook who prefer gradual position building with less emotion on each buy. The amount of max tolerable DCA entries can be edited through settings (default 6)
Best Practices & Usage Notes
-This indicator performs best on 4H and 1D charts (be sure to note your "flip distance regime" in settings or the weak sell periods may be inaccurate)
-Blue chip and macro markets prove to yield the most consistent results during back testing, although I've seen impressive results on volatile markets as well.
-It is not designed for scalping or very low timeframes
-No indicator is perfect — not every buy or sell will be optimal
-For best results, it should be used alongside:
-Higher-timeframe trend analysis
-Market structure (higher highs / higher lows)
-Macro context or sector strength
-Your own risk management rules
Think of this tool as a framework, not a prediction engine. When used with discipline and proper context, it can serve as a reliable indicator for traders focused on sustainable growth rather than constant activity.
I am always open to suggestions on improvements; please feel free to comment below and let me know any ideas you might have for bettering the indicator, or if you just have questions I'll be happy to answer any!
Good luck out there!!

RiskyInvesting Algo v1.0.0 - BasicA multi‑layer trend‑following and momentum‑confirmation system designed around dual adaptive baselines, and smart candle‑strength filtering. This indicator blends volatility‑based trailing logic with macro trend bias tools (EMA + SMMA) to identify clean directional flips and filter out weak signals.
This indicator uses 5 parameters to determine the trend direction.
Disclaimer:
- Please use this in conjunction with other tools and confirmations. Labels are not meant to be used as financial advice.
Core features include:
- Two Adaptive Trailing Baselines: ATR‑adjusted equations (Parameter 1 & 2) that flip direction based on baseline breaks.
- Directional Shift Detection: Buy markers on bullish dual‑baseline flip; sell markers on bearish dual‑baseline flip.
- Trend Bias Filtering: Uses EMA vs SMMA relationship to color signals and provide market bias context.
- Candle Strength Filter: Ensures signals only trigger on meaningful momentum candles relative to ATR.
- Clean Visual Display: Auto‑coloring buy/sell labels, baseline plots, and signal triangles.
🟩/🟥 = Strong Directional Bias
🟦/🟧 = Neutral Directional Bias
Built for traders who want a structured trend‑flip system that avoids noise, highlights strong directional moments, and maintains visual clarity even on volatile intraday charts.

Triple EMA// Triple EMA indicator designed for TradingView free users.
// Displays 3 standard EMAs in one indicator slot.

llama fixed-length moving averages [SMA, WMA]Llama Moving Averages
I needed moving averages on my charts, but I wanted them hardcoded based on the following values:
timframe --- MA length
Daily --- 20D (==1 trading month)
Weekly --- 30W (30W moving averages for assessing long term trends)
15m --- 1W (or 5 days)
Two averages:
EMA and WMA: fast moving and slow moving based on closes.
In addition to this, I needed the following things:
1. MAs ONLY on 15m, 1D and 1W timeframes.
2. Consistent colors.
3. for 15m chart, we want a 5D SMA, so 1D = 15m * 25(±1); times 5; 25*5 = 125
4. Option to configure different values for the daily chart, since I trade the daily chart. Defaults: 20.
If you were looking for something similar, enjoy!

Boyen_Multi EMA LTF HTFKey Features:
Short-Term Trend (Lower Timeframe - LTF):
EMA 13: A 13-period EMA that reacts quickly to recent price changes, ideal for capturing short-term momentum and early trend shifts.
EMA 21: A 21-period EMA offering a slightly smoother view of price action, balancing sensitivity and reliability for short-term analysis.
EMA 25: A 25-period EMA providing additional confirmation of short-term trends with a bit more lag for stability.
Medium-Term Trend:
SMA 100: A 100-period SMA that serves as a benchmark for medium-term trend direction, often used to gauge broader market sentiment and key levels.
Long-Term Trend (Higher Timeframe - HTF):
EMA 200: A 200-period EMA, widely recognized as a critical long-term trend indicator, helping traders assess the overall market bias.
SMA 300: A 300-period SMA for an even deeper perspective on long-term price movements, smoothing out noise to highlight major trends.

Black OPS Pro Edition (White Knight) v1.0Black OPS Pro Edition (White Knight) v1.0
Black OPS Pro Edition (White Knight) v1.0 is a professional-grade educational trading tool designed for trend analysis, volatility measurement, and intrabar signal detection. It combines ATR-based volatility tracking, Bollinger Bands, EMA bounces, and stochastic filtering to provide clear visual cues on market movements.
Features:
ATR & Volatility Analysis: Tracks market volatility and directional movement.
Bollinger Bands: Upper, lower, and midline bands with smoothing to identify breakouts and pullbacks.
Trend Detection: Automatically identifies bullish, bearish, and neutral trends.
EMA Bounces: Detects price interactions with multiple EMA levels (1- 200).
Stochastic Filter: Confirms trend signals and helps reduce false alerts.
Visual Signals: Up 🚀 and down 💥 arrows for trend flips, plus EMA bounce indicators ⚔️ 🕵️.
Dashboard: Displays current volatility and trend strength.
Background Coloring: Highlights bullish and bearish periods.
Screen-Fixed Disclaimer: Table at the bottom-right with a permanent educational disclaimer.
User Customization:
Adjust ATR length, volatility lookback, Bollinger Band parameters, EMA settings, and other thresholds to fit your trading style.
Disclaimer:
For educational purposes only. This script does NOT provide financial advice or guarantee profits. Users are fully responsible for their own trading decisions and risk management. Always perform your own analysis before making trades.

Smart MA Zone Crossover [HMA-EMA]Smart MA Zone Crossover is a trend-following indicator designed to capture early momentum shifts using the crossover between Hull Moving Average (HMA) and Exponential Moving Average (EMA).
The indicator visually highlights trend direction using a dynamic colored zone, making it easy to identify bullish and bearish market phases at a glance.
🔸 Step 1: Moving Average Calculation
HMA (Hull Moving Average) → Faster, smoother, reacts quickly to price
EMA (Exponential Moving Average) → Stable trend reference
Both MA lengths are **fully adjustable** from the settings panel.
🔸 Step 2: Trend Detection
Bullish Trend: HMA is above EMA
Bearish Trend: HMA is below EMA
The area between the two averages is filled with color to visually represent the current trend state.
Step 3: Signal Generation (Non-Repainting)
Signals are generated **only on confirmed crossovers**:
✅ BUY Signal- HMA crosses above EMA
❌ SELL Signal-HMA crosses belowEMA
Signals do **not repaint** and appear only once per crossover.
🔸 Step 4: Visual Customization
Users can enable or disable:
* Moving average lines
* Colored MA zone fill
* Buy/Sell arrows
* Buy/Sell text labels
This allows the indicator to remain **minimal or detailed**, depending on user preference.
🔹 Key Features
✔ Non-repainting logic
✔ Clean crossover-based signals
✔ Customizable HMA & EMA lengths
✔ Optional MA zone fill
✔ Buy/Sell arrows & labels
✔ Works on all timeframes
✔ Beginner-friendly & scalper-ready
🔹 Best Use Cases
* Trend confirmation
* Momentum trading
* Scalping & intraday trading
* Swing trend filtering
For best results, combine with:
* Support & resistance
* Volume
* Higher-timeframe trend
🔹 Disclaimer
This indicator is provided for **educational purposes only**.
It is **not financial advice**. Always backtest and use proper risk management before trading live markets.

ES Signals (Sequencer Labels)Here i am using EMA crossover systems to catch the market. One can use this with their own choice.
Using Some simple rules, we can get some good quality trades! You can see for yourself before trading.
=== HOW TO USE THIS INDICATOR ===
1) Choose your market and timeframe. ( according to their need )
2) Choose if the strategy is long-only or bidirectional.
Don't overthink nobody knows the best answer of market. We're going to test and find out.
After you find a good combination, set up an alert system with the default Exponential Moving Average indicators provided by TradingView.
=== TIPS ===
Change the Time frame according to their need.
i) for intraday 3-5 minute.
ii) 60 minute for 3-4 days View
iii) Daily for positional
Try a Long-Only strategy to see if that performs better.

EMA Slope Angle V2 Auto Threshold# EMA Slope Angle Indicator
## Overview
The EMA Slope Angle Indicator visualizes the Exponential Moving Average (EMA) slope as an angle in degrees, providing traders with a clear, quantitative measure of trend strength and direction. The indicator features **automatic threshold calculation based on Gaussian distribution**, making it adaptive to any market and timeframe.
## Key Features
### 🎯 **Automatic Threshold Calculation (NEW!)**
- **Gaussian Distribution-Based**: Automatically calculates optimal thresholds from the 50% interquartile range (IQR) of historical angle data
- **Asset-Adaptive**: Thresholds adjust to each instrument's unique volatility and price characteristics
- **No Manual Tuning Required**: Simply enable "Use Auto Thresholds" and let the indicator optimize itself
### 📊 **Dynamic EMA Coloring**
- **Color Intensity**: EMA line color intensity reflects slope strength
- **Visual Feedback**:
- Green shades for uptrends (darker = stronger)
- Red shades for downtrends (darker = stronger)
- Gray for flat/neutral conditions
### 📈 **Regime Detection**
- **Three Regimes**: RISING, FALLING, and FLAT
- **Smart Classification**: Based on statistical distribution of angles
- **Non-Repainting**: All calculations use confirmed bars only
### 🔔 **Trend-Shift Signals**
- **Visual Arrows**: Automatic signals when transitioning from FLAT to RISING/FALLING
- **Configurable**: Enable/disable signals as needed
- **Reliable**: Only triggers on significant regime changes
### 📋 **KPI Dashboard**
- **Real-Time Metrics**: Current angle, regime, and last signal
- **Auto-Threshold Display**: Shows calculated thresholds when auto-mode is active
- **Statistics**: Optional angle distribution statistics
- **Clean Layout**: Top-right corner, non-intrusive
### 📊 **Angle Statistics (Optional)**
- **Distribution Analysis**: Histogram of angle ranges
- **Dynamic Buckets**: Automatically adjusts to data distribution when auto-mode is enabled
- **Percentage Breakdown**: See how often each angle range occurs
## Settings
### Main Settings
- **EMA Length**: Period for the Exponential Moving Average (default: 50)
- **Slope Lookback Bars**: Number of bars to calculate slope over (default: 5)
### Angle Settings
- **Use Auto Thresholds**: Enable automatic threshold calculation (recommended!)
- **Analysis Period**: Number of bars to analyze for distribution (default: 500)
- **Manual Thresholds**: Flat, Rising, and Falling triggers (used when auto-mode is off)
- **Max Angle for Color Saturation**: Maximum angle for color intensity scaling
### Display Options
- **Colors**: Customize uptrend, downtrend, and flat colors
- **Show Signals**: Enable/disable trend-shift arrows
- **Show Statistics**: Display angle distribution table
- **Show Dashboard**: Toggle KPI dashboard visibility
## How It Works
### Angle Calculation
The indicator calculates the angle between the current EMA value and the EMA value N bars ago:
```
Angle = arctan((EMA_now - EMA_then) / lookback) × 180° / π
```
### Auto-Threshold Calculation
When enabled, the indicator:
1. Analyzes historical angle data over the specified period
2. Calculates mean and standard deviation
3. Determines thresholds based on the 50% interquartile range (IQR):
- **Flat Threshold**: ±0.674σ (middle 50% of data)
- **Rising Trigger**: 75th percentile (mean + 0.674σ)
- **Falling Trigger**: 25th percentile (mean - 0.674σ)
### Regime Classification
- **FLAT**: Angle within ±Flat Threshold
- **RISING**: Angle ≥ Rising Trigger
- **FALLING**: Angle ≤ Falling Trigger
## Use Cases
### Trend Following
- Identify strong trends (high angle values)
- Spot trend reversals (regime changes)
- Filter trades based on trend strength
### Range Trading
- Detect flat/consolidation periods
- Avoid trading during choppy markets
- Enter when regime shifts from FLAT to RISING/FALLING
### Multi-Timeframe Analysis
- Apply to different timeframes for confirmation
- Use higher timeframe for trend direction
- Use lower timeframe for entry timing
## Tips for Best Results
1. **Enable Auto-Thresholds**: Let the indicator adapt to your instrument
2. **Adjust Analysis Period**: Use more bars for stable markets, fewer for volatile ones
3. **Combine with Price Action**: Use regime changes as confirmation, not standalone signals
4. **Multi-Timeframe**: Check higher timeframes for trend context
5. **Backtest First**: Test settings on historical data before live trading
## Technical Details
- **Non-Repainting**: All calculations use `barstate.isconfirmed`
- **Pine Script v6**: Latest version for optimal performance
- **Efficient**: Minimal computational overhead
- **Customizable**: Extensive settings for fine-tuning
## Version History
**v2.0** (Current)
- Added automatic threshold calculation based on Gaussian distribution
- Dynamic bucket adjustment for statistics
- Enhanced dashboard with auto-threshold display
- Improved regime detection using IQR method
**v1.0**
- Initial release with manual thresholds
- Basic EMA coloring
- Trend-shift signals
- KPI dashboard
## Support
For questions, suggestions, or bug reports, please leave a comment or contact the author.
---
**Disclaimer**: This indicator is for educational purposes only. Past performance does not guarantee future results. Always use proper risk management and never risk more than you can afford to lose.
**Keywords**: EMA, slope, angle, trend, automatic thresholds, Gaussian distribution, regime detection, non-repainting, adaptive

MultiTimeFrame SMA/EMA & clouds [PACHI]This will allow you to plot multiple moving averages and clouds for the current timeframe and also up to 5 from different timeframes
