Robrechtian Long-Medium Breakout Trend SystemRobrechtian Long–Medium-Term Breakout Trend System
A professional, rule-based trend-following strategy designed to capture large, sustained price movements using pure price action and breakouts.
This system follows long-established trend-following philosophy: no prediction, no volatility targeting, and no profit targets. Only disciplined entries, position additions, and exits driven entirely by trend structure.
Core Principles
Breakout-driven entries: Initial positions are taken only when price breaks above/below the 80-day Donchian channel, confirming a long–medium-term trend shift.
Short-term confirmation: Breakouts must also exceed the 20-day channel, reducing false positives.
Trend-direction filter: A 50-day moving average slope filter ensures alignment with the broader trend.
Explosive bar filter: Entries avoid excessively large, single-candle expansions (>2.5× ATR(20)) to prevent chasing exhaustion spikes.
Pyramiding into strength: Additional units are added only when price makes fresh 20-day breakouts in the direction of the trend. No scaling out. No adding on dips.
Exit only on trend violation: Positions are closed exclusively when price breaks the opposite 80-day channel. This preserves unlimited upside while enforcing disciplined exits.
Pure trend philosophy: No volatility targeting, no smoothing, no discretionary overrides, no optimization for short-term performance.
Intended Use
This system is designed primarily for diversified futures portfolios, where diversification across dozens of globally liquid markets creates robustness and stability. However, it may also be used on individual assets for educational and analytical purposes.
The system embraces the core trend-following logic:
Small losses, big winners, and unlimited upside when trends persist.
⚠️ WARNINGS / DISCLAIMERS
⚠️ Warning 1 — This strategy is not optimized for single stocks
The Robrechtian Trend System is designed for multi-asset futures portfolios, not single equities.
Performance on individual tickers may vary greatly due to lack of diversification.
⚠️ Warning 2 — Trend following includes substantial drawdowns
Deep drawdowns are a normal and expected feature of all long-term trend-following systems.
The strategy does not attempt to smooth returns or manage volatility.
If you seek steady, low-volatility equity curves, this system is not suitable.
⚠️ Warning 3 — No volatility targeting or risk smoothing
This system intentionally avoids volatility-based position sizing.
Trades may experience larger fluctuations than systems using risk parity or vol targeting.
⚠️ Warning 4 — Not financial advice
This script is for educational and research purposes only.
Past performance does not guarantee future results.
Use at your own risk.
⚠️ Warning 5 — TradingView backtests have known limitations
TradingView does not simulate:
futures contract roll logic
slippage
real bid/ask spreads
liquidity conditions
limit-up/limit-down behavior
Results may vary from live market execution.
Futurestrading

AlgoIndexOS-ES-FuturesAlgoIndexOS — ES Futures Strategy v2.0 (5-Minute RTH)
Scope (read first)
ES on 5-minute only, RTH session. The strategy operates on U.S. Regular Trading Hours (09:30–16:00 ET) using a 5-minute ES chart. It builds an Opening Session Range (OSR) from the RTH open, then runs a breakout engine when internal quality conditions are met. Exits are target-based with an intrabar touch-to-flat safety. Positions are flattened at the RTH session end by default. Alerts can post JSON to your Webhook URL for automation.
What this is
One intraday engine with four curated presets (“Stages”) tuned for distinct segments of the NY session. Stages keep the core logic consistent while applying time-of-day context and conservative governors. Single invite-only listing; not a multi-post suite.
How it trades (high-level)
Range context: Builds and locks the OSR from the opening bell; entries only arm after the range is set.
Quality gating: Trades only when internal trend/volatility/confirmation conditions align (no parameter disclosure).
Breakout execution: Signals at bar close; bracket exits manage take-profit (limit) with an intrabar “TP-touch” safety to avoid phantom fills; optional stop-loss.
Session safety: Positions flat at RTH close by default (time exit).
(No settings or thresholds are disclosed; presets encapsulate research choices.)
Stages (session templates; one engine)
A single Stage selector chooses among four presets optimized for different parts of the RTH session (morning vs mid-day; long/short focus). Internal parameters remain fixed to preserve tested behavior.
Public inputs (kept minimal)
Stage (choose your preset)
TP / SL (points) shown for transparency; effective values are governed by the selected preset to maintain consistency with research.
Optional display overlays (status line/markers) for readability.
Alerts (how to use)
Create an alert on the strategy and choose Strategy → Order fills. Use a webhook if you want automation. The payload includes the exact chart symbol so it works on ES1! or a specific ES contract:
{
"tv_symbol": "{{ticker}}",
"tv_exchange": "{{exchange}}",
"action": "buy|sell|exit",
"price": {{close}},
"time": "{{timenow}}"
}
If your receiver needs a fixed root (e.g., “ES”), map it on your server using tv_symbol for context.
Backtest & assumptions
Backtest assumptions (initial capital, commission, slippage, margin) are user-configurable in TradingView. Results on your chart reflect your settings. This script evaluates ES fills on 5-minute RTH bars; live execution will differ.
Operating notes
Use on ES only, 5-minute timeframe, RTH session.
If you run multiple Stages, use separate charts/tabs and coordinate net exposure in your own tooling if needed.
Publish with a clean chart for clarity.
Disclosures (compliance)
No investment advice. This script is for research/education and tooling only. It does not provide investment, legal, tax, or accounting advice and does not recommend any security, instrument, or strategy. Use at your own risk.
Hypothetical performance (CFTC 4.41). Hypothetical or simulated results have many limitations, and no representation is made that any account will achieve similar outcomes. Past performance is not necessarily indicative of future results.
Futures risk. Trading futures involves substantial risk of loss and is not suitable for all investors. Leverage, gaps, slippage, and connectivity can cause losses exceeding initial investment.
Backtesting limitations. Results depend on data quality, chart resolution, session filters, and user assumptions; live execution will differ.
Intellectual property. © 2025 AlgoIndex. All Rights Reserved. Redistribution, resale, or decompilation prohibited without written consent.

Futures Fighter MO: Multi-Confluence Day Trading System ADX/SMI👋 Strategy Overview: The Multi-Confluence Mashup
The Futures Fighter MO is a comprehensive, multi-layered day trading strategy designed for experienced traders focusing on high-liquidity futures contracts (e.g., NQ, ES, R2K).
This strategy is a sophisticated mashup that uses the 1-minute chart for surgical entries while enforcing strict environmental filtering through higher-timeframe data. We aim to capture high-conviction moves only when multiple, uncorrelated signals align.
🧠 How the Logic Works (Concepts & Confluence)
Our logic is built on four pillars, which must align for a trade to be executed:
Primary Trend Filter
Indicators :
ADX/DMI (15-Minute Lookback)
Role :
Price action is filtered to ensure the ADX (17/14) is above 25, confirming a strong, prevailing market trend (Bullish or Bearish). Trades are strictly rejected during "Flat" (sideways) market regimes.
Entry Signal Types
The system uses multiple entry types:
- 🟢 Trend Long/Short: A breakout/rejection near the 200-Period EMA is confirmed by the primary ADX trend.
- 🔴 Engulfing Rejection: A strong signal when a Bullish/Bearish Engulfing or Doji prints near the long-term 500-Period EMA (emaGOD) while the Stochastic Momentum Index (SMI on 30M) is in an extreme overbought/oversold state (below $-40$ or above $40$).
Volatility & Volume Confirmation
Indicators: Average True Range (ATR) and 20-Period SMA of Volume
Role: Every entry requires a volume spike (Current Volume $> 1.5 \times$ SMA Volume) to confirm that the move is supported by significant liquidity. Volatility is tracked via ATR to define bar range and stop boundaries.
Structural Guardrails
Indicators: Daily Pivot Points (PP, S1-S3, R1-R3)
Role: Trades are disabled if the current bar's price range intersects with a Daily Pivot Point. This is a critical filter to avoid high-chop consolidation zones near key structural levels.
📊 Strategy Results & Required Disclosures
I strive to publish backtesting results that are transparent and realistic for the retail futures trader.
- Initial Capital: $50,000 - A realistic base for Mini/Micro futures contracts.
- Order Size: 1 Contract (Pyramiding up to 3) - Conservative risk relative to the account size.
- Commission: $0.11 USD per order - Represents realistic costs for low-cost brokers.
- Slippage: 2 Ticks - Accounts for expected market friction.
⚠️ Risk Management & Deviations
Stop-Loss: The strategy uses a dynamic stop-loss system where positions are closed upon a reversal (e.g., breaking the 50-Period EMA or failure to hold a Pivot Point), rather than a fixed tick-based stop. This is suited for experienced traders using a low relative risk (single Micro-contract entry) on a larger account. Users must confirm that the first entry's maximum potential loss remains below $10\%$ of their capital for compliance.
Trade Sample Size: Due to data limitations of the TradingView Essential plan (showing $\approx 50$ trades over 2 weeks), the sample size is under the ideal $100+$ target. Justification: This system is designed to generate signals across a portfolio of correlated futures markets (NQ, ES, R2K, Gold, Crude), meaning the real sample size for a user tracking the portfolio is significantly higher.
Drawdown Control: This strategy is designed for manual management. It requires the user to turn the script/alerts OFF after a significant drawdown and only reactivate it once a recovery trend is established externally.
The strategy uses a combination of dynamic trailing stops, structural support/resistance zones, and a fixed profit target to manage open positions.
🛑 Strategy Exit Logic
1. General Stop-Loss (Dynamic Trailing Stop)
These conditions act as the primary dynamic stop, closing the position if the market reverses past a key Moving Average (MA):
- Long Positions Closed When: The current bar's close crosses under the 50-Period EMA (emaLong).
- Short Positions Closed When: The current bar's close crosses above the 50-Period EMA (emaLong).
2. Profit Target (Fixed Percentage)
The script includes a general exit based on a user-defined profit percentage:
Take Profit Trigger: The position is closed when the currentProfitPercent meets or exceeds the input Profit Target (%) (default is 1.0% of the entry price).
3. Structural Exits (Daily Pivot Points)
These exits are high-priority, "close all" orders that trigger when the price fails to hold or reclaims a recent Daily Pivot Point, suggesting a failure of the current move.
- VR Close All - Long ($\sym{size} > 0$) - Price crosses under a Daily Resistance Level (R1, R2, or R3) minus 1 ATR within the last 10 bars. This indicates the current momentum failed to hold Resistance as support.
- VS Close All - Short ($\sym{size} < 0$) - Price crosses above a Daily Support Level (S1, S2, or S3) plus 1 ATR within the last 10 bars. This indicates the current momentum failed to hold Support as resistance.
4. Trend Failure Exit (Trend-Following Signals Only)
This exit protects against holding a position when the primary high-timeframe trend used for the entry has failed:
- Long Positions Closed When: The primary trend is no longer "bullish" for more than 2 consecutive bars (i.e., it turned "bearish" or "flat").
- Short Positions Closed When: The primary trend is no longer "bearish" for more than 2 consecutive bars (i.e., it turned "bullish" or "flat").
5. End of Day (EOD) Session Control
The final hard exits based on time:
- End of Session (EoS): At 11:30 AM, new trades are disabled (TradingDay := false). Open positions are kept.
- End of Day (EoD): At 1:30 PM, all remaining open positions are closed (strategy.close_all).
🤝 Development & Disclaimer
This script and description were created with assistance from Gemini and GitHub Copilot. My focus is on helping fellow real estate investors and day traders develop mechanically sound systems.
Disclaimer: This is for educational purposes only and does not constitute financial advice. Always abide by the Realtor Code and manage your own risk.

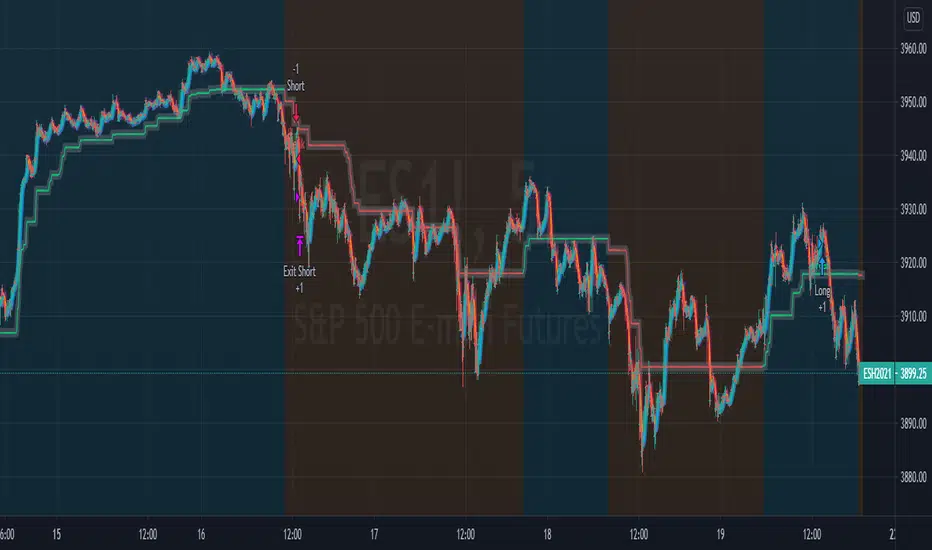
NY VIX Channel Trend US Futures Day Trade StrategyNY VIX Channel Trend Strategy
Summary in one paragraph
Session anchored intraday strategy for index futures such as ES and NQ on one to fifteen minute charts. It acts only after the first configurable window of New York Regular Trading Hours and uses a VIX derived daily implied move to form a realistic channel from the session open. Originality comes from using a pure implied volatility yardstick as portable support and resistance, then committing in the direction of the first window close relative to the open. Add it to a clean chart and trade the simple visuals. For conservative alerts use on bar close.
Scope and intent
• Markets. Index futures ES and NQ
• Timeframes. One to thirty minutes
• Default demo. ES1 on five minutes
• Purpose. Provide a portable intraday yardstick for entries and exits without curve fitting
• Limits. This is a strategy. Orders are simulated on standard candles
Originality and usefulness
• Unique concept. A VIX only channel anchored at 09:30 New York plus a single window trend test
• Addresses. False urgency at session open and unrealistic bands from arbitrary multipliers
• Testability. Every input is visible and the channel is plotted so users can audit behavior
• Portable yardstick. Daily implied move equals VIX percent divided by square root of two hundred fifty two
• Protected status. None. Method and use are fully disclosed
Method overview in plain language
Take the daily VIX or VIX9D value, convert it to a daily fraction by dividing by square root of two hundred fifty two, then anchor a symmetric channel at the New York session open. Observe the first N minutes. If that window closes above the open the bias is long. If it closes below the open the bias is short. One trade per session. Exits occur at the channel boundary or at a bracket based on a user selected VIX factor. Positions are closed a set number of minutes before the session ends.
Base measures
Return basis. The daily implied move unit equals VIX percent divided by square root of two hundred fifty two and serves as the distance unit for targets and stops.
Components
• VIX Channel. Top, mid, bottom lines anchored at 09:30 New York. No extra multipliers
• Window Trend. Close of the first N minutes relative to the session open sets direction
• Risk Bracket. Take profit and stop loss equal to VIX unit times user factor
• Session Window. Uses the exchange time of the chart
Fusion rule
Minimum gates count equals one. The trade only arms after the window has elapsed and a direction exists. One entry per session.
Signal rule
• Long when the window close is above the session open and the window has completed
• Short when the window close is below the session open and the window has completed
• Exit on channel touch. Long exits at the top. Short exits at the bottom
• Flat thirty minutes before the session close or at the user setting
Inputs with guidance
Setup
• Use VIX9D. Width source. Typical true for fast tone or false for baseline
• Use daily OPEN. Toggle for sensitivity to overnight changes
Logic
• Window minutes. Five to one hundred twenty. Larger values delay entries and reduce whipsaw
• VIX factor for TP. Zero point five to two. Raising it widens the profit target
• VIX factor for SL. Zero point five to two. Raising it widens the stop
• Exit minutes before close. Fifteen to ninety. Raising it exits earlier
Properties visible in this publication
• Initial capital one hundred thousand USD
• Base currency USD
• request.security uses lookahead off
• Commission cash per contract two point five $ per each contract. Slippage one tick
• Default order size method FIXED with value one contract. Pyramiding zero. Process orders on close ON. Bar magnifier OFF. Recalculate after order is filled OFF. Calc on every tick ON
Realism and responsible publication
No performance claims. Past results never guarantee future outcomes. Fills and slippage vary by venue. Shapes can move while a bar forms and settle on close. Strategy uses standard candles.
Honest limitations and failure modes
Economic releases and thin liquidity can break the channel. Very quiet regimes can reduce signal contrast. Session windows follow the exchange time of the chart. If both stop and target can be hit within one bar, assume stop first for conservative reading without bar magnifier.
Works best in liquid hours of New York RTH. Very large gaps and surprise news may exceed the implied channel. Always validate on the symbols you trade.
Entries and exits
• Entry logic. After the first window, go long if the window close is above the session open, go short if below
• Exit logic. Long exits at the channel top or at the take profit or stop. Short exits at the channel bottom or at the take profit or stop. Flat before session close by the configured minutes
• Risk model. Initial stop and target based on the VIX unit times user factors. No trail and no break even. No cooldown
• Tie handling. Treat as stop first for conservative interpretation
Position sizing
Fixed size one contract per trade. Target risk per trade should generally remain near one percent of account equity. Risk is based on the daily volatility value, the max loss from the tests for one year duration with 5min chart was 4%, while the avg loss was below <1% of the total capital.
If you have any questions please let me know. Thank you for coming by !

FUTURA ORB.o3 Stategy (Gap + Dynamic Risk)ORB Strategy
Includes Mini & Micro Futures
Dynamic Risk based position sizing
Adjustable RR Levels
Gap Detection
Default settings are for NQ & MNQ.
Adjust as needed for different futures.

Kz GC1! ORBStrategy that trades breakouts on GC1! futures on the 5min timeframe. It also works on MGC1! for lower drawdown and to manage Apex and Top Step accounts with the lower risk.
Risk Disclaimer:
Past results as well as strategy tester reports do not indicate future performance. Guarantees do not exist in trading. By using this strategy you risk losing all your money.
Important:
It trades all days that markets are open. Set times may be seen on settings. Trades multiple times a day sometimes.
It works on the 5 and 15min timeframe only. Results are better on 5min timeframe.
The settings are optimized already for GC1! on the 5min timeframe.
How it works:
Every trading day it measures the range of the first 15min candle of pre-selected hours. As soon as price closes above or below on the 15min timeframe, it will trade the breakout targeting a set risk to reward ratio. SL on the opposite side of the range.
Settings:
Hourly Trading Hours: These are the times that worked best for this strategy. All boxes should be checked for best results. Excluded times were when it performed bad which is why those times have been left out.
ORB Formation Period: This setting determines on which timeframe candle has to close outside the opening range box in order to take a trade. It's set to 15min by default because this is what worked by far the best
Entry Type: Entries are immediate instead of waiting for a pull back to enter on a limit order.
Limit Orders: If enabled, the strategy will place a pending order x points from the current price, instead of a market order. Immediate orders are enabled by default for a better performance. Important: It doesn't actually place a limit order. The strategy will just wait for a pullback and then enter with a market order. It's more like a hidden limit order.
Limit Order Offset Points: If you have limit orders enabled, this setting determines how many points from the current price the limit order will be placed.
FVG Detection Type: How fast it detects the fair value gaps. Standard detection over immediate had better performance
Risk Type: You can chose either between Fixed USD Amount, Risk per Trade in % or Fixed Contract Size. By default it's set to fixed contract size.
Risk Amount (USD or Contracts): This setting is to set how many USD or how many contracts you want to risk per trade. Make sure to check which risk type you have selected before you choose the risk amount.
Take Profit Multiplier: This is simply the total SL size in points multiplied by x.
Example: If you put 2, you get a 2:1 Risk to Reward Ratio. By Default it's set to 2.5 because this gave the best results in backtests.
Stop Loss Padding: This is simply the buffer in points that is added to the SL for safety reasons. If you have it on 0, the SL will be at the exact price of the opposite side of the range. By default it's set to 5 because this is what delivered the best results in backtests.
Stop Loss Placement: This determines where the stop loss gets placed for the order. It has been set to ORB Range by default as this delivered the best results.
Max Trades Per Hour: This allows the user to decide how many trades are taken an hour. 1 is been set to default for best results
Visual Settings: Check boxes to show orb range, FVG's, Entry points, and trade visualization boxes.
Backtest Settings:
For the backtest the commissions were set to 1.29USD per contract and .35USD for micros which is the highest amount Tradovate charges Margin was not accounted for because typically on prop accounts you can use way more contracts than you need for the extremely low max drawdown. Margin would be important on personal accounts but even there typically it's not an issue at all especially because this strategy runs on the 15min timeframe so it won't use a lot of contracts anyways.
Why the source code is hidden:
The source code is hidden because I invested a lot of time and money into developing this strategy and optimizing it with paid 3rd party software.

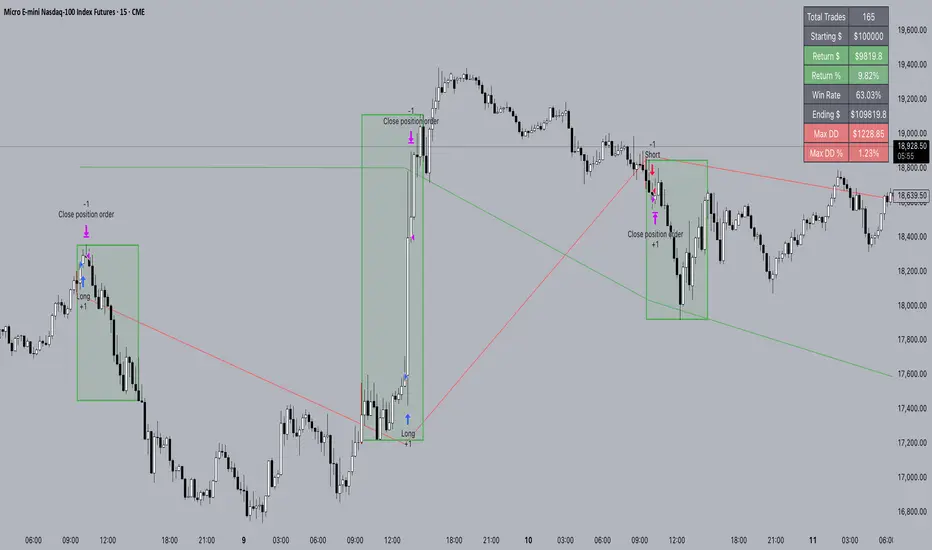
AM Range Sniper [jmaxxx]AM Range Sniper
Overview
AM Range Sniper is a sophisticated morning session trading strategy designed for Micro E-mini Nasdaq-100 Index Futures (MNQ). This strategy capitalizes on the critical 8:30-9:30 AM EST range formation period, implementing precise entry and exit mechanics with advanced risk management.
Key Features
🕐 Time-Based Range Analysis
Range Definition: Automatically identifies and tracks the 8:30-9:30 AM EST range
Trading Window: Active trading from 9:30 AM to 11:00 AM EST (extended for second chance trades)
Session Management: Daily reset ensures clean state for each trading session
🎯 Multiple Entry Patterns
Breakthrough/Retest: Captures price breakthroughs above range with retest opportunities
Long/Short Opportunities: Comprehensive coverage of both directional moves
Breakdown: Identifies bearish breakdowns below range support
Break Up: Detects bullish breakups above range resistance
Range Sweeps: Monitors for range high/low sweeps with reversal entries
⚡ Advanced Risk Management
Configurable Stop Losses: Tick-based stop losses for each trade type
Take Profit Targets: Automatic target calculations based on range size
Hard Close Protection: Automatic position closure at 4 PM EST
Second Chance Feature: Optional second trade opportunity if first trade loses
🔧 Professional Features
Visual Stop Loss Lines: Real-time stop loss visualization on chart
Debug Information Panel: Comprehensive status monitoring
Alert Integration: Customizable alert messages for entries/exits
Flexible Time Settings: Adjustable for different timezones
Strategy Logic
Range Formation (8:30-9:30 AM)
The strategy monitors the first hour of trading to establish the day's range. This range serves as the foundation for all subsequent trading decisions.
Entry Conditions
Breakthrough: Price breaks above range high with retest rejection
Breakdown: Price breaks below range low with confirmed bearish momentum
Break Up: Price breaks above range high with strong bullish confirmation
Sweep Entries: Range high/low sweeps followed by reversal signals
Risk Management
Stop Loss: Configurable tick-based stops for each trade type
Take Profit: 1.5x range size targets for breakdown/breakup trades
Position Sizing: Percentage-based position sizing
Session Limits: Maximum 2 trades per session (with second chance feature)
Settings & Customization
Core Parameters
Enable/disable individual entry patterns
Configurable stop loss levels (1-500 ticks)
Second chance feature toggle
Previous day level integration
Visual Customization
Customizable stop loss colors and widths
Debug panel visibility
Range line styling
Alert Configuration
Custom entry/exit alert messages
***** Automate With *****
APEX
NinjaTrader
Crosstrade.io ( promo code JMAXXX )
Performance & Reliability
Precision Focused: Waits for high-probability setups
Risk-Aware: Comprehensive stop loss and position management
Session-Based: Clean daily resets prevent carryover issues
Professional Grade: Designed for serious traders
Ideal For
Day Traders: Morning session specialists
Futures Traders: MNQ and similar instruments
Range Traders: Traders who capitalize on range breakouts
Risk-Conscious Traders: Those who prioritize risk management
Disclaimer
This strategy is for educational and informational purposes. Past performance does not guarantee future results. Always test thoroughly on historical data and paper trading before live implementation. Risk management is crucial - never risk more than you can afford to lose.
Created by jmaxxx - Professional trading strategy developer
For questions, feedback, or customization requests, please leave a comment below.

Opening-Range BreakoutNote: Default trading date range looks mediocre. Set date range to "Entire History" to see full effect of the strategy. 50.91% profitable trades, 1.178 profit factor, steady profits and limited drawdown. Total P&L: $154,141.18, Max Drawdown: $18,624.36. High R^2
█ Overview
The Opening-Range Breakout strategy is a mechanical, session‑based day‑trading system designed to capture the initial burst of directional momentum immediately following the market open. It defines a user‑configurable “opening range” window, measures its high and low boundaries, then places breakout stop orders at those levels once the range closes. Built‑in filters on minimum range width, reward‑to‑risk ratios, and optional reversal logic help refine entries and manage risk dynamically.
█ How It Works
Opening‑Range Formation
Between 9:30–10:15 AM ET (configurable), the script tracks the highest high and lowest low to form the day’s opening range box.
On the first bar after the range window closes, the range high (OR_high) and low (OR_low) are “locked in.”
Range‑Width Filter
To avoid false breakouts in low‑volatility mornings, the range must be at least X% of the current price (default 0.35%).
If the measured opening-range width < minimum threshold, no orders are placed that day.
Entry & Order Placement
Long: a stop‑buy order at the opening‑range high.
Short: a stop‑sell order at the opening‑range low.
Only one side can trigger (or both if reverse logic is enabled after a losing trade).
Risk Management
Once triggered, each trade uses an ATR‑style stop-loss defined as a percentage retracement of the range (default 50% of range width).
Profit target is set at a configurable Reward/Risk Ratio (default 1.1×).
Optional: Reverse on Stop‑Loss – if the initial breakout loses, immediately reverse into the opposite side on the same day.
Session Exit
Any open positions are closed at the end of the regular trading day (default 3:45 PM ET window end, with hard flat at session close).
Visual cues are provided via green (range high) and red (range low) step‑line plots directly on the chart, allowing you to see the range box and breakout triggers in real time.
█ Why It Works
Early Momentum Capture: The first 15 – 60 minutes of trading encapsulate overnight news digestion and institutional order flow, creating a well‑defined volatility “range.”
Mechanical Discipline: Clear, rule‑based entries and exits remove emotional guesswork, ensuring consistency.
Volatility Filtering: By requiring a minimum range width, the system avoids choppy, low‑range days where false breakouts are common.
Dynamic Sizing: Stops and targets scale with the opening range, adapting automatically to each day’s volatility environment.
█ How to Use
Set Your Instruments & Timeframe
-Apply to any futures contract on a 1‑ to 5‑minute chart.
-Ensure chart timezone is set to America/New_York.
Configure Inputs
-Opening‑Range Window: e.g. “0930-1015” for a 45‑minute range.
-Min. OR Width (%): e.g. 0.35 for 0.35% of current price.
-Reward/Risk Ratio: e.g. 1.1 for a modest profit target above your stop.
-Max OR Retracement %: e.g. 50 to set stop at 50% of range width.
-One Trade Per Day: toggle to limit to a single breakout.
-Reverse on Stop Loss: toggle to flip direction after a losing breakout.
Monitor the Chart
-Watch the green and red range boundaries form during the session open.
-Orders will automatically submit on the first bar after the range window closes, conditioned on your filters.
Review & Adjust
-Backtest across multiple months to validate performance on your preferred contract.
-Tweak range duration, minimum width, and R/R multiple to fit your risk tolerance and desired win‑rate vs. expectancy balance.
█ Settings Reference
Input Defaults
Opening‑Range Window - Time window to form OR (HHMM-HHMM) - 0930–1015
Regular Trading Day - Full session for EOD flat (HHMM-HHMM) - 0930–1545
Min. OR Width (%) - Minimum OR size as % of close to trigger orders - 0.35
Reward/Risk Ratio - Profit target multiple of stop‑loss distance - 1.1
Max OR Retracement (%) - % of OR width to use as stop‑loss distance - 50
One Trade Per Day - Limit to a single breakout order per day - false
Reverse on Stop Loss - Reverse direction immediately after a losing trade - true
Disclaimer
This strategy description and any accompanying code are provided for educational purposes only and do not constitute financial advice or a solicitation to trade. Futures trading involves substantial risk, including possible loss of capital. Past performance is not indicative of future results. Traders should assess their own risk tolerance and conduct thorough backtesting and forward-testing before committing real capital.

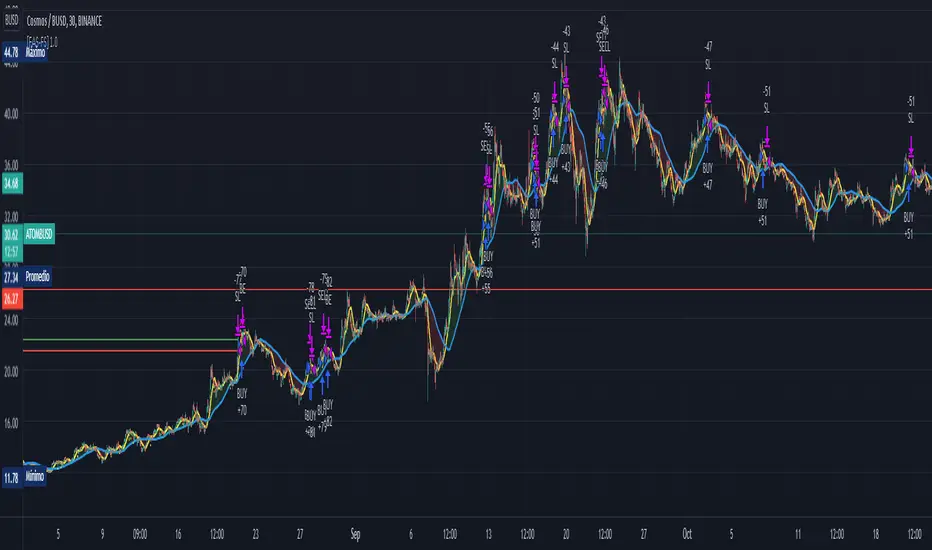
Baseline TrendBaseline Trend Strategy Overview
Baseline Trend is a crypto-only trading strategy built on straightforward price-based logic: market direction is determined solely by the price’s position relative to a selected baseline open price. No technical indicators like RSI, MACD, or volume are used—this approach is purely focused on price action and position size manipulation.
This strategy is a genuine concept, developed from my own market analysis and logical theory, refined through extensive observation of crypto market behaviour.
While the strategy offers structure and adaptability, it’s important to recognise that no single trading system or indicator fits all market conditions. This tool is meant to support decision-making, not replace it—encouraging traders to stay flexible, informed, and in control of their risk.
Important Usage Note:
This system is intended for crypto markets only.
– When used as an indicator guide, it can be applied to both spot and futures markets.
– However, when used with web-hook automation, it is designed only for futures contracts.
Ensure compatibility with your trading setup before using automation features.
Core Logic: The Baseline
The strategy revolves around the concept of a “Baseline”, with three types available:
Main Baseline: Defines the primary trend direction. If the price is above, go long; if below, go short.
Second Baseline and Third Baseline: Used to measure buying/selling pressure and are key to certain take-profit logic options.
Baselines are customisable to different timeframes—Year, Month, Week, and more—based on available input settings. Structurally, the Main Baseline is the highest-level trend reference, followed by the Second, then Third.
Users can mix and match these baselines across timeframes to backtest crypto symbols and understand behaviour patterns, particularly when used with standard candlestick charts.
Entry & Exit Logic
Entry Signal: Triggered when price crosses over/under a defined distance (percentage) from the Main Baseline. This distance is the Trade Line, calculated based on the close price.
Exit Signal / Stop Loss: If price moves un-favorable and crosses over/under the Stop Loss Line (a defined distance from the Main Baseline), the open position will be force-closed according to user-defined settings.
LiqC (Liquidation Cut)
LiqC is a secondary stop-loss that activates when a leveraged position’s loss equals or exceeds the user-defined liquidation threshold. It forcefully closes the position to help prevent full liquidation before stop-loss, providing an extra layer of protection.
This LiqC is directly tied to the leverage level set by the user. Please ensure you understand how leverage affects liquidation risk, as different broker exchanges may use different liquidation ratio models. Using incorrect assumptions or mismatched leverage values may result in unexpected behaviour.
Position Sizing & Block Units
This strategy features a block-based position sizing system designed for flexibility and precision in trade management:
Block Range: Customisable from 1 to 10 blocks
Risk Allocation: Controlled through a user-defined ROE (Risk of Equity) value
For example, setting an ROE of 0.1% with 10 blocks allocates a total of 1% of account equity to the position. This structure supports both conservative and aggressive risk approaches, depending on user preference.
Block sizes are automatically calculated in alignment with exchange requirements, using Minimum Notional Value (MNV) and Minimum Trade Amount (MTA). These values are dynamically calculated based on the live market price, and scaled relative to the trader’s balance and selected risk percentage. This ensures accurate sizing with built-in adaptability for any account level and current market conditions.
Scalping Meets Trend Holding
This system blends short-term scalping with longer-term trend holding, offering a flexible and adaptive trading style.
Example:
Enter 10 blocks → take quick profits on 5 blocks → let the remaining 5 ride the trend.
This dual-layered approach allows traders to secure early gains while staying positioned for larger market moves. Think of it as:
5 Blocks to Protect: Capture quick wins and manage exposure.
5 Blocks to Pursue: Let profits run by following the broader trend.
By combining both protection and pursuit, the strategy supports risk control without sacrificing the potential for extended returns.
Flexible Take-Profit Logic
The strategy supports multiple, customisable take-profit mechanisms:
TP1–4 (Profit Percentage)
Triggers take profit of 1 block unit when unrealised gains reach defined percentage thresholds (TP1, TP2, TP3, TP4).
Buying/Selling Pressure-Based Take Profit
D1 – Pressure 1
Measures pressure between Second and Third Baselines.
If the distance between them exceeds a user-defined DPT (Decrease Post Threshold) and the price moves far enough from the Third Baseline, D1 activates to take profit or scale out one block.
D2 – Pressure 2
Measures pressure between the Main and Second Baselines.
Works similarly to D1, using a separate distance and pressure trigger.
Note: Both D1 and D2 deactivate in reversal or even trend conditions.
D3–5: High-High / Low-Low Logic
Based on bar index tracking after position entry:
For Long Positions: If after D3 bars the price doesn't exceed the previous bar's high, the system executes a take profit or scale-out.
For Short Positions: If the price doesn't drop below the previous low, the same logic applies.
This approach adds time-based and momentum-aware exit flexibility.
Leverage & Liquidation Risk
When backtesting with leverage enabled, the system checks whether historical candles exceed the liquidation range, calculated based on the average entry price and the leverage input. If the Liquidation Risk Count exceeds 1, profit and loss accuracy may be affected. Traders are encouraged to monitor this count closely to ensure realistic backtesting results.
Since the system cannot directly control or sync with your broker exchange’s actual leverage setting, it’s important to manually match the system’s leverage input with your broker’s configured leverage.
For example: If the system leverage input is set to 10, your exchange leverage setting must also be set to 10. Any mismatch will lead to inaccurate liquidation risk and PnL calculations.
Backtesting and Customisation
All TP1–4 and D1–5 functions are fully optional and customisable. Users are encouraged to backtest different crypto symbols to observe how price behaviour aligns with baseline structures and pressure metrics.
Each of the TP1–4 and D1–5 triggers is designed to execute only once per open position, ensuring controlled and predictable behaviour within each trade cycle.
Since backtesting is based on available historical bar data, please note that data availability varies depending on your TradingView subscription plan. For more reliable insights, it’s recommended to backtest across multiple time ranges, not just the full dataset, to assess the stability and consistency of the strategy’s performance over time.
Additionally, the time frame resolution interval in TradingView is customisable. For best results, use commonly supported time frames such as 30 minutes, 1 hour, 4 hours, 1 day, or 1 week. While the system is designed to support a broad range of intervals, non-standard resolutions may still cause calculation errors.
Currently, the system supports the following resolution ranges:
Intraday: from 1 minute to 720 minutes
(e.g., 60 minutes = 1 hour, 240 minutes = 4 hours, 720 minutes = 12 hours)
Daily: from 1 day to 6 days
Weekly: from 1 week to 3 weeks
Monthly: from 1 month to 4 months
Although the script is built to adapt to various resolutions, users should still monitor output behaviour closely, especially when testing less common or edge-case time frames.
System Usage Notice:
This system can be used as a standalone trading indicator or integrated with an exchange that supports web-hook signal execution. If you choose to automate trades via web-hook, please ensure you fully understand how to configure the setup properly. Web-hook integration methods vary between exchanges, and incorrect setup may lead to unintended trades. Users are responsible for ensuring proper configuration and monitoring of their automation.
Note on Lower Time Frame Usage
When using lower time frames (e.g., 1-minute charts) as the trading time frame, please be aware that available historical data may be limited depending on your subscription plan. This can affect the depth and reliability of backtesting, making it harder to establish a trustworthy probability model for a symbol’s behaviour over time.
Additionally, when pairing a high-level Main Baseline (MBL) time line (such as "1 Month") with low time frame resolutions (like 1-minute), you may encounter order execution limits or calculation overloads during backtesting. This is due to the large number of historical bars required, which can strain the system's capacity.
That said, if a user intentionally chooses to work with lower time frames, that decision is fully respected—but it should be done with awareness and at the user’s own risk.
Things to Be Aware Of (Web-hook Usage Only)
The following points apply if you're using web-hook automation to send signals from the system to an exchange:
Alert Signal Reliability
During extreme market volatility, some broker exchanges may fail to respond to web-hook signals due to traffic overload. While rare, this has occurred in the past and should be considered when relying on automation.
Alert Expiration (TradingView)
If you're on a Basic plan, TradingView alerts are only active for a limited time—typically around 1.5 months. Once expired, signals will no longer be sent out.
To keep your system active, reset the alert before expiration. For uninterrupted alerts, consider upgrading to a Premium plan, which supports permanent alert activation.
TradingView Alert Maintenance
TradingView may occasionally perform system maintenance, during which alerts may temporarily stop functioning. It’s recommended to monitor TradingView’s status if you’re relying on real-time automation.
Repainting
As of the current version, no repainting behaviour has been observed. Signal stability and consistency have been maintained across real-time and historical bars.
Order Execution Type and Fill Logic
All signals use Limit orders by default, except for MBL Exit and Fallback execution, which use Market orders.
Since Limit orders are not guaranteed to fill, the system includes logic to cancel unfilled orders and resend them. If necessary, a Fallback Market order is used to avoid conflict with new incoming trades.
This has only happened once, and is considered rare, but users should always monitor execution status to ensure accuracy and alignment with system behaviour.
Feedback
If you encounter any errors, bugs, or unexpected behaviour while using the system, please don’t hesitate to let me know. Your input is invaluable for helping improve the strategy in future updates.
Likewise, if you have any suggestions or ideas for enhancing the system—whether it’s a new feature, adjustment, or usability improvement—please feel free to share. Together, we can continue refining the tool to make it more robust and beneficial for everyone.
Disclaimer
All trading involves risk, particularly in the crypto market where conditions can be highly volatile. Past performance does not guarantee future outcomes, and market behaviour may evolve over time. This strategy is offered as a tool to support trading decisions and should not be considered financial or investment advice. Each user is responsible for their own actions and accepts full responsibility for any results that may arise from using this system.

FXC NQ Opening Range Breakout Strategy V2.4Mechanical Strategy that trades breakouts on NQ futures on the 15min timeframe during the NYSE session. It's designed to manage Apex and Top Step accounts with the lowest risk possible.
Risk Disclaimer:
Past results as well as strategy tester reports do not indicate future performance. Guarantees do not exist in trading. By using this strategy you risk losing all your money.
Important:
It only trades on Monday, Wednesday and Friday and takes usually only 1 trade per trading day.
It works on the 15min timeframe only.
The settings are optimised already for NQ but feel free to change them.
How it works:
Every selected trading day it measures the range of the first 15min candle after the NYSE open. As soon as price closes above on the 15min timeframe, it will trade the breakout targeting a set risk to reward ratio. SL on the opposite side of the range. It will trail the SL after a set amount of points and uses a buffer of the set amount of points to trail it.
Settings:
Opening Range Time : This is the time of the day in hours and minutes when the strategy starts looking for trades. It's in the EST/ NY Timezone and set to 9:30-09:45 by default
because that's the NYSE open.
Session Time : This is the time of the day in hours and minutes until the strategy trades. It's in the EST/ NY Timezone and set to 09:45-14:45 by default.
because that's what gave the best results in backtesting. Open trades will get closed automatically once the end of the session is reached. No matter if win or loss. This is just to prevent holding positions over night.
Session Border This setting is to select the border color in which the session box will be plotted.
Opening Range Box This setting is to select the fill color of the opening range box.
Opening Range Border This setting is to select the border color of the session box.
Trade Timeframe This setting determines on which timeframe candle has to close outside the opening range box in order to take a trade. It's set to 15min by default because this is what worked by far the best in backtests and live trading.
Stop Loss Buffer in Points: This is simply the buffer in points that is added to the SL for safety reasons. If you have it on 0, the SL will be at the exact price of the opposite side of the range. By default it's set to 0 pips because this is what delivered the best results in backtests.
Profit Target Factor: This is simply the total SL size in points multiplied by x.
Example: If you put 2, you get a 1:2 Risk to Reward Ratio. By Default it's set to 4 because this gave the best results in backtests, because trades always get closed either by trailing SL or because the end of the session is reached.
Use Trailing Stop Loss: This setting is to enable/ disable the trailing stop loss. It's enabled by default because this is a fundamental part of the strategy.
Trailing Stop Buffer: This setting determines after how many points in profit the trailing SL will be activated.
Risk Type: You can chose either between Fixed USD Amount, Risk per Trade in % or Fixed Contract Size. By default it's set to fixed contract size.
Risk Amount (USD or Contracts): This setting is to set how many USD or how many contracts you want to risk per trade. Make sure to check which risk type you have selected before you chose the risk amount.
Use Limit Orders If enabled, the strategy will place a pending order x points from the current price, instead of a market order. Limit orders are enabled by default for a better performance. Important: It doesn't actually place a limit order. The strategy will just wait for a pullback and then enter with a market order. It's more like a hidden limit order.
Limit Order Distance (points): If you have limit orders enabled, this setting determines how many points from the current price the limit order will be placed.
Trading Days: These checkboxes are to select on which week days the strategy has to trade. Thursday is disabled by default because backtests have shown that Thursday is the least profitable day
Backtest Settings:
For the backtest the commissions ere set to 0.35 USD per mini contract which is the highest amount Tradeovate charges. Margin was not accounted for because typically on Apex accounts you can use way more contracts than you need for the extremely low max drawdown. Margin would be important on personal accounts but even there typically it's not an issue at all especially because this strategy runs on the 15min timeframe so it won't use a lot of contracts anyways.
What makes it unique:
This script is unique because it's designed to be used on Apex and Top Step accounts with extremely strict drawdown rules.
The strategy is optimised to be traded with a fixed contract size instead of using % risk. The reason for that is that the drawdown rules of these Futures Prop Accounts are very strict and the fact that the smallest trade-able contract size is 1.
Why the source code is hidden:
The source code is hidden because I invested a lot of time and money into developing this strategy and optimising it with paid 3rd party software. Also since I use it myself on my Apex accounts and prop firms don't allow copy trading I don't want it to be used by too many traders.
DNSE VN301!, SMA & EMA Cross StrategyDiscover the tailored Pinescript to trade VN30F1M Future Contracts intraday, the strategy focuses on SMA & EMA crosses to identify potential entry/exit points. The script closes all positions by 14:25 to avoid holding any contracts overnight.
HNX:VN301!
www.tradingview.com
Setting & Backtest result:
1-minute chart, initial capital of VND 100 million, entering 4 contracts per time, backtest result from Jan-2024 to Nov-2024 yielded a return over 40%, executed over 1,000 trades (average of 4 trades/day), winning trades rate ~ 30% with a profit factor of 1.10.
The default setting of the script:
A decent optimization is reached when SMA and EMA periods are set to 60 and 15 respectively while the Long/Short stop-loss level is set to 20 ticks (2 points) from the entry price.
Entry & Exit conditions:
Long signals are generated when ema(15) crosses over sma(60) while Short signals happen when ema(15) crosses under sma(60). Long orders are closed when ema(15) crosses under sma(60) while Short orders are closed when ema(15) crosses over sma(60).
Exit conditions happen when (whichever came first):
Another Long/Short signal is generated
The Stop-loss level is reached
The Cut-off time is reached (14:25 every day)
*Disclaimers:
Futures Contracts Trading are subjected to a high degree of risk and price movements can fluctuate significantly. This script functions as a reference source and should be used after users have clearly understood how futures trading works, accessed their risk tolerance level, and are knowledgeable of the functioning logic behind the script.
Users are solely responsible for their investment decisions, and DNSE is not responsible for any potential losses from applying such a strategy to real-life trading activities. Past performance is not indicative/guarantee of future results, kindly reach out to us should you have specific questions about this script.
---------------------------------------------------------------------------------------
Khám phá Pinescript được thiết kế riêng để giao dịch Hợp đồng tương lai VN30F1M trong ngày, chiến lược tập trung vào các đường SMA & EMA cắt nhau để xác định các điểm vào/ra tiềm năng. Chiến lược sẽ đóng tất cả các vị thế trước 14:25 để tránh giữ bất kỳ hợp đồng nào qua đêm.
Thiết lập & Kết quả backtest:
Chart 1 phút, vốn ban đầu là 100 triệu đồng, vào 4 hợp đồng mỗi lần, kết quả backtest từ tháng 1/2024 tới tháng 11/2024 mang lại lợi nhuận trên 40%, thực hiện hơn 1.000 giao dịch (trung bình 4 giao dịch/ngày), tỷ lệ giao dịch thắng ~ 30% với hệ số lợi nhuận là 1,10.
Thiết lập mặc định của chiến lược:
Đạt được một mức tối ưu ổn khi SMA và EMA periods được đặt lần lượt là 60 và 15 trong khi mức cắt lỗ được đặt thành 20 tick (2 điểm) từ giá vào.
Điều kiện Mở và Đóng vị thế:
Tín hiệu Long được tạo ra khi ema(15) cắt trên sma(60) trong khi tín hiệu Short xảy ra khi ema(15) cắt dưới sma(60). Lệnh Long được đóng khi ema(15) cắt dưới sma(60) trong khi lệnh Short được đóng khi ema(15) cắt lên sma(60).
Điều kiện đóng vị thể xảy ra khi (tùy điều kiện nào đến trước):
Một tín hiệu Long/Short khác được tạo ra
Giá chạm mức cắt lỗ
Lệnh chưa đóng nhưng tới giờ cut-off (14:25 hàng ngày)
*Tuyên bố miễn trừ trách nhiệm:
Giao dịch hợp đồng tương lai có mức rủi ro cao và giá có thể dao động đáng kể. Chiến lược này hoạt động như một nguồn tham khảo và nên được sử dụng sau khi người dùng đã hiểu rõ cách thức giao dịch hợp đồng tương lai, đã đánh giá mức độ chấp nhận rủi ro của bản thân và hiểu rõ về logic vận hành của chiến lược này.
Người dùng hoàn toàn chịu trách nhiệm về các quyết định đầu tư của mình và DNSE không chịu trách nhiệm về bất kỳ khoản lỗ tiềm ẩn nào khi áp dụng chiến lược này vào các hoạt động giao dịch thực tế. Hiệu suất trong quá khứ không chỉ ra/cam kết kết quả trong tương lai, vui lòng liên hệ với chúng tôi nếu bạn có thắc mắc cụ thể về chiến lược giao dịch này.

action zone - ATR stop reverse order strategy v0.1 by 9nckACTION ZONE-ATR MOD v0.1 DOCUMENTATION
Overview
This tradingview pine script strategy is mainly created to enrich my coding skill. It is a combination of “CDC-ACTIONZONE” and my personal studies of trading techniques in various sources e.g.book, course or blog. This strategy purposefully built to connect with my automatic trading bot. However, It will be very useful to aid your trading routine by diminishing mental distraction which possibly leads to bad trades.
How does it work?
This strategy will do a basic simple thing that most traders do by creating entry signals on both sides long/short and also set the stop loss. Furthermore, It will also reverse the order (from long to short and vice versa (if long/short conditions are met). Finally, it will recalculate the stop loss/take profit price in every complete bar to increase the chance of winning and limit our loss.
Entry rules(Long/Short)
If you have no open order, an order will be created when a fast EMA crosses(up(long)/down(short) the slow EMA(It’s as simple as that).
If you have an open order, the current order will be (sold if long, covered if short) and the opposite side order will be created.
Exit and Reverse rules(Long/Short)
If fast EMA cross (DOWN(long), UP(short)), the current order will be closed, THE OPPOSITE SIDE ORDER WILL ALSO BE CREATED.
Risk management
FLEX STOP PRICE : initial value will be set at the bar which order created. It is a fast ema (+/-) MIDDLE ATR value.
If MIDDLE ATR value rises, it will be our new stop price.
If MIDDLE ATR value falls, stop price unchanged
If Price OVERBOUGHT(long)/SOLD(short), LOW of that bar will be a new stop price.
Minimum position hold period
In order to eliminate risk of repeatedly open, close orders in sideway trends. Minimum hold period must be passed to start exit our position. However, It always respects stop loss prices. The value refers to the number of bars.
MUST READ!!!
This strategy uses only MARKET ORDER. If you trade with a bot, make sure you choose only enormous market cap tokens.
This strategy is bi-direction strategy. It will work best in the DERIVATIVE market.
It was initially designed to compete in the cryptocurrency market which has very high volume and volatility.
I only use this strategy in 1HR (acceptable change rate, optimum trade frequency)
How (should) we use it?
Choose crypto future pairs (recommend only top 10-15 market volume pairs in Binance, let’s say 1000M+ trade value)
Choose your time frame (1H is strongly recommended)
Setup your portfolio profile (Setting->Properties) such as Initial cap, order size, commission. DO NOT USE CAL ON EVERY TICK IT WILL CAUSE REPAINTING AND YOUR CAPITAL IS BLEEDING !!!
BACKTEST FIRST!! Back test is a combination of art, math and statis(and a bit of luck). You can apply to train and test methods or whatever you are familiar with. In my opinion, your test period should include UPTREND, SIDEWAY, DOWNTREND. Fine tune fast, slow ema first(my best ema length of 1H timeframe around 7-10, 17-22). Try to eliminate fault breakout trade and use other options only necessary. Hopefully we can use automatic optimization on Pine Script soon.
Don’t forget to turn off using a specific backtest date option to start your strategy.A
THIS IS NOT A PERFECT (OR EVEN PROFITABLE) STRATEGY. USE AT YOUR OWN RISK AND TRADE RESPONSIBLY. DYOR DUDE.

[Fedra Algotrading Strategy Futures Signals]Linear Regression + Take Profit and Percentage Stop Loss
Optimize the parameters in backtesting to find the best entries, define your profit and risk strategy, take advantage of statistics and make trades without letting the psychological factor make you commit mistakes.
The strategy chooses the time to buy when the price breaks down the deviation of the linear regression calculated on the basis of the last lows prices and allows you to generate alerts.
It also includes an emergency exit at Break Even (1.5%) when it detects a negative trend in the short term.
It also has an advanced trend filter to avoid opening trades against the market.
*************************************
Regresión lineal + Take Profit y Stop loss porcentual
Optimice los parámetros en backtesting para encontrar las mejores entradas, defina su estrategia de profit y riesgo, apreveche las estadísticas y haga operaciones son dejar que el factor psicológico le haga cometer errores.
La estrategia elige el momento de compra cuando el precio rompe hacia abajo la desviación de la regresión lineal calculada en base a lows últimos precios y permite generar alertas.
También incluye una salida de emergencia en Break Even (1.5%) cuando detecta una tendencia negativa en el corto plazo.
Tiene también un filtro avanzado de tendencia para no abrir operaciones en contra del mercado.
Volume RSI Crypto This is a special version RSI, in this case , I am using the volume, which is measuring the speed and change of volume to the price both up and down size.
Volume RSI attempts to gauge price trend changes via changes in bullish and bearish movements.
Its formula is :
VoRSI = 100 - 100 / (1 + VoRS)
where VoRS is Volume Relative Strength over specified period which is calculated as a ratio between averages of Up-Volumes and Down-Volumes:
VoRS = (Average Up-Volume) / (Average Down-Volume)
The logic for this strategy is simple
We entry long when we have a crossover with the Overbought level and we entry short when we have a crossunder with oversold level.
If you have any questions, please let me knw !

CRYPTO RVI FUTURE 1HThis is a crypto strategy adapted for the futures pairs, especially the perpusdt ones from binance for 1h time frame.
The main component here is the RVI, which is a modified form of the RSI indicator. The RVI, measures more the general direction of the volatility, and can get the trends far smoother than the RSI.
The logic inside is the same like we would normally do with RSI, we check for overbought and oversold levels, and based of that we have an entry or exit depending if we go long or short.
I have tested this product with all the pairs from PERPUSDT from binance and seems to works with the majority of them, of course on some better than the others.
If there are any questions, please let me know !

PerPro V8 Futures Version 1.1Perpro futures ES, CL ,NQ etc scalper.
Best performance time frame 5 Minutes.
SMA Futures Scalper - Long / Short / Trailing StopSMA Futures Scalper - Long / Short / Trailing Stop
It generates long/short signals and apply trailing stop of 3pts and offset of 1pt. Also with 3 contracts per open/closing trades.
How does it look? Let me know in the comments

PerPro V5 Publish updatedSend me a private message to be enabled
Algorithmic system with 80% assertiveness. DO NOT REPAINT
Please read
Use the system using other trend indicators. I attach some.
ideal for use in channels, resistances supports and Fibonacci levels.
Setting recommendation
- "For 1min TF = 15min"
- "For 5min TF = 60"
- "For 1H Forex TF = 4H Or D, for stock 1H TF = D"
- "For Day use TF = W"
- "For Week TF = M"
COINBASE:BTCUSD
Attached some indicators that may be useful
