GC

Futures Position Size Calculator (NQ/ES)DISCLAIMER:
This indicator is provided solely for informational and educational purposes. It calculates position sizing based on user-defined inputs such as entry and stop-loss levels, but it does not provide trading signals, recommendations, or financial advice . All trading decisions are made at the sole discretion of the user.
By using this indicator, you acknowledge that you are fully responsible for your own trades and risk management . The developer/publisher of this indicator assumes no liability for any losses, damages, or financial consequences that may arise from its use.
Features:
• Position size calculator (based on Entry & Stop Loss)
• Reward ratio calculator (1R, 2R, 3R, etc.)
• Supports: NQ / MNQ / ES / MES
Usage:
When you first add the script to your chart (on any supported futures symbol), you will be prompted to set the Entry Price and Stop Loss Price on the chart using draggable lines .
After setup, you can freely move the price lines, and the indicator will automatically update:
• Position size
• Reward targets
• Direction (long/short is auto-detected)
RISK Settings:
You can calculate position size using either:
1. Account Percent
Select "Percent" in the Risk Method dropdown and enter the percent of your account you want to risk per trade.
2. Fixed Dollar Amount
Select "Fixed Dollar" in the Risk Method dropdown and enter the dollar amount you want to risk.
You may set separate values for: NQ, MNQ, ES, and MES.
Reward Calculator:
Enable the checkbox "Show Reward Targets" in the Reward Ratio section to display projected targets (1R, 2R, etc.).
You can also choose how many R-levels are displayed on the chart.

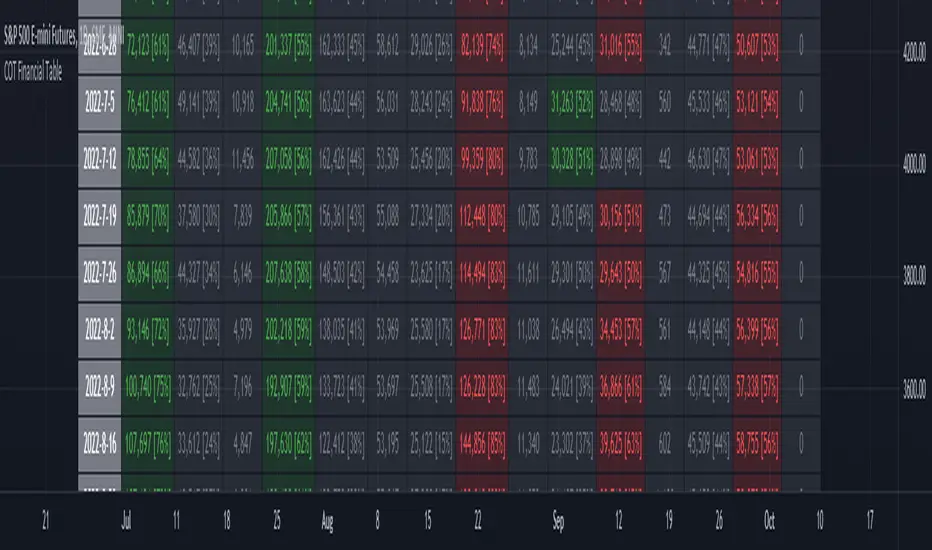
ILM COT Financial Table - CFTCUse this indicator on Daily Timeframe
Please refer to the below link for CFTC Financials
www.cftc.gov
This script shows the Financial COT for the respective instrument by deriving the CFTC code.
Option is provided to override the CFTC code
User can also configure the historical CFTC data view
The script calculates the Long% vs Short% for various categories (Dealers/Asset Managers/Leveraged Funds/Other Reportables) and color codes the column appropriately.
The goal of this script is to show all the financial CFTC data on a single page to digest the data better in a tabular form
Fixed the default TradingView Library which has some errors with CFTC code mapping.
For example, SPX CFTC Code #13874+ which is the most important one where big players take positions is not there in the default Library.
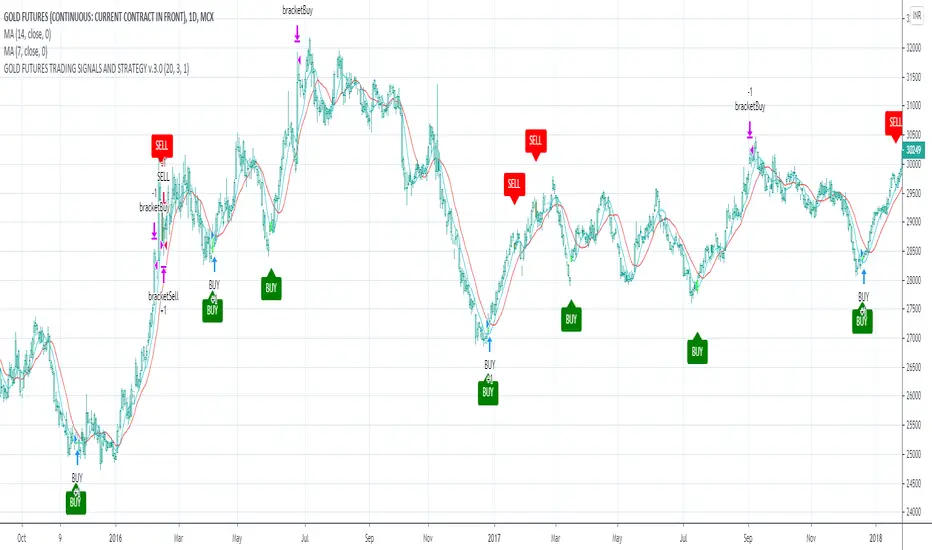
GOLD FUTURES TRADING STRATEGY AND SIGNALS WITH PERFORMANCE GOLD FUTURES GOLD1! , GOLDM , GC Trading Strategy And Signals, With Performance For Different Time Frames.
We present to your attention an indicator that, based on a strategy, generates buy / sell arrow signals and a gold futures trading strategy, which has shown its effectiveness in numerous tests on different time frames.
The strategy is based on a combination of ATR, Moving Average, MACD and RSI indicators.
If you consider gold as a tool for earning then active trading on the exchange, your choice is gold futures (gold futures). This derivative almost completely copies the movement of the price of physical gold, and is used by traders around the world to obtain from the fluctuations in the price of gold.
The strategy showed the best results for timeframes: H1, H2, H4, D1.
Recommended timeframe for this strategy: D1.
The strategy uses take-profit and stop-loss, which reduces risk and allows you to effectively use its trading, as well as the process of making trading decisions and predicting the movement of the gold price.
Gold and silver futures can be used to hedge against inflation, speculative play, an alternative investment grade, or as a commercial hedging method for investors looking for opportunities beyond traditional equities and fixed income securities.
The script can generate alters "Buy" and "Sell".
The presented indicator of signals for gold futures, as well as the strategy, can complement your existing strategy and increase its performance, and can also be considered as an independent trading strategy for gold futures contracts.
Full Screenshot chart with performance here.

Gold trading strategy with trend follow and TDOW conceptMy strategy uses a combination of three indicators MACD Stochastic RSI.
The Idea is to buy when ( MACD > Signal and RSI > 50 and Stochastic > 50) occures at the same time
This strategy works well on stocks and cryptos especially during market breaking up after consolidation
The best results are on Daily charts , so its NOT a scalping strategy. But it can work also on 1H charts.
The strategy does not have any stops and profit targets, so we can take all the market can give us at the moment.
The exit point only when MACD goes under Signal
In addition I've decided to add a stop loss and "Trading day of week" concept
So the results are much more stable and we get more profit !
So, use it, trade it.
If it will help you to imprive your trading results, please donate me
BTC: 12kd1F8buWisUBdq27BBwRkUvzW7Ey3og5
