Smart Money Range + Displacement🧠 How This Indicator Works
This indicator is based on Smart Money Concepts, which follow how institutions actually move the market:
Build liquidity → Take liquidity → Show intent → Move price
It does not predict the market.
It reacts only after confirmation.
1️⃣ Trend Filter (EMA) – Market Direction
What it does:
The Exponential Moving Average (EMA) shows the dominant market direction.
How it’s used:
Price above EMA → bullish bias → only BUY signals
Price below EMA → bearish bias → only SELL signals
Why it matters:
Institutions usually push price in the direction of the higher-timeframe trend.
This filter removes low-probability counter-trend trades.
2️⃣ Smart Money Range – Liquidity Zone
What it does:
The indicator calculates the highest high and lowest low over a fixed number of candles to create a trading range.
Why this range matters:
Equal highs and equal lows form inside ranges
Retail stop-loss orders accumulate at range boundaries
These areas become liquidity pools
Institutions need liquidity to enter large positions — this shows where it is.
3️⃣ Liquidity Sweep – Stop Hunt Detection
What it does:
The indicator detects when price breaks above or below the range but fails to close outside it.
What this means:
Stops above highs or below lows are triggered
Retail traders are trapped
Smart money absorbs liquidity
This is manipulation, not a real breakout.
4️⃣ Displacement Candle – Institutional Entry
What it does:
The indicator checks for a candle with a body significantly larger than recent candles.
Why displacement is important:
Large candle bodies show strong order flow
Confirms that institutions have entered the market
Filters out weak or fake moves
No displacement = no trade.
5️⃣ Trade Confirmation Logic – Final Signal
BUY Signal Conditions
Liquidity taken below the range
Strong displacement candle
Price above EMA
SELL Signal Conditions
Liquidity taken above the range
Strong displacement candle
Price below EMA
Meaning:
Only trade after liquidity is taken and real momentum appears in trend direction.
6️⃣ Signal Plotting – Clear Execution
What you see on the chart:
BUY label below the candle
SELL label above the candle
Signals appear only after candle close, ensuring no repainting.
🔁 Market Behavior This Indicator Reads
Market moves sideways (range formation)
Liquidity builds
Stops are taken (false breakout)
Displacement confirms intent
Price expands in one direction
This is how institutional trading works.
⚠️ Best Usage Guidelines
Best timeframes: 15m, 30m, 1H
Avoid major news releases
Wait for candle close
Use structure-based stop loss, not fixed pips
🎯 Why This Indicator Is Effective
Logic-based, not lag-based
No repainting
Works on Gold, BTC, Forex, Indices
Filters noise and emotional trading
Goldtrading

3/4-Bar GRG / RGR Pattern (Conditional 4th Candle)This indicator can be used to identify the Green-Red-Green or Red-Green-Red pattern.
It is a price action indicator where a price action which identifies the defeat of buyers and sellers.
If the buyers comprehensively defeat the sellers then the price moves up and if the sellers defeat the buyers then the price moves down.
In my trading experience this is what defines the price movement.
It is a 3 or 4 candle pattern, beyond that i.e, 5 or more candles could mean a very sideways market and unnecessary signal generation.
How does it work?
Upside/Green signal
Say candle 1 is Green, which means buyers stepped in, then candle 2 is Red or a Doji, that means sellers brought the price down. Then if candle 3 is forming to be Green and breaks the closing of the 1st candle and opening of the 2nd candle, then a green arrow will appear and that is the place where you want to take your trade.
Here the buyers defeated the sellers.
Sometimes candle 3 falls short but candle 4 breaks candle 1's closing and candle 2's opening price. We can enter on candle 4.
Important - We need to enter the trade as soon as the price moves above the candle 1 and 2's body and should not wait for the 3rd or 4th candle to close. Ignore wicks.
I have restricted it to 4 candles and that is all that is needed. More than that is a longer sideways market.
I call it the +-+ or GRG pattern.
Stop loss can be candle 2's mid for safe traders (that includes me) or candle 2's body low for risky traders.
Back testing suggests that body low will be useless and result in more points in loss because for the bigger move this point will not be touched, so why not get out faster.
Downside/Red signal
Say candle 1 is Red, which means sellers stepped in, then candle 2 is Green or a Doji, that means buyers took the price up. Then if candle 3 is forming to be Red and breaks the closing of the 1st candle and opening of the 2nd candle then a Red arrow will appear and that is the place where you want to take your trade.
Sometimes candle 3 falls short but candle 4 breaks candle 1's closing and candle 2's opening price. We can enter on candle 4.
We need to enter the trade as soon as the price moves below the candle 1 and 2's body and should not wait for the 3rd or 4th candle to close.
I have restricted it to 4 candles and that is all that is needed. More than that is a longer sideways market.
I call it the -+- or RGR pattern.
Stop loss can be candle 2's mid for safe traders ( that includes me) or candle 2's body high for risky traders.
Back testing suggests that body high will be useless and result in more points in loss because for the bigger move this point will not be touched, so why not get out faster.
Important Settings
You can enable or disable the 4th candle signal to avoid the noise, but at times I have noticed that the 4th candle gives a very strong signal or I can say that the strong signal falls on the 4th candle. This is mostly a coincidence.
You can also configure how many previous bars should the signal be generated for. 10 to 30 is good enough. To backtest increase it to 2000 or 5000 for example.
Rest are self explanatory.
Pointers
If after taking the trade, the next candle moves in your direction and closes strong bullish or bearish, then move SL to break even and after that you can trail it.
If a upside trade hits SL and immediately a down side trade signal is generated on the next candle then take it. Vice versa is true.
Trades need to be taken on previous 2 candle's body high or low combined and not the wicks.
The most losses a trader takes is on a sideways day and because in our strategy the stop loss is so small that even on a sideways day we'll get out with a little profit or worst break even.
Hold targets for longer targets and don't panic.
If last 3-4 days have been sideways then there is a good probability that day will be trending so we can hold our trade for longer targets. Target to hold the trade for whole day and not exit till the day closes.
In general avoid trading in the middle of the day for index and stocks. Divide the day into 3 parts and avoid the middle.
Use Support/Resistance, 10, 20, 50, 200 EMA/SMA, Gaps, Whole/Round numbers(very imp) for identifying targets.
Trail your SL.
For indexes I would use 5 min and 15 min timeframe.
For commodities and crypto we can use higher timeframe as well. Look for signals during volatile time durations and avoid trading the whole day. Signal usually gives good targets on those times.
If a GRG or RGR pattern appears on a daily timeframe then this is our time to go big.
Minimum Risk to Reward should be 1:2 and for longer targets can be 1:4 to 1:10.
Trade with small lot size. Money management will happen automatically.
With small lot size and correct Risk-Re ward we can be very profitable. Don't trade with big lot size.
Stay in the market for longer and collect points not money.
Very imp - Watch market and learn to generate a market view.
Very imp - Only 4 candles are needed in trading - strong bullish, strong bearish, hammer, inverse hammer and doji.
Go big on bearish days for option traders. Puts are better bought and Calls are better sold.
Cluster of green signals can lead to bigger move on the upside and vice versa for red signals.
Most of this is what I learned from successful traders (from the top 2%) only the indicator is mine.

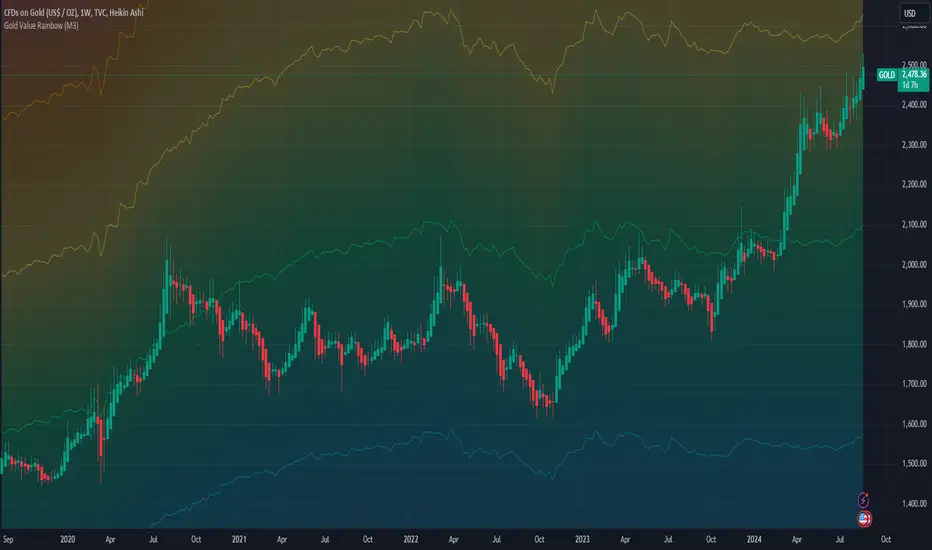
Gold Value RainbowThis indicator can only be used with 'GOLD' ticker. It is used to estimate Gold valuation based on major countries base money supply M0 such as US, EU, JP and CN. These 4 countries represent nearly 75% of total global money supply in the world. The chart will compare how gold value will move alongside with base money supply for comparison study. The chart presented here is just a relative comparison with some scaling and shifting so it doesn't refers to any real measurement. However it can be used to track gold price whether it's too cheap or too expensive in relative to money supply available in the market.
- The gray line represent major countries money supply M0
- The rainbow above the gray line represent the multiplication factors from 1x, 2x, ..., 10x
- The rainbow below the gray line represent the division factors from 0.8x, 0.6x, ..., 0.2x
Check other script to value stock and index:
- Stock Value Rainbow: script to value stock based on book value, earning, dividend and cash flow
- Index Value Rainbow: script to value index based on fed balance sheet and base money supply
- Gold Value Rainbow: script to value gold based on global money supply
- Stock Value US: script to check US stock value
- Stock Value EU: script to check EU stock value
- Stock Value JP: script to check JP stock value
- Stock Value CN: script to check CN stock value
In Chart Currency TickersQuick View of Multiple Currencies & Gold Price on Chart
In Chart Currency Tickers will help quick view of Multiple Currencies (Up/Down points & Percentage), you can change symbols on settings as per your requirement
മെയിൻ കറൻസികളും സ്വർണവിലയും റിയൽ ടൈം മോണിറ്റർ ചെയ്യുന്നതിനും മാർക്കറ്റ് സെന്റിമെൻറ് അറിയുന്നതിനും അതിനനുസരിച്ച് ട്രേഡിങ്ങ് ഡിസിഷൻ എടുക്കുന്നതിനും നിങ്ങളെ സഹായിക്കുന്നു
Happy Trading to All..!!!
Asif Kerim Naduvilaparambil

Volatility Risk Premium GOLD & SILVER 1.0ENGLISH
This indicator (V-R-P) calculates the (one month) Volatility Risk Premium for GOLD and SILVER.
V-R-P is the premium hedgers pay for over Realized Volatility for GOLD and SILVER options.
The premium stems from hedgers paying to insure their portfolios, and manifests itself in the differential between the price at which options are sold (Implied Volatility) and the volatility GOLD and SILVER ultimately realize (Realized Volatility).
I am using 30-day Implied Volatility (IV) and 21-day Realized Volatility (HV) as the basis for my calculation, as one month of IV is based on 30 calendaristic days and one month of HV is based on 21 trading days.
At first, the indicator appears blank and a label instructs you to choose which index you want the V-R-P to plot on the chart. Use the indicator settings (the sprocket) to choose one of the precious metals (or both).
Together with the V-R-P line, the indicator will show its one year moving average within a range of +/- 15% (which you can change) for benchmarking purposes. We should consider this range the “normalized” V-R-P for the actual period.
The Zero Line is also marked on the indicator.
Interpretation
When V-R-P is within the “normalized” range, … well... volatility and uncertainty, as it’s seen by the option market, is “normal”. We have a “premium” of volatility which should be considered normal.
When V-R-P is above the “normalized” range, the volatility premium is high. This means that investors are willing to pay more for options because they see an increasing uncertainty in markets.
When V-R-P is below the “normalized” range but positive (above the Zero line), the premium investors are willing to pay for risk is low, meaning they see decreasing uncertainty and risks in the market, but not by much.
When V-R-P is negative (below the Zero line), we have COMPLACENCY. This means investors see upcoming risk as being lower than what happened in the market in the recent past (within the last 30 days).
CONCEPTS :
Volatility Risk Premium
The volatility risk premium (V-R-P) is the notion that implied volatility (IV) tends to be higher than realized volatility (HV) as market participants tend to overestimate the likelihood of a significant market crash.
This overestimation may account for an increase in demand for options as protection against an equity portfolio. Basically, this heightened perception of risk may lead to a higher willingness to pay for these options to hedge a portfolio.
In other words, investors are willing to pay a premium for options to have protection against significant market crashes even if statistically the probability of these crashes is lesser or even negligible.
Therefore, the tendency of implied volatility is to be higher than realized volatility, thus V-R-P being positive.
Realized/Historical Volatility
Historical Volatility (HV) is the statistical measure of the dispersion of returns for an index over a given period of time.
Historical volatility is a well-known concept in finance, but there is confusion in how exactly it is calculated. Different sources may use slightly different historical volatility formulas.
For calculating Historical Volatility I am using the most common approach: annualized standard deviation of logarithmic returns, based on daily closing prices.
Implied Volatility
Implied Volatility (IV) is the market's forecast of a likely movement in the price of the index and it is expressed annualized, using percentages and standard deviations over a specified time horizon (usually 30 days).
IV is used to price options contracts where high implied volatility results in options with higher premiums and vice versa. Also, options supply and demand and time value are major determining factors for calculating Implied Volatility.
Implied Volatility usually increases in bearish markets and decreases when the market is bullish.
For determining GOLD and SILVER implied volatility I used their volatility indices: GVZ and VXSLV (30-day IV) provided by CBOE.
Warning
Please be aware that because CBOE doesn’t provide real-time data in Tradingview, my V-R-P calculation is also delayed, so you shouldn’t use it in the first 15 minutes after the opening.
This indicator is calibrated for a daily time frame.
----------------------------------------------------------------------
ESPAŇOL
Este indicador (V-R-P) calcula la Prima de Riesgo de Volatilidad (de un mes) para GOLD y SILVER.
V-R-P es la prima que pagan los hedgers sobre la Volatilidad Realizada para las opciones de GOLD y SILVER.
La prima proviene de los hedgers que pagan para asegurar sus carteras y se manifiesta en el diferencial entre el precio al que se venden las opciones (Volatilidad Implícita) y la volatilidad que finalmente se realiza en el ORO y la PLATA (Volatilidad Realizada).
Estoy utilizando la Volatilidad Implícita (IV) de 30 días y la Volatilidad Realizada (HV) de 21 días como base para mi cálculo, ya que un mes de IV se basa en 30 días calendario y un mes de HV se basa en 21 días de negociación.
Al principio, el indicador aparece en blanco y una etiqueta le indica que elija qué índice desea que el V-R-P represente en el gráfico. Use la configuración del indicador (la rueda dentada) para elegir uno de los metales preciosos (o ambos).
Junto con la línea V-R-P, el indicador mostrará su promedio móvil de un año dentro de un rango de +/- 15% (que puede cambiar) con fines de evaluación comparativa. Deberíamos considerar este rango como el V-R-P "normalizado" para el período real.
La línea Cero también está marcada en el indicador.
Interpretación
Cuando el V-R-P está dentro del rango "normalizado",... bueno... la volatilidad y la incertidumbre, como las ve el mercado de opciones, es "normal". Tenemos una “prima” de volatilidad que debería considerarse normal.
Cuando V-R-P está por encima del rango "normalizado", la prima de volatilidad es alta. Esto significa que los inversores están dispuestos a pagar más por las opciones porque ven una creciente incertidumbre en los mercados.
Cuando el V-R-P está por debajo del rango "normalizado" pero es positivo (por encima de la línea Cero), la prima que los inversores están dispuestos a pagar por el riesgo es baja, lo que significa que ven una disminución, pero no pronunciada, de la incertidumbre y los riesgos en el mercado.
Cuando V-R-P es negativo (por debajo de la línea Cero), tenemos COMPLACENCIA. Esto significa que los inversores ven el riesgo próximo como menor que lo que sucedió en el mercado en el pasado reciente (en los últimos 30 días).
CONCEPTOS :
Prima de Riesgo de Volatilidad
La Prima de Riesgo de Volatilidad (V-R-P) es la noción de que la Volatilidad Implícita (IV) tiende a ser más alta que la Volatilidad Realizada (HV) ya que los participantes del mercado tienden a sobrestimar la probabilidad de una caída significativa del mercado.
Esta sobreestimación puede explicar un aumento en la demanda de opciones como protección contra una cartera de acciones. Básicamente, esta mayor percepción de riesgo puede conducir a una mayor disposición a pagar por estas opciones para cubrir una cartera.
En otras palabras, los inversores están dispuestos a pagar una prima por las opciones para tener protección contra caídas significativas del mercado, incluso si estadísticamente la probabilidad de estas caídas es menor o insignificante.
Por lo tanto, la tendencia de la Volatilidad Implícita es de ser mayor que la Volatilidad Realizada, por lo cual el V-R-P es positivo.
Volatilidad Realizada/Histórica
La Volatilidad Histórica (HV) es la medida estadística de la dispersión de los rendimientos de un índice durante un período de tiempo determinado.
La Volatilidad Histórica es un concepto bien conocido en finanzas, pero existe confusión sobre cómo se calcula exactamente. Varias fuentes pueden usar fórmulas de Volatilidad Histórica ligeramente diferentes.
Para calcular la Volatilidad Histórica, utilicé el enfoque más común: desviación estándar anualizada de rendimientos logarítmicos, basada en los precios de cierre diarios.
Volatilidad Implícita
La Volatilidad Implícita (IV) es la previsión del mercado de un posible movimiento en el precio del índice y se expresa anualizada, utilizando porcentajes y desviaciones estándar en un horizonte de tiempo específico (generalmente 30 días).
IV se utiliza para cotizar contratos de opciones donde la alta Volatilidad Implícita da como resultado opciones con primas más altas y viceversa. Además, la oferta y la demanda de opciones y el valor temporal son factores determinantes importantes para calcular la Volatilidad Implícita.
La Volatilidad Implícita generalmente aumenta en los mercados bajistas y disminuye cuando el mercado es alcista.
Para determinar la Volatilidad Implícita de GOLD y SILVER utilicé sus índices de volatilidad: GVZ y VXSLV (30 días IV) proporcionados por CBOE.
Precaución
Tenga en cuenta que debido a que CBOE no proporciona datos en tiempo real en Tradingview, mi cálculo de V-R-P también se retrasa, y por este motivo no se recomienda usar en los primeros 15 minutos desde la apertura.
Este indicador está calibrado para un marco de tiempo diario.

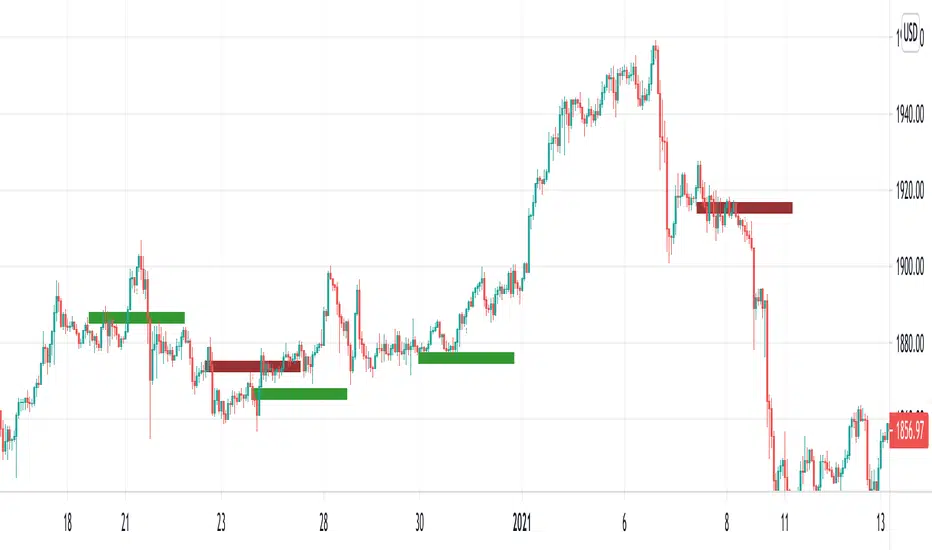
T3 Gold Sniper [RickAtw]Gold Sniper based on support and resistance looks for a sniper entry for trades. Used together with EMA
Key signal
Buy ------> Green Line
Sell ------> Red Line
Functional
The system was made for gold and everything is tuned for it.
I am a professional investor and I test each system for how long. If the system makes an income, it gets to my page. Use it for gold, cryptocurrencies and pairs AUD/USD GBP/USD

Gold trading strategy with trend follow and TDOW conceptMy strategy uses a combination of three indicators MACD Stochastic RSI.
The Idea is to buy when ( MACD > Signal and RSI > 50 and Stochastic > 50) occures at the same time
This strategy works well on stocks and cryptos especially during market breaking up after consolidation
The best results are on Daily charts , so its NOT a scalping strategy. But it can work also on 1H charts.
The strategy does not have any stops and profit targets, so we can take all the market can give us at the moment.
The exit point only when MACD goes under Signal
In addition I've decided to add a stop loss and "Trading day of week" concept
So the results are much more stable and we get more profit !
So, use it, trade it.
If it will help you to imprive your trading results, please donate me
BTC: 12kd1F8buWisUBdq27BBwRkUvzW7Ey3og5

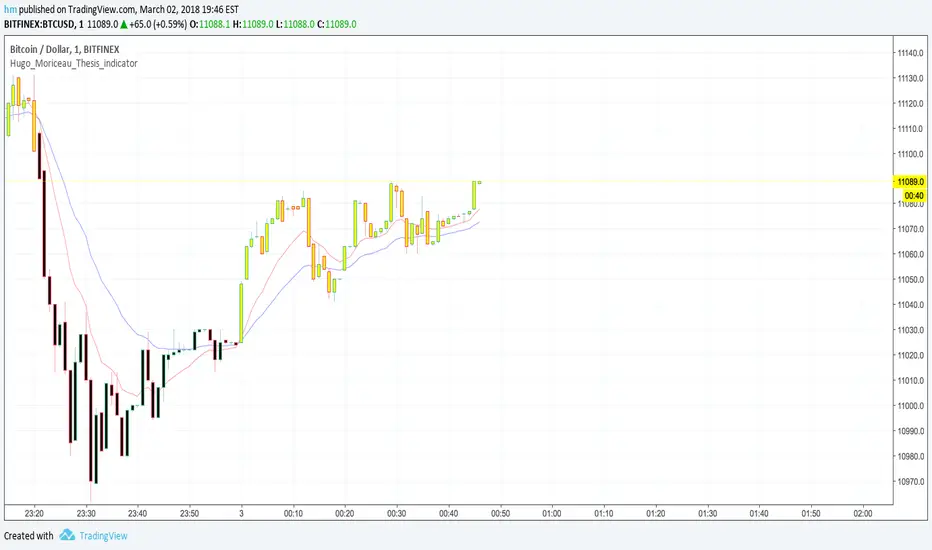
Macd_Reader_Signal_Moriceau_Thesis_indicatorThe idea is to create a MACD "Reader" that can tell you when you should buy (yellow candle sticks) and when to Sell (black one) you have also strong signal of with B and S write on graphic automatically. This indicator is set and back tested with BTCUSD and Gold. I used also for french equities and it works really good.
Let me know if you want any change or have comments.
Hugo Moriceau