KAMA Momentum Extension WarningKAMA Momentum Extension Warning (Parabolic Exit)
Description This indicator is designed for Momentum & Trend Following strategies. Its primary goal is to identify "Parabolic Blow-Off" tops—moments where price moves vertically away from the trend, creating an unsustainable "rubber band" effect.
While standard trend-following tools (like moving averages) tell you when to enter or hold, this tool tells you exactly when to take profit into strength before a likely crash.
Visual Signals
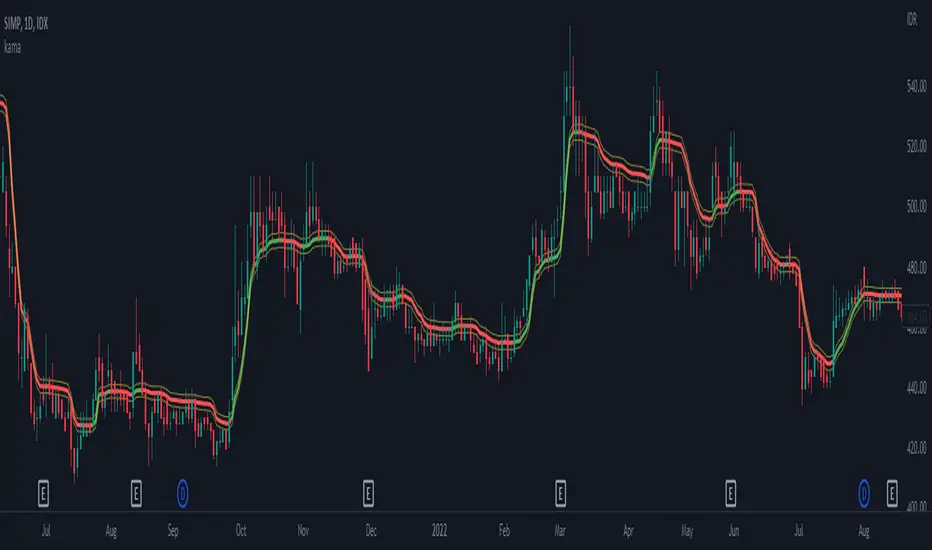
Blue Line (KAMA 21): The "Floor." This represents the sustainable trend. In a healthy move, price should hug this line.
Orange Line (Extension Limit): The "Ceiling." This is calculated as KAMA + (ATR * Multiplier). It represents the mathematical limit of a normal move.
Yellow Candles: The "Climax Signal."
This triggers when the High of the day pierces the Orange Extension Limit.
It indicates the price is statistically over-extended (vertical).
How to Trade It
Trend Following: As long as candles are "Normal" colored and above the Blue Line, hold the position.
The Warning: If a candle paints Yellow, the stock has gone parabolic.
The Execution:
Sell 50% of the position immediately (do not wait for the close).
Tighten the stop loss on the remaining shares to the Low of the Previous Day.
Settings / Inputs
KAMA Length (Default: 21): Controls the baseline trend. Increase for longer-term trends, decrease for faster entries.
ATR Length (Default: 21): The volatility lookback period (usually matches the KAMA length).
Extension Multiplier (Default: 3.5): The "Sensitivity."
3.5 - 4.0: Best for volatile "Super Stocks" (Crypto, Biotech, Tech).
2.5 - 3.0: Best for slower, large-cap stocks.
Tip: Adjust in 0.1 increments to fit the specific stock's personality.
Индикатор Pine Script®