Kijun-Sen with Buy / Sell Labels & Alerts - Ichimoku simplifiedI built this indicator for my own scalping style. Maybe it fits yours, too? Happy scalping! Индикатор Pine Script®от TaureaYinYang22
NICHI (NuwenPham's Ichimoku)NICHI (NuwenPham’s Ichimoku) NICHI is a dual-engine Ichimoku indicator designed for modern, high-volatility markets. It preserves a faithful traditional Ichimoku while introducing an advanced, filter-driven Ichimoku framework for research, visualization, and discretionary trading. The goal of NICHI is not to replace Ichimoku — but to extend it. Overview NICHI includes two independent Ichimoku systems that can be enabled separately or together. 1. Standard Ichimoku A clean, traditional Hosoda Ichimoku using Donchian midpoints: Tenkan-sen (short period) Kijun-sen (medium period) Senkou Span A & B (forward displaced) Chikou Span (lagging) Design choice: The Standard Ichimoku is intentionally plotted in a separate pane to avoid cluttering the price chart. It serves as a reference / regime baseline, not a visual overlay. 2. Advanced Ichimoku The Advanced system keeps the Ichimoku structure intact but replaces the Donchian calculations with selectable smoothing filters. Each Ichimoku component (Tenkan, Kijun, Senkou B, Chikou) can be calculated using modern filters designed to handle volatility, noise, and regime shifts. Supported filters include: McGinley Dynamic (MD) VWMA (exchange or tick-derived volume) EMA / DEMA / SMA / SMMA / WMA ALMA / LSMA / Hull MA COVWMA / FRAMA / KAMA 50th Percentile Moving Median This allows Ichimoku to behave as: A smoother trend system A volatility-adaptive framework A momentum-responsive overlay Enhanced Cloud (Kumo) Modeling Advanced Kumo logic includes: Independent forward offsets for Span A and Span B Bull / bear regime classification aligned with how the cloud is actually drawn Adaptive cloud coloring Neutral cloud state when spans disagree This avoids misleading regime signals when different offsets are used. Directional Persistence Tracking NICHI tracks directional streaks for key components: Tenkan direction Kijun direction Span A direction Span B direction These persistence counters stabilize coloring, reduce flicker, and improve visual clarity during transitions. Bar Coloring Modes (Advanced) Three bar-coloring frameworks are included. Kumo-Based Above cloud → bullish Below cloud → bearish Inside cloud → neutral Tenkan / Kijun-Based Above both → bullish Below both → bearish Chikou-Based Chikou above past price → bullish Chikou below past price → bearish Each mode is intentionally distinct and serves a different trading style. Moving Average Overlays NICHI includes four optional moving average overlays (MA1–MA4): Configurable type, length, width, and source Intended for bias, confluence, or higher-timeframe context Controlled as code-level constants by design What Changed Since BETA This release promotes NICHI from beta to stable with the following key improvements: Chikou regime logic fixed: Chikou comparisons now reference historical price only, eliminating any future lookahead behavior. Kumo bull/bear alignment clarified: Cloud regime classification now matches how the cloud is visually drawn when Span A and Span B use different forward offsets. Kijun direction tracking corrected: Kijun coloring now reflects Kijun movement, not Tenkan movement. Bar coloring gated: Bar coloring is applied only when Advanced Ichimoku is enabled, preventing unintended behavior when using Standard mode alone. General stability and cleanup: Minor bug fixes, consistency improvements, and documentation clarity. Notes Advanced Ichimoku is intended for research and visualization, not as a turnkey strategy. Standard Ichimoku remains a faithful baseline. If reporting issues, please include symbol, timeframe, and a screenshot.Индикатор Pine Script®от NuwenPham67
Kalman Hull Kijun [BackQuant]Kalman Hull Kijun A trend baseline that merges three ideas into one clean overlay, Kalman filtering for noise control, Hull-style responsiveness, and a Kijun-like Donchian midline for structure and bias. Context and lineage This indicator sits in the same family as two related scripts: Kalman Price Filter This is the foundational building block. It introduces the Kalman filter concept, a state-estimation algorithm designed to infer an underlying “true” signal from noisy measurements, originally used in aerospace guidance and later adopted across robotics, economics, and markets. Kalman Hull Supertrend This is the original script made, which people loved. So it inspired me to create this one. Kalman Hull Kijun uses the same core philosophy as the Supertrend variant, but instead of building a Supertrend band system, it produces a single structural baseline that behaves like a Kijun-style reference line. What this indicator is trying to solve Most trend baselines sit on a bad trade-off curve: If you smooth hard, the line reacts late and misses turns. If you react fast, the line whipsaws and tracks noise. Kalman Hull Kijun is designed to land closer to the middle: Cleaner than typical fast moving averages in chop. More responsive than slow averages in directional phases. More “structure aware” than pure averages because the baseline is range-derived (Kijun-like) after filtering. Core idea in plain language The plotted line is a Kijun-like baseline, but it is not built from raw candles directly. High level flow: Start with a chosen price stream (source input). Reduce measurement noise using Kalman-style state estimation. Add Hull-style responsiveness so the filtered stream stays usable for trend work. Build a Kijun-like baseline by taking a Donchian midpoint of that filtered stream over the base period. So the output is a single baseline that is intended to be: Less jittery than a simple fast MA. Less laggy than a slow MA. More “range anchored” than standard smoothing lines. How to read it 1) Trend and bias (the primary use) Price above the baseline, bullish bias. Price below the baseline, bearish bias. Clean flips across the baseline are regime changes, especially when followed by a hold or retest. 2) Retests and dynamic structure Treat the baseline like dynamic S/R rather than a signal generator: In uptrends, pullbacks that respect the baseline can act as continuation context. In downtrends, reclaim failures around the baseline can act as continuation context. Repeated back-and-forth around the line usually means compression or chop, not clean trend. 3) Extension vs compression (using the fill) The fill is meant to communicate “distance” and “pressure” visually: Large separation between price and baseline suggests expansion. Price compressing into the baseline suggests rebalancing and decision points. Inputs and what they change Kijun Base Period Controls the structural memory of the baseline. Higher values track broader swings and reduce flips. Lower values track tighter swings and react faster. Kalman Price Source Defines what data the filter is estimating. Close is usually the cleanest default. HL2 often “feels” smoother as an average price. High/Low sources can become more reactive and less stable depending on the market. Measurement Noise Think of this as the main smoothness knob: Higher values generally produce a calmer filtered stream. Lower values generally produce a faster, more reactive stream. Process Noise Think of this as adaptability: Higher values adapt faster to changing conditions but can get twitchy. Lower values adapt slower but stay stable. Plotting and UI (what you see on chart) 1) Adaptive line coloring Baseline turns bullish color when price is above it. Baseline turns bearish color when price is below it. This makes the state readable without extra panels. 2) Gradient “energy” fill Bull fill appears between price and baseline when above. Bear fill appears between price and baseline when below. The goal is clarity on separation and control, not decoration. 3) Rim effect A subtle band around price that only appears on the active side. Helps highlight directional control without hiding candles. 4) Candle painting (optional) Candles can be colored to match the current bias. Useful for scanning many charts quickly. Disable if you prefer raw candles. Alerts Long state alert when price is above the baseline. Short state alert when price is below the baseline. Best used as a bias or regime notification, not a standalone entry trigger. Where it fits in a workflow This is a context layer, it pairs well with: Market structure tools, BOS/MSB, OBs, FVGs. Momentum triggers that need a regime filter. Mean reversion tools that need “do not fade trends” context. Limitations No baseline eliminates chop whipsaws, tuning only manages the trade-off. Settings should not be copy pasted across assets without checking behavior. This does not forecast, it estimates and smooths state, then expresses it as a structural baseline. Disclaimer Educational and informational only, not financial advice. Not a complete trading system. If you use it in any trading workflow, do proper backtesting, forward testing, and risk management before any live execution. Индикатор Pine Script®от BackQuant270
Kijun Sen Standard Deviation | QuantLapse SystemsOverview The Kijun Sen Standard Deviation indicator by QuantLapse Systems is a volatility-aware trend-following framework that combines the structural equilibrium of the Kijun Sen (基準線) with statistically adaptive standard deviation bands. By anchoring trend detection to market structure and confirming direction through volatility expansion, the indicator delivers a cleaner, more reliable regime classification across varying market conditions. Rather than reacting to short-term noise, the system focuses on identifying statistically justified trend phases , making it well-suited for disciplined, rule-based trading. Technical Composition, Calculation, Key Components & Features 📌 Kijun Sen (基準線) – Structural Trend Baseline Calculated as the midpoint between the highest high and lowest low over a user-defined period. Represents market equilibrium and structural balance rather than short-term momentum. Naturally adapts to expanding and contracting price ranges. Provides a stable baseline for regime detection and volatility validation. Acts as the anchor for deviation bands and persistent trend-state logic. Unlike fast or reactive moving averages, the Kijun Sen emphasizes price structure and equilibrium , making it especially effective for higher-quality trend confirmation. 📌 Volatility Adjustment – Standard Deviation Bands Standard deviation is calculated over a configurable lookback to measure current price dispersion. Upper and lower envelopes are formed by applying a deviation multiplier to the Kijun Sen. Band width expands during volatility surges and contracts during consolidation. Creates proportional, volatility-aware thresholds instead of static offsets. Visually represents market energy through expanding and compressing channels. These adaptive bands ensure that trend signals only occur when volatility supports directional movement. 📌 Trend Signal & Regime Calculation Bullish Trend is confirmed when price closes above the upper deviation band. Bearish Trend is confirmed when price closes below the lower deviation band. Once established, the trend state persists until an opposing volatility break occurs. This persistence reduces whipsaws and improves regime stability. Trend state is reinforced with color-coded lines, envelopes, and background shading. This volatility-confirmed persistence model is visible in the chart, where trends remain intact through minor pullbacks and only flip on decisive expansion. How It Works in Trading ✅ Volatility-Confirmed Trend Detection – Requires expansion beyond deviation bands. ✅ Noise Suppression – Filters low-energy price movement within volatility envelopes. ✅ Regime Persistence – Maintains trend state until statistical invalidation. ✅ Immediate Visual Context – Direction, strength, and transitions are clear at a glance. Visual Representation Trend signals are displayed directly on price using both line and background context: 🟢 Green / Teal Kijun & Envelope → Confirmed bullish regime. 🔴 Red / Pink Kijun & Envelope → Confirmed bearish regime. Semi-transparent band fill visualizes volatility expansion and compression. Buy and Sell labels appear only on confirmed regime transitions. The lower panel includes: Strategy equity curve based on trend exposure. Buy & Hold equity for performance comparison. Background regime shading synchronized with trend state. Features and User Inputs The Kijun Sen Standard Deviation framework offers a focused yet powerful set of configurable inputs: Kijun Sen Length – Controls structural trend sensitivity. Standard Deviation Controls – Adjust lookback length and multiplier for regime strictness. Backtesting & Date Filters – Define evaluation periods and starting conditions. Display Options – Toggle labels, equity curves, and background shading. Color Customization – Fully configurable buy/sell colors for trends and equity curves. These controls allow users to balance responsiveness, stability, and clarity without overfitting. Practical Applications The Kijun Sen Standard Deviation indicator is designed for traders who prioritize structure, volatility confirmation, and regime awareness. Primary Trend Filtering – Identify and stay aligned with dominant market direction. Volatility-Aware Trend Following – Participate only when price expansion confirms intent. Risk-Managed Exposure – Avoid chop during compression and transitional phases. Systematic Strategy Development – Use as a regime engine or higher-timeframe filter. Performance Evaluation – Compare trend-following equity against buy-and-hold benchmarks. This framework bridges classical Ichimoku structure with modern statistical validation. Conclusion The Kijun Sen Standard Deviation indicator by QuantLapse Systems represents a refined evolution of Ichimoku-based trend analysis. By integrating the structural equilibrium of the Kijun Sen with adaptive standard deviation confirmation, the system delivers clearer regime classification, reduced noise, and more reliable trend participation. Rather than attempting to predict price, it focuses on confirming when trends are statistically justified . Who should use Kijun Sen Standard Deviation: 📊 Trend-Following Traders – Stay aligned with dominant market structure. ⚡ Momentum & Swing Traders – Enter only on volatility-backed expansions. 🤖 Systematic & Algorithmic Traders – Ideal as a regime filter or trend-state engine. Past performance is not indicative of future results. Disclaimer: All trading involves risk, and no indicator can guarantee profitability. Strategic Advice: Always backtest thoroughly, optimize parameters responsibly, and align settings with your timeframe, asset class, and risk tolerance before live deployment.Индикатор Pine Script®от QuantLapse192
Kijun_ATROVERVIEW Kijun + ATR is an indicator that combines Lagging Kijun Base Line From Ichimoku Cloud (direction indicator) and Volatility Indicator ATR. By combining ATR with kijun we can filter out noise from Base Line. CALCULATIONS Kijun is calculated by taking average of lowest and highest point of price over set lenght. ATR is just default Tradingview Indicator that calculates average true range of price over set period of time. WORKING When both close > lower and not close < upper are true indicator indicate long by color limeand indicates short when close < upper by color fuchsia (Color can be changed in settings) Indicator works best in Trending Market Regimes can have problems by signaling tops in Consolidating Market Regimes during bear markets and by sygnaling bottom in short consolidating market regimes during bull market.Индикатор Pine Script®от Patito_1141
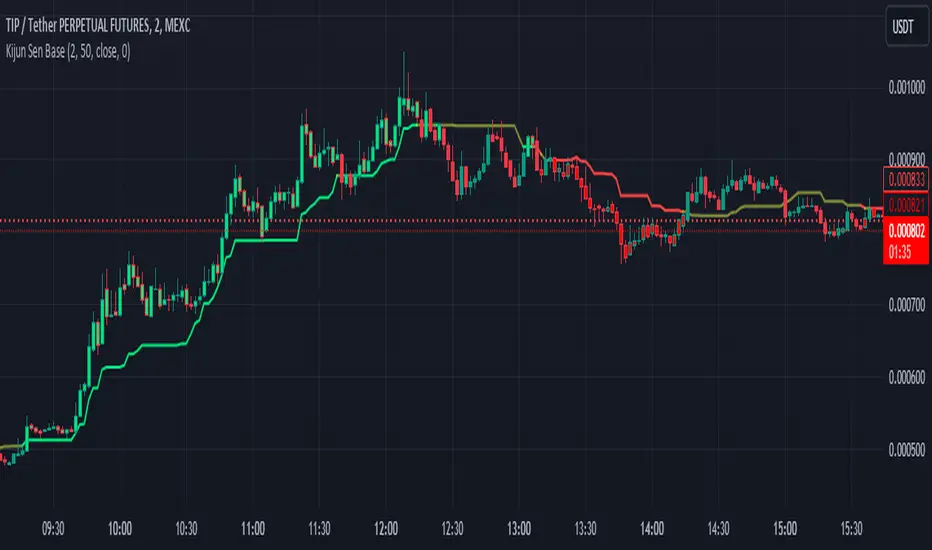
Kijun Sen BaseWhat is Kijun Sen? Kijun-sen also means "base line" and is the mid-point of the 26-period high and low. Kijun-sen is typically used in conjunction with Tenkan-sen (conversion line) or (the 9-period midpoint price) to generate trade signals when they cross. Kijun-sen is typically used in conjunction with the other Ichimoku indicators. What is the Kijun Sen Base? The Kijun Sen Base is the center line in the Ichimoku Cloud Indicator. We have taken that line out and made it an indicator on its own , color-coded it, and allowed traders to track the price for a clean and simple base filter. Is this a Moving Average? NO The Difference Between Kijun-sen (Base Line) and a Simple Moving Average (SMA) The Kijun-sen is a midpoint of the high and low prices over the last 26 periods. This is not an average. How do I trade with this Indicator? Unless there's a lot of recent price movement, enough to pull the price away from the 26-period midpoint, the Kijun-sen will often trade near and intersect with the current price. At times like these, it is not an ideal tool for helping with trend direction. If, however, there is a strong price move away from Kijun Sen and the gap between Kijun Sen and the price is "increasing" or "widening", this is an indication that a trend is forming. Kijun Sen Base can be used to confirm a trend and is a clean addition to other indicators the trader may use on their charts while at the same time keeping the chart less cluttered. Happy Trading and Good Luck! Индикатор Pine Script®от nnamdertОбновлено 500
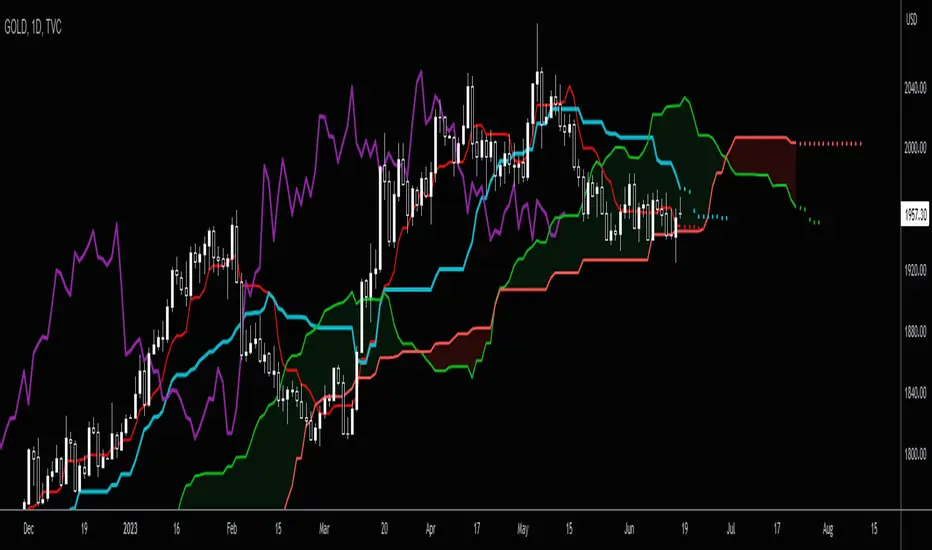
Simple Ichimoku Kinko Hyo Cloud█ OVERVIEW This indicator as an educational and showcase the usage of user-defined types or objects (UDT) for Ichimoku Kinko Hyo or Ichimoku Cloud. █ CREDITS TradingViewИндикатор Pine Script®от RozaniGhani-RG58
Ichimoku Buy/Sell Signals of manual MTF Tenkan crossing KijunIchimoku Buy/Sell Signals based on fast, small time frame Tenkans crossing longer timeframes Kijuns - Manual MTF Analysis This code marks the potential change of direction based on the input of one timeframe's Ichimoku Tenkan (conversion) line crossing over a higher, longer timeframe's Ichimoku Kijun (base) line. Feel free to change the inputs if need be and to hide the yellow box. Use Ichimoku rules of Tenkan, Kijun, Lagging Span, and Cloud for Take profit/Stop Losses. It is best to wait 3-5 minutes after the signal to enter to confirm the trend and to confirm if the Lagging Span has broken key levels. I refer to the book Trading with Ichimoku - A Practical Guide to Low-Risk Ichimoku Strategies by Karen Peloille as the Ichimoku rulebook. Good luck. For day trading/scalping/intraday - 1min/3min/5min Tenkan Line Timeframe = 1min Kijun Line Timeframe = 5min For swing trading - multiple days/weeks - 4HR/Daily/Weekly Charts Tenkan Line Timeframe = day Kijun Line Timeframe = weekИндикатор Pine Script®от kjb_1234Обновлено 22837
SuperIchi [LuxAlgo]Using one indicator as the core for another one to improve certain aspects while offering an alternative user interaction can be very interesting in technical analysis. This indicator is a modification of the popular Ichimoku indicator using the equally popular Supertrend indicator as its core, thus no longer entirely relying on calculations done over a fixed window size but instead relying on the average true range and the trend detection method offered by the Supertrend. Settings Tenkan: Atr length (left) and factor (right) used for the Supertrend involved in the calculations of the Tenkan Ichimoku component Kijun: Atr length (left) and factor (right) used for the Supertrend involved in the calculations of the Kijun Ichimoku component Senkou Span B: Atr length (left) and factor (right) used for the Supertrend involved in the calculations of the second Senkou Span Ichimoku component Displacement: Bar offset of the cloud (positive offset) and Chikou (negative offset) Usage The SuperIchi indicator can be interpreted similarly to a regular Ichimoku as it retains the components and aspects from this one. Users can make use of the Supertrend Factor to detect shorter or longer-term trends. Unlike the regular components of the Ichimoku based on rolling maximums/minimums, using the Supertrend here allows smoother components and makes it less prone to whipsaw signals. Note that the Chikou is disabled by default in the style settings Details The original Ichimoku indicator is constructed from the average between the rolling maximum high and minimum low values. The Supertrend indicator also relies on one upper/lower extremity but using the average of these extremities for the modification of the Ichimoku indicator might not provide easy to use results due to the nature of these extremities. Instead, we compute the average between the Supertrend and trailing maximums/minimums with a value reset when a new trend is detected by the Supertrend. This allows obtaining a result that is closer to the original average used by Ichimoku.Индикатор Pine Script®от LuxAlgo4545 3.8 K
T/K CROSSSimple crossing of the Tenkan & Kijun Sen indicated by a "Cross". Surfed Tradingview for it, but did not find it, so decided to make one. Does NOT include the Ichimoku Cloud & the Chikou Индикатор Pine Script®от theforlornson46
Kijun Trend IndicatorName: Kijun Trend Indicator Category: Trend Analysis Timeframe: All timeframes Suggested usage: In a trending market, to understand when it is good to enter short (red line) and when to enter long (blue line). Technical Analysis: The original idea was taken from Larry Williams: an uptrend is identified when the price is above an 18-period simple moving average (SMA) and when at least two candles do not touch the simple moving average with their lows. The opposite is true for a downtrend. Corrado Rondelli has therefore reinterpreted with Ichimoku aka "ichimokized" replacing the 18-period Simple Moving Average with the 26-period Kijun - as per the original Ichimoku settings. In order to make the indicator more flexible an Exponential Moving Average (EMA) has also been added. The indicator plots the chosen line that becomes red when it is good to enter short and blue when it is good to enter long. Configuration: - Length: period to be used to calculate the line. - Type: the line type that can be the Kijun (26-period) or SMA/EMA (18-period)Индикатор Pine Script®от TheSocialCryptoClubОбновлено 55308
Ichimoku+Based on the ichimoku cloud system, this indicator gives two presets: Standard (9/26/52/26) and Crypto (20/60/120/30). This also shows on a chart where Tenkan-Kijun cross happens and when a Kumo Twist happens.Индикатор Pine Script®от jumpr11267
TK Cross and Kumo Twist AlertBased on the ichimoku cloud system, this shows on a chart where Tenkan-Kijun cross happens and when a Kumo Twist happens.Индикатор Pine Script®от jumprОбновлено 55191
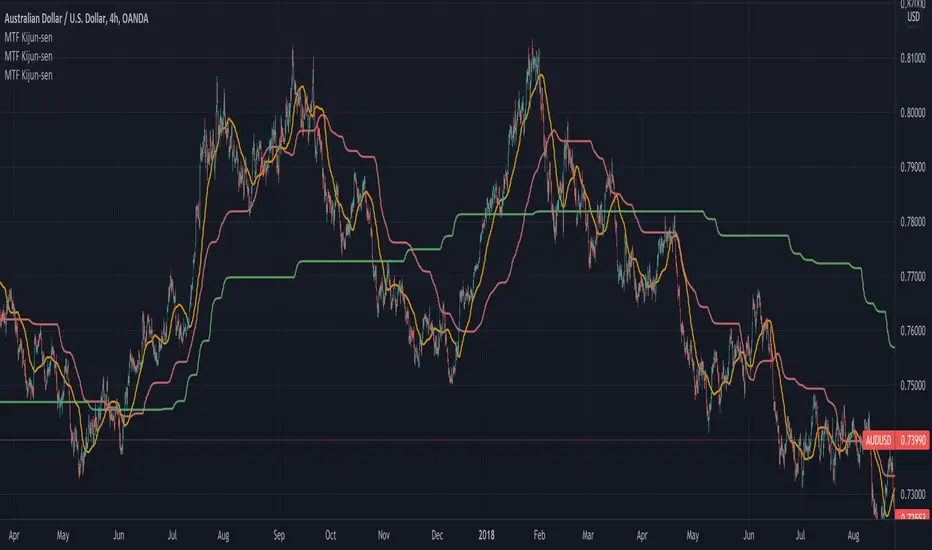
Multi Timeframe Kijun-sen [Takazudo]Multi Timeframe Kijun-sen implementation. Kijun-sen is a part of Ichimoku Kinko-hyo. This study is intented to be used as a part of buy/sell strategies. This may be useful for lower timeframe entries. This Kijun-sen script can be smooth using MA.Индикатор Pine Script®от TakazudoОбновлено 77154
Future Ichimoku LinesFuture Ichimoku Lines Plot: Tenkan-sen next 5 days, Kijun-sen next 10 days, Kumo A next 5 days and Kumo B next 14 days will be display This will help you forecast the future of price and increase winning probability! Always remember, risk management is the key of a successful trader Have a nice trade! :DИндикатор Pine Script®от NgheTraderОбновлено 1313295
Ichimoku Line CounterThis simple script will help you seen the range of Kijun-sen, Tenkan-sen and Senkou span B. You can use it to analyze the direction of Ichimoku components. Very useful for Ichimoku trader! Example: how many days Kijun, Kumo, ... still flat or become flat? We use the default number: 9, 26 and 52. You absolutely can modify it if your system use different numbers :P Have a nice trade! :DИндикатор Pine Script®от NgheTraderОбновлено 2274
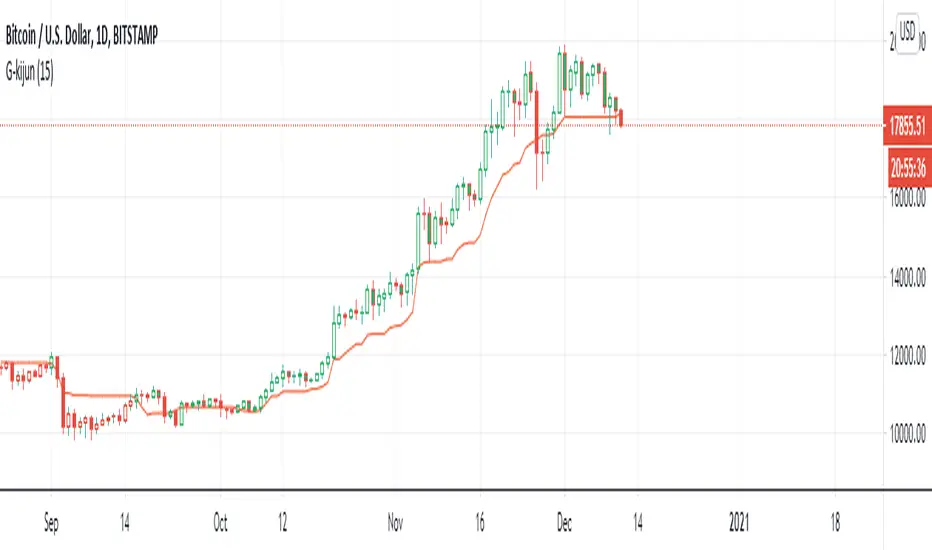
G-Kijun trailing stopThis indicator is the part of ichimoku kyo hyo. I luv kijun-sen very much kijun-sen is develop form (Highest - Lowest)/2 It's mean 50% of fibonacci and I create color Green for price over the kijun-sen when the price cross down the kijun-sen it'sll be RedИндикатор Pine Script®от PhysioGuy33118
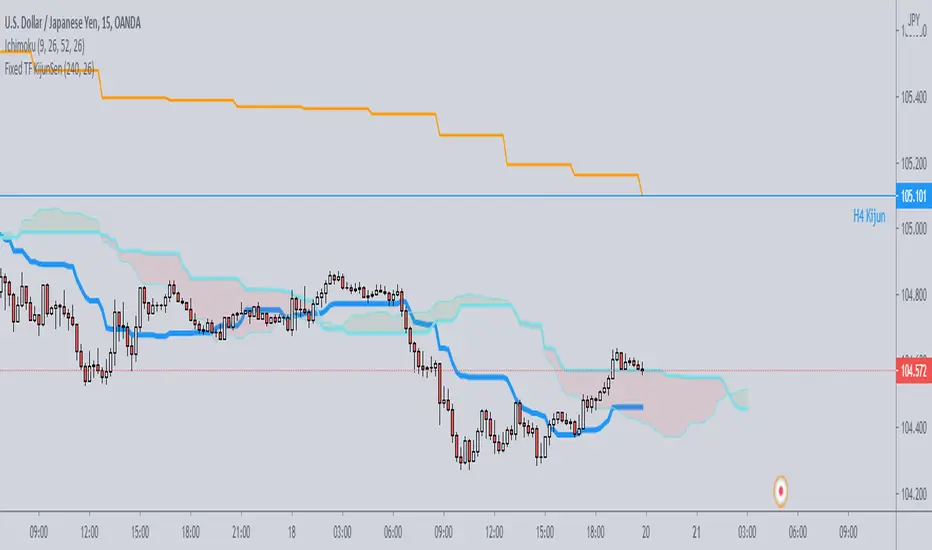
Fixed TF KijunSenJust a simple script which plots on any timeframe the kijunsen of a single specific timeframe, selectable by the user. Useful for strategies which need to work on various timeframes, but need the kijun of that specific timeframe to be always visible for the analysis.Индикатор Pine Script®от JackLenzОбновлено 1158
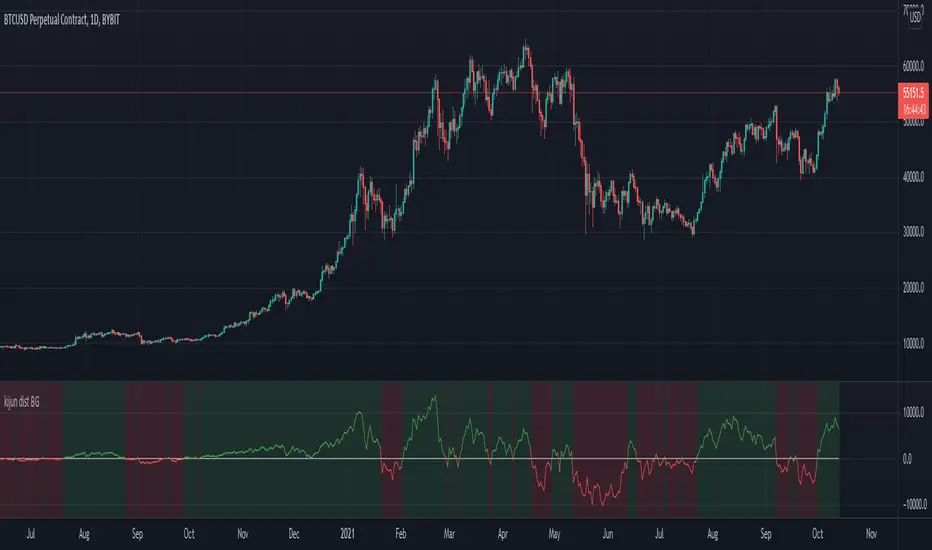
Kijun-Price DistanceThis script shows optional: - distance between close price and Kijun-Sen - distance btween Tenkan-Sen and Kijun-Sen - Background color of current time frame - Background color of the next higher time frame Индикатор Pine Script®от ramsay09Обновлено 1111250
RSI with BGThis is a standard RSI indicator with Background colour and the option to draw the Background colour of the next higher timeframe. Unfortunately, the 3D timeframe is not working properly (weekly background is not displayed). This is the same problem as with the MACD BG study.Индикатор Pine Script®от ramsay09Обновлено 66148
Ichimoku Kumo Switch Indicator [Mehdihz]This simple indicator just shows Ichimoku's Kumo cloud status. Blue for increasing Kumo Red for decreasing KumoИндикатор Pine Script®от UnknownUnicorn300158833237
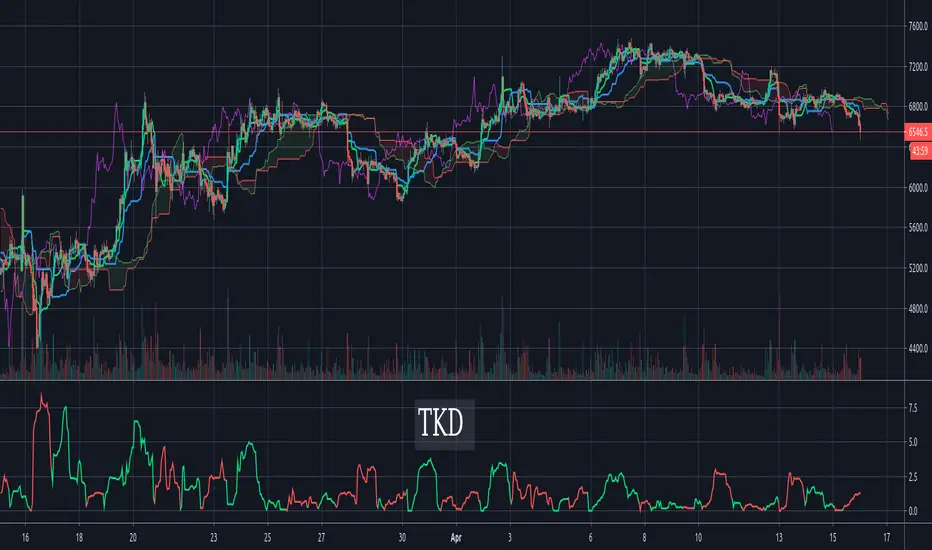
Tenkan-Sen Kijun-Sen Distance (TKD) Oscillator - IchimokuThe TKD is the distance between the Tenkan-Sen and the Kijun-Sen, expressed in percentage of current price. The further apart the tenken-sen and kijun-sen are, the more they want to snap back together. This makes for a decent oscillator. When the Tenkan-Sen is above the Kijun-Sen, the TKD is green. When it is below, the TKD is red. At the crossing points, it turns blue. For those more familiar with Ichimoku Cloud techniques, one might also think of this indicator as a C-Clamp indicator. Bar coloring is supported and enabled by default. There's also an option to flip/invert the green/red colors in case you want to use it to judge pending cycles rather than current ones.Индикатор Pine Script®от AlgoGirlОбновлено 55426
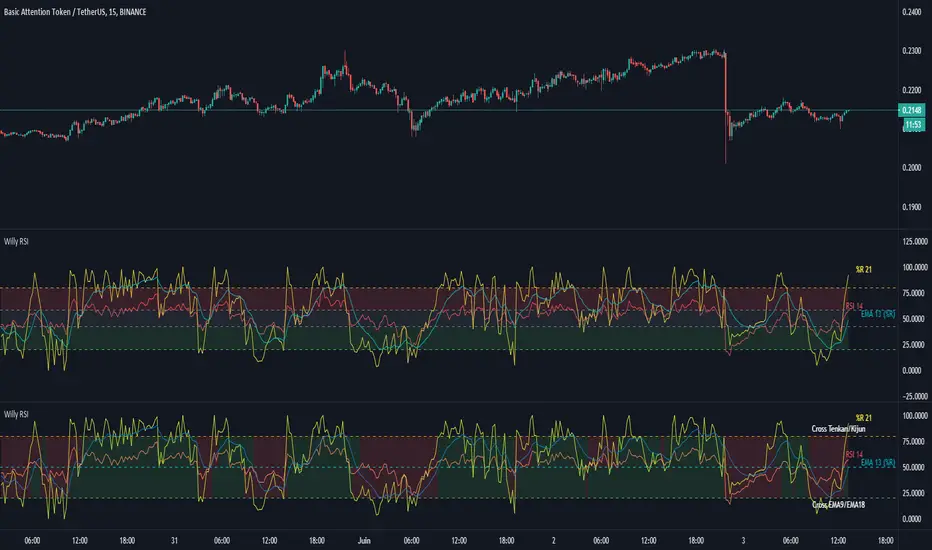
Williams %R + RSI + EMA - [Silver-Wong] Williams %R + EMA + RSI Un seul indicateur avec : - William %R - RSI - EMA - Une ligne médiane - Les étiquettes des indicateurs Индикатор Pine Script®от Silver-WongОбновлено 1212581