Volume scaled Price + auto colour change light/dark mode🔶 OVERVIEW
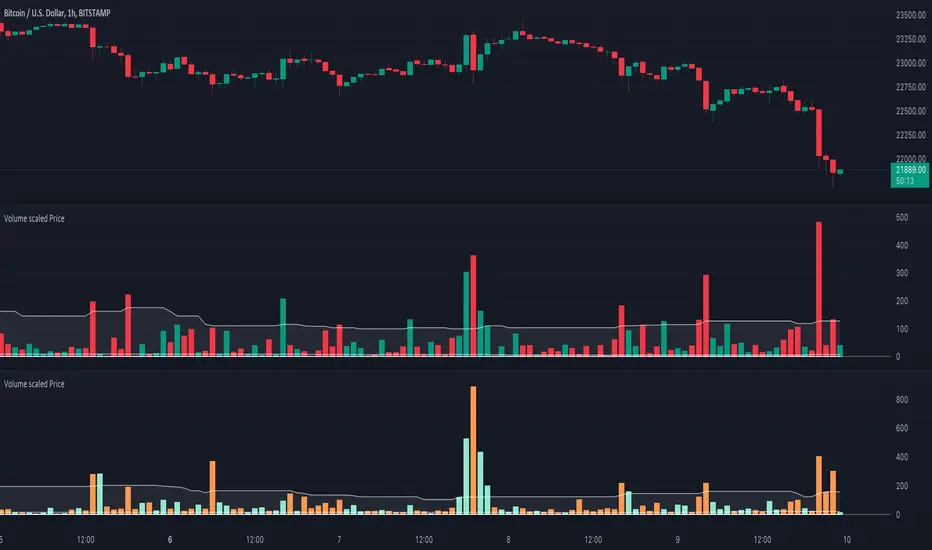
🔹 This script shows price in a similar style as volume . To accomplish this we use the body of the candle ( close - open ), which is placed on a zero line.
This can be useful when comparing volume ~ price .
🔹 3 options are included to show additional lines, to make comparisons easier:
· Percentile nearest rank
· Bollinger Bands (BB)
· Simple Moving Average (SMA)
🔶 SETTINGS
🔹 Option : choose whether to show price (candles) or volume . Adding 2 versions of this indicator on the chart enables you to compare these 2 options:
🔹 Lines:
· (Percentile nearest rank (only the setting mult is used for this option).
· Bollinger Bands (BB) (only the setting % perc. nearest rank is used for this option).
· Simple Moving Average (SMA )
All 3 options will use length , this is the amount of bars used for calculations.
🔹 Show wick will show you... wicks :)
🔶 PERCENTILE NEAREST RANK
🔹 This script has 2 extra types of background color
dvP = volume > volume and z < z and z < prP_ and volume > prV
· In this case:
· volume is higher than previous volume ( volume > volume )
· volume is above 90th percentile rank ( volume > prV )
· price is lower than previous price ( z < z )
· price is below 10th percentile rank ( z < prP_ )
dvV = volume < volume and z > z and z > prP and volume < prV_
· The second type background color is reversed ( volume lower, price higher)
🔶 AUTOMATIC COLOUR CHANGE WHEN SWITCHING DARK/LIGHT MODE
🔹 chart.bg_color returns the color of the chart’s background from the "Chart settings/Appearance/Background" field, while chart.fg_color returns a color providing optimal contrast with chart.bg_color .
· Following technique gives you the possibility to pick your own colour for either dark/light time.
· We first retrieve separately the red, green and blue component of the measured chart.bg_color
r = color.r(chart.bg_color)
g = color.g(chart.bg_color)
b = color.b(chart.bg_color)
The following assumption states when all 3 colour components' values are below 80, we are in the dark mode:
isDark = r < 80 and g < 80 and b < 80
Now we can use isDark to automatically show your own dark/light mode colours (chosen at settings), dependable on the mode:
Cheers!
Индикатор Pine Script®