Trend Strength Oscillator📌 Trend Strength Oscillator
📄 Description
Trend Strength Oscillator measures the directional strength of price relative to an adaptive dynamic trend band. It evaluates how far the current price is from the midpoint of a trend channel and normalizes this value by recent volatility range, allowing traders to detect trend strength, direction, and potential exhaustion in any market condition.
📌 Features
🔹 Adaptive Trend Band Logic: Uses a modified ATR and time-dependent spread formula to dynamically adjust upper and lower trend bands.
🔹 Trendline Midpoint Calculation: The central trendline is defined as the average between upper and lower bands.
🔹 Relative Positioning: Measures how far the close is from the center of the band as a percentage.
🔹 Range Normalization: Uses a normalized range to account for recent volatility, reducing noise in the oscillator reading.
🔹 Oscillator Output (±100 scale):
+100 indicates strong bullish momentum
-100 indicates strong bearish momentum
0 is the neutral centerline
🛠️ How to Use
✅ Trend Strength > +50: Indicates a strong bullish phase.
✅ Trend Strength < -50: Indicates a strong bearish phase.
⚠️ Crossing above 0: Potential bullish trend initiation.
⚠️ Crossing below 0: Potential bearish trend initiation.
📉 Values near 0: Suggest trend weakness or ranging conditions.
Best suited timeframes: 1H, 4H, Daily
Ideal combination with: RSI, MACD, volume-based oscillators, moving average crosses
✅ TradingView House Rules Compliance
This indicator is written in Pine Script v5 and fully open-source.
The script does not repaint, does not generate false alerts, and does not access external or private data.
It is intended strictly as a technical analysis tool, and not a buy/sell signal generator.
Users are encouraged to combine this tool with other confirmations and independent judgment in trading decisions.
=========================================================
📌 Trend Strength Oscillator
📄 설명 (Description)
Trend Strength Oscillator는 가격이 동적 추세 밴드 내 어디에 위치해 있는지를 정량적으로 분석하여, 추세의 방향성과 강도를 시각적으로 보여주는 오실레이터 지표입니다. 최근 변동성을 반영한 밴드를 기반으로 가격 위치를 정규화하여, 과매수·과매도 상태나 추세의 소멸 가능성까지 탐지할 수 있도록 설계되었습니다.
📌 주요 특징 (Features)
🔹 적응형 추세 밴드 계산: ATR과 시간 경과를 기반으로 상단/하단 밴드를 동적으로 조정
🔹 중심 추세선 산출: 상단과 하단 밴드의 평균값을 중심선으로 활용하여 기준 축 제공
🔹 상대 위치 계산: 현재 종가가 중심선에서 얼마나 떨어져 있는지를 정규화하여 추세 강도 계산
🔹 변동성 기반 정규화: 최근 밴드 범위를 기준으로 상대 거리를 0~100 사이 값으로 변환
🔹 오실레이터 출력 (범위: ±100):
+100에 가까울수록 강한 상승 추세
-100에 가까울수록 강한 하락 추세
0에 가까울수록 횡보 구간 가능성
🛠️ 사용법 (How to Use)
✅ +50 이상: 강한 상승 추세 지속 중
✅ -50 이하: 강한 하락 추세 지속 중
⚠️ 0선 돌파 상향: 상승 추세 시작 가능성
⚠️ 0선 돌파 하향: 하락 추세 시작 가능성
🟡 0 근처 유지: 추세 약화 또는 횡보장 가능성
추천 시간대: 1시간봉, 4시간봉, 일봉
보조 지표로 추천: RSI, MACD, OBV, 이동평균 크로스 등과 함께 활용 시 효과적
✅ 트레이딩뷰 하우스룰 준수사항 (TradingView House Rules Compliance)
본 지표는 Pine Script v5로 작성된 오픈소스 공개용 스크립트입니다.
리페인트(Repaint) 현상이 없으며, **허위 경고(Spam Alerts)**나 성능 저하 요소도 없습니다.
외부 데이터 접근 없이 완전히 자체 계산으로 동작합니다.
이 지표는 투자 판단을 돕기 위한 분석용 도구이며, 직접적인 매수·매도 신호로 사용해서는 안 됩니다.
모든 트레이딩은 사용자의 독립적인 판단과 책임 하에 이루어져야 합니다.
M-oscillator

Mongoose Capital: BTC ETF DriftScope ProMongoose Capital: BTC ETF DriftScope Pro
A proprietary indicator for monitoring drift between Bitcoin Spot (BTCUSD) and Bitcoin Spot ETFs (such as IBIT). Designed to detect ETF premium/discount zones and generate actionable Fade or Long bias signals.
What it Does
Tracks IBIT and BTCUSD spread to highlight ETF price deviations.
Calculates correlation Z-Score for ETF/Spot alignment.
Outputs numeric bias signals: Fade (1), Long (1), Neutral (1).
How to Use
Apply to a BTCUSD chart (4H, 1D, or higher recommended).
Open the Data Window to view:
IBIT Spread %
Correlation Z-Score
Correlation %
Bias Flags (Fade, Long, Neutral)
Configure alerts for Fade and Long Bias conditions.
Confirm all signals with your trade plan and risk management.
Methodology
This tool calculates the percentage spread between IBIT and BTC Spot. A rolling Z-Score of the correlation is used to detect periods of significant divergence.
Fade Bias suggests potential short setups in premium zones with high Z-Scores.
Long Bias suggests potential long setups in discount zones with low Z-Scores.
Disclaimer
This indicator is for educational purposes only. It is not financial advice. Use at your own risk and verify signals independently.

Zero-Lag RSI DivergenceZero-Lag RSI Divergence
Overview
This indicator identifies RSI divergences in real-time without delay, providing immediate signals as price-momentum discrepancies develop. The indicator analyzes price action against RSI momentum across dual configurable periods, enabling traders to detect potential reversal opportunities with zero lag.
Key Features
Instant Divergence Detection : Identifies bullish and bearish divergences immediately upon formation without waiting for candle confirmation or historical validation. This eliminates signal delay but may increase false signals due to higher sensitivity.
Dual Period Analysis : Configure detection across two independent cycles - Short Period (default 15) and Long Period (default 50) - allowing for multi-timeframe divergence analysis and enhanced signal validation across different market conditions.
Visual Divergence Lines : Automatically draws dashed lines connecting divergence points between price highs/lows and corresponding RSI peaks/troughs, clearly illustrating the momentum-price relationship.
Customizable RSI Parameters : Adjustable RSI length (default 14) allows optimization for different market volatility and trading timeframes.
How It Works
The indicator continuously monitors price action patterns and RSI momentum:
- Bullish Divergence : Detected when price makes lower lows while RSI makes higher lows, suggesting potential upward momentum
- Bearish Divergence : Identified when price makes higher highs while RSI makes lower highs, indicating potential downward momentum
The algorithm uses candle color transitions and immediate RSI comparisons to trigger signals without historical repainting , ensuring backtesting accuracy and real-time reliability.
How To Read
Important Notes
Higher Signal Frequency : The zero-lag approach increases signal sensitivity, generating more frequent alerts that may include false signals. Consider using additional confirmation methods for trade entries.
Non-Repainting : All signals are generated and maintained without historical modification, ensuring consistent backtesting and forward-testing results.
Input Parameters
RSI Length: Period for RSI calculation (default: 14)
Short/Long Periods: Lookback periods for divergence detection (default: 15/50)
Line Colors: Customizable colors for short and long period divergence lines
Label Settings: Optional divergence labels with custom text
This indicator is designed for traders seeking immediate divergence identification across multiple timeframes while maintaining signal integrity and backtesting reliability.

RSI PotentialRSI Potential
This indicator does more than just track RSI; it measures the "energy" or "fuel" left in a trend. It answers a critical question: how much further can the price move before momentum is exhausted?
The key insight is that high momentum often means low potential, and vice versa. This inverse relationship is what allows the indicator to provide powerful, forward-looking signals about trend health and potential reversals.
Think of it like a race car:
Momentum is the car's current speed.
Potential is the amount of fuel left in the tank.
A car at top speed (high momentum) is burning fuel rapidly (potential is decreasing). A car just starting (low momentum) has a full tank of fuel (high potential). This indicator helps you see the fuel gauge, not just the speedometer.
This indicator plots three distinct components in a separate pane below your chart:
1. Upside Potential (Green Line)
What it shows: The percentage price increase required to hit the Overbought RSI Level. In other words, how much "fuel" is left for the upward trend.
How to interpret it:
Low Value (Approaching Zero): This is a warning sign. It means the price is already in high gear, and there is very little room left to run before hitting overbought exhaustion. Even if the price is rocketing up (high momentum), low potential signals the rally is likely on its last legs.
High Value: This indicates the market has a full tank of fuel for a rally. Even if the price is moving sideways or slowly (low momentum), the high potential suggests that if a new uptrend starts, it has the energy to be sustainable and significant.
2. Downside Potential (Red Line)
What it shows: The percentage price decrease required to hit the Oversold RSI Level—the "fuel" for a downtrend.
How to interpret it:
Low Value (Approaching Zero): A warning for bears. The price may be dropping fast (high momentum), but it's running out of energy to fall further. This signals seller exhaustion and increases the probability of a bounce or reversal.
High Value: The market has significant room to fall before becoming oversold. This can confirm the health of a new downtrend or suggest that a current downtrend has more to go.
3. Net Potential (Columns / Histogram)
What it shows: The net balance of energy: Upside Potential - Downside Potential. It answers, "Which side has more fuel in the tank?"

Intelligent Top & Bottom Finder v9.8 Keyvankh📈 Intelligent Top & Bottom Finder v9.8 Keyvankh
A next-generation all-in-one trading system for precise tops, bottoms, and reversals across all timeframes.
---
🟢 Overview
This indicator is a powerful and intelligent solution for detecting market tops and bottoms, key reversals, and S/R zones with institutional-grade accuracy. Designed for traders seeking an edge in any market (crypto, forex, stocks), it combines advanced candlestick recognition, multi-indicator confirmation, smart support/resistance clustering, and strict signal filtering into one seamless tool.
---
🔎 How Does It Work?
1. Advanced Support & Resistance Clustering
Automatically detects and draws high-probability support and resistance zones using dynamic ATR-based pivot clustering.
Highlights breakouts and retest (flip) zones in real-time, adapting to changing market structure.
2. Full Candlestick Pattern Recognition
Scans for 15+ classic and advanced patterns: Engulfing, Pin Bar, Doji, Three Bar, Marubozu, Hammer, Shooting Star, Three White Soldiers, Three Black Crows, Tweezer, Morning/Evening Star, Kicker, Belt Hold, and more.
Scores each pattern’s strength based on location (S/R zone, retest, breakout), volume context, and confirmation signals.
3. Multi-Indicator Confirmation Engine**
Integrates and scores confirmation from up to five additional sources:
RSI Games 1.2** (smoothed LTF momentum shifts)
MACD Divergence** (bullish/bearish momentum reversal)
QQE+ v7 Advanced** (dynamic volatility filter)
OBV Trend Filter** (volume-backed trend validation)
Volume Game** (net volume spike and reversal detection)
Each module can be enabled or disabled to fit your personal trading style.
4. Institutional S/R and Retest Logic
Real-time recognition of major trendline breaks, retest zones, and price flips.
Automatic labeling and coloring of S/R zones, retest boxes, and confirmation candles.
5. Smart Buy & Sell Signal Generation**
Combines all scoring modules with strict logical filters and “failsafe override” logic (guaranteeing signal on confirmed hammers, engulfings, etc. even if other filters disagree).
Plots clear “BUY” and “SELL” labels only when a strong, multi-factor signal appears—minimizing noise and maximizing reliability.
Built-in fallback logic (optional) for edge cases.
6. Alerts & Automation Ready
TradingView alerts for all BUY, SELL, or ANY signal conditions—perfect for auto-trading or notification setups.
---
*⚙️ Customizable Inputs
Enable/Disable any module (RSI Games, MACD, OBV, QQE+, Candlestick Scanner, Volume Game)
Minimum Confirmations** required for a signal (1–10)
Pivot/Zone Sensitivity:** ATR multiplier, pivots per cluster, retest bar duration
LTF (Lower Timeframe) Confirmation:** Fully configurable
---
📊 How To Use**
Apply on any timeframe and symbol**—crypto, stocks, forex, indices.
Use as a **standalone reversal/entry tool** or to confirm your own technical setups.
Combine with your favorite momentum, trend, or volume indicators for advanced confluence.
Set up **TradingView alerts** for auto-trading, Telegram/email notifications, or trade journaling.
---
🟢 What Makes This Unique?
All-in-one multi-indicator fusion:** No more juggling a dozen scripts.
Institutional logic:** Goes beyond basic signals with true S/R, retest, and volume logic.
Full transparency:** Source code is clear and commented (if published open-source).
Fast and reliable:** Optimized for minimal lag and maximum accuracy.
---
⚠️ Disclaimer**
This indicator is a tool to assist with trade timing and risk management. **No system is 100% accurate.** Always use in conjunction with your own analysis and risk management practices.
---
📚 Credits & License**
Created by Keyvan Khodakhah.
You may use, modify, or share this script under the (mozilla.org).
Please credit the original author if you fork or reuse in public.
---
Questions, feedback, or collaboration? Contact: Keyvankh
---
Precision in technical analysis comes from layers of confluence and discipline. This tool brings that precision to your chart.

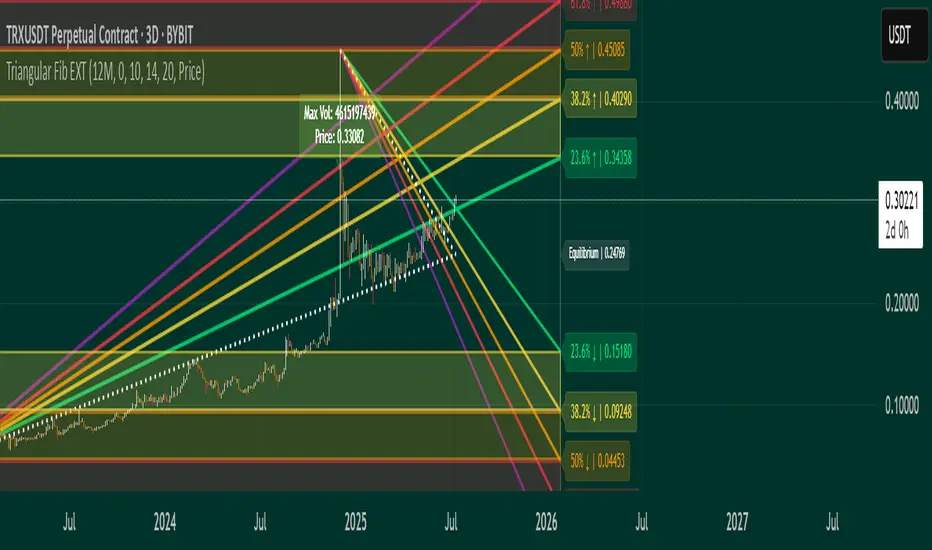
Triangular Fib🔍 Features
- Dynamic Lookback & Projection: Automatically adjusts the range and projection horizon based on timeframe changes.
- Triangular Fibonacci Arms: Projects fib levels upward and downward from high/low extremes to highlight potential price inflections.
- Volatility-Shaded Equilibrium: Visual zone highlights areas of consolidation or energy buildup before breakouts.
- Breakout Alerts: Detects and signals bullish/bearish breakouts from triangular fib thresholds.
- Auto-Traced Triangle Wedge: Dotted wedge lines visually represent narrowing price action from range extremes to midpoint.
Ideal for traders who seek visual clarity, price symmetry, and alert-driven decision-making across multiple timeframes. Whether you're swing trading or intraday scouting, this script provides a richly layered roadmap of market potential.
Not financial advice.
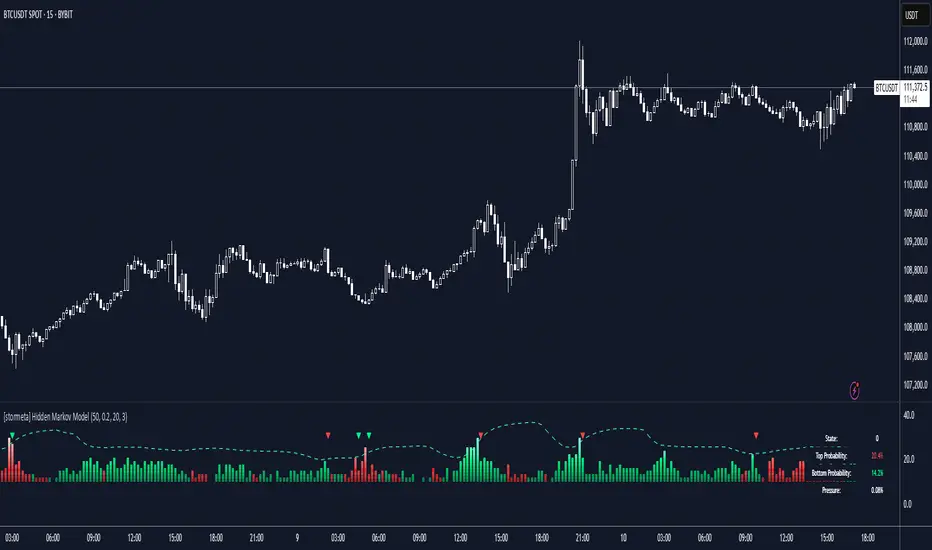
Hidden Markov ModelOverview
This model uses a Hidden Markov Model to identify and predict market regimes in real-time. It is designed to probabilistically identify market regime changes and predict potential reversal point using a forward algorithm to calculate the probability of a state.
Unlike traditional technical indicators that rely on price patterns or moving averages, this HMM analyses the underlying statistical structure of market movements to detect when the market transitions between different behavioural states such as trending, ranging, or volatile periods
How it works
The HMM assumes that market behavior follows hidden states that aren't directly observable, but can be inferred from observable market data (emissions). The model uses a (somewhat simplified) Bayesian inference to estimate these probabilities.
State 0: (Normal Trading): Market continuation patterns, balanced buying/selling
State 1: (Top Formation): Exhaustion patterns at price highs
State 2: (Bottom Formation): Capitulation patterns at price lows
How to use
1) Identify the trend (you can also use it counter-trend)
2) For longing, look for a green arrow. The probability values should be red. For shorting, look for a red arrow. The probability values should be green
3) For added confluence, look for high probability values of above 25%.
Advantages and what makes it unique
Unlike moving averages or oscillators that react to price changes, the HMM proactively identifies the underlying market structure. This forward-looking approach can signal regime changes before they become apparent in price action, providing traders with an informational edge.
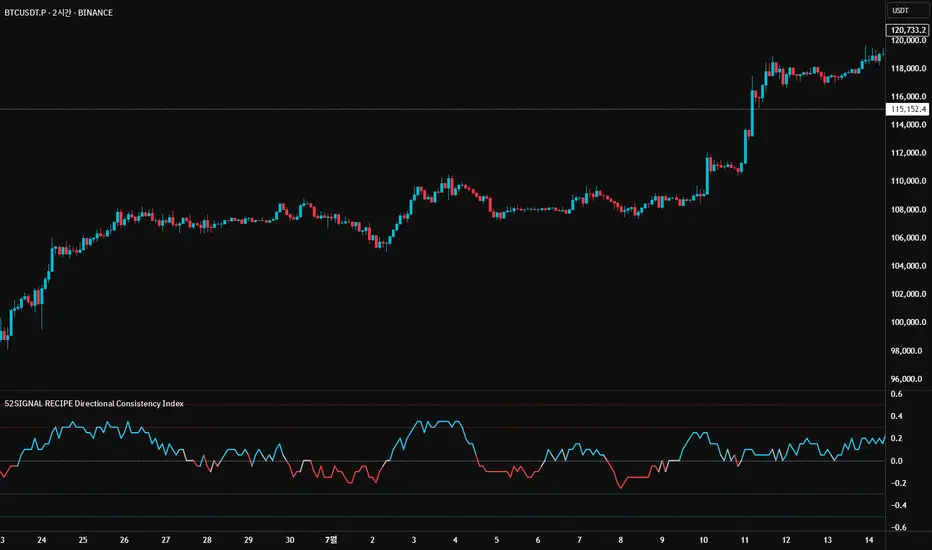
52SIGNAL RECIPE Directional Consistency Index═══ 52SIGNAL RECIPE Directional Consistency Index (DCI) ═══
◆ Overview
52SIGNAL Directional Consistency Index (DCI) is a technical indicator that measures the directional consistency of market movements. This indicator focuses on the consistency of direction rather than the magnitude of price changes, analyzing the strength of market trends and providing more reliable trend analysis by filtering out noise to reflect only meaningful price movements.
─────────────────────────────────────
◆ Key Features
• Direction-Focused Analysis: Concentrates solely on directional consistency rather than magnitude of price changes
• Noise Filtering: Ignores insignificant price movements through minimum percentage change settings
• Trend Exhaustion Detection: Identifies potential trend reversals as values approach ±0.5 levels
• Intuitive Visualization: Instant recognition of trend direction through color changes based on rising/falling zones
• Multi-Market Application: Adaptable to various financial markets including stocks, cryptocurrencies, and forex
─────────────────────────────────────
◆ Technical Foundation
■ Directional Calculation
• Basic Principle: Counts only the up/down movement of each candle to measure directional consistency
• Calculation Method: Determines direction based on percentage change between current close and previous close
• Direction Values: Simplified into Rising (+1), Falling (-1), or Insignificant Change (0)
• Averaging: DCI calculated as the moving average of direction values over the specified period
■ Noise Filtering Mechanism
• Minimum Percentage Change: The minimum percent change required to consider a price movement significant
• Filtering Effect: Movements smaller than the minimum change are excluded from direction calculation (treated as 0)
• Enhanced Reliability: Adjustable filtering strength for optimization across different market environments
─────────────────────────────────────
◆ Practical Applications
■ Trend Identification & Reversal Prediction
• Early Uptrend Detection:
▶ When DCI enters the 0 to +0.3 range
▶ When recent directional consistency begins to consistently rise
• Early Downtrend Detection:
▶ When DCI enters the 0 to -0.3 range
▶ When recent directional consistency begins to consistently fall
• Trend Reversal Signals:
▶ When DCI approaches +0.5 (uptrend exhaustion, potential downward reversal)
▶ When DCI approaches -0.5 (downtrend exhaustion, potential upward reversal)
■ Trading Strategy Implementation
• Trend Following Strategies:
▶ Consider buying when DCI crosses above the 0 line
▶ Consider selling when DCI crosses below the 0 line
• Reversal Trading:
▶ Consider taking profits or short positions when DCI approaches +0.5
▶ Consider long positions when DCI approaches -0.5
• Divergence Confirmation:
▶ Weakening uptrend signal when price rises but DCI weakens
▶ Weakening downtrend signal when price falls but DCI strengthens
─────────────────────────────────────
◆ Advanced Setting Options
■ Period (Length) Settings
• Short-term Analysis: 5-10 days (faster signals, more sensitive responses)
• Medium-term Analysis: 10-20 days (balanced signals, recommended default)
• Long-term Analysis: 20-30 days (slower signals, long-term trend identification)
■ Minimum Percentage Change Settings
• Low Volatility Markets: 0.05-0.2% (suitable for forex markets)
• Medium Volatility Markets: 0.3-0.5% (suitable for stock markets)
• High Volatility Markets: 0.5-1.0% (suitable for cryptocurrency markets)
■ Settings by Trading Style
• Scalping: Lower period (5-10), lower minimum change (0.05-0.1%)
• Day Trading: Medium period (10-15), medium minimum change (0.2-0.3%)
• Swing Trading: Higher period (15-25), higher minimum change (0.3-0.5%)
─────────────────────────────────────
◆ Synergy with Other Indicators
• Moving Averages: Strengthen signals by confirming moving average crossovers when DCI crosses the 0 line
• RSI: Combine DCI trend direction with RSI overbought/oversold levels to confirm entry points
• MACD: Enhance reliability by pairing DCI directional signals with MACD momentum confirmation
• Bollinger Bands: Analyze volatility by checking Bollinger Band expansion/contraction when DCI approaches ±0.5
─────────────────────────────────────
◆ Conclusion
52SIGNAL Directional Consistency Index (DCI) is a powerful tool for objectively measuring market directionality and visualizing trend strength. The noise filtering through minimum percentage change settings can be adjusted to match your trading style and market characteristics for optimal results. Its ability to identify early trend stages and detect overextended zones provides traders with important entry and exit points. When used in conjunction with other technical indicators, it can significantly enhance the reliability of trading decisions.
─────────────────────────────────────
※ Disclaimer: Past performance does not guarantee future results. Always use appropriate risk management strategies.
═══ 52SIGNAL 방향성 일관성 지수 (DCI) ═══
◆ 개요
52SIGNAL 방향성 일관성 지수(DCI)는 시장의 방향성 일관성을 측정하는 기술적 지표입니다. 이 지표는 가격 변화의 크기가 아닌 방향의 일관성에 중점을 두어 시장의 추세 강도를 분석하고, 노이즈 필터링 기능을 통해 의미 있는 가격 변동만을 반영하여 더 신뢰할 수 있는 추세 분석을 제공합니다.
─────────────────────────────────────
◆ 주요 특징
• 방향성 중심 분석: 가격 변화의 크기가 아닌 방향성에만 집중하여 추세의 일관성 측정
• 노이즈 필터링: 최소 변화율 설정을 통해 의미 없는 작은 가격 변동을 무시
• 추세 과열 감지: ±0.5 수준에 접근할 때 추세 전환 가능성 식별
• 직관적인 시각화: 상승/하락 구간에 따른 색상 변화로 추세 방향 즉각 인식
• 다양한 시장 적용: 주식, 암호화폐, 외환 등 다양한 금융 시장에 적용 가능
─────────────────────────────────────
◆ 기술적 기반
■ 방향성 계산
• 기본 원리: 각 캔들의 상승/하락 여부만 카운트하여 방향의 일관성 측정
• 계산 방법: 현재 종가와 이전 종가의 퍼센트 변화를 기준으로 방향 판단
• 방향 값: 상승(+1), 하락(-1), 의미 없는 변화(0)로 단순화
• 평균화: 설정된 기간 동안의 방향 값의 이동평균으로 DCI 산출
■ 노이즈 필터링 메커니즘
• 최소 변화율: 의미 있는 가격 변동으로 인정할 최소 퍼센트 변화
• 필터링 효과: 최소 변화율보다 작은 변동은 방향 계산에서 제외(0으로 처리)
• 신뢰도 향상: 필터링 강도 조절을 통해 다양한 시장 환경에 최적화 가능
─────────────────────────────────────
◆ 실용적 응용
■ 추세 식별 및 전환점 예측
• 상승 추세 초입:
▶ DCI가 0에서 +0.3 사이로 진입할 때
▶ 최근 방향성이 일관되게 상승하기 시작할 때
• 하락 추세 초입:
▶ DCI가 0에서 -0.3 사이로 진입할 때
▶ 최근 방향성이 일관되게 하락하기 시작할 때
• 추세 전환 신호:
▶ DCI가 +0.5에 가까워질 때 (상승 추세 과열, 하락 전환 가능성)
▶ DCI가 -0.5에 가까워질 때 (하락 추세 과열, 상승 전환 가능성)
■ 트레이딩 전략 적용
• 추세 추종 전략:
▶ DCI가 0선을 위로 돌파할 때 매수 고려
▶ DCI가 0선을 아래로 돌파할 때 매도 고려
• 반전 트레이딩:
▶ DCI가 +0.5에 근접할 때 이익실현 또는 매도 포지션 고려
▶ DCI가 -0.5에 근접할 때 매수 포지션 고려
• 다이버전스 확인:
▶ 가격은 상승하나 DCI가 약화될 때 상승 추세 약화 신호
▶ 가격은 하락하나 DCI가 강화될 때 하락 추세 약화 신호
─────────────────────────────────────
◆ 고급 설정 옵션
■ 기간(Length) 설정
• 단기 분석: 5-10일 (빠른 신호, 민감한 반응)
• 중기 분석: 10-20일 (균형 잡힌 신호, 기본 권장)
• 장기 분석: 20-30일 (느린 신호, 장기 추세 식별)
■ 최소 변화율(Minimum % Change) 설정
• 저변동성 시장: 0.05-0.2% (외환 시장에 적합)
• 중변동성 시장: 0.3-0.5% (주식 시장에 적합)
• 고변동성 시장: 0.5-1.0% (암호화폐 시장에 적합)
■ 트레이딩 스타일별 설정
• 스캘핑: 낮은 기간(5-10), 낮은 최소 변화율(0.05-0.1%)
• 데이 트레이딩: 중간 기간(10-15), 중간 최소 변화율(0.2-0.3%)
• 스윙 트레이딩: 높은 기간(15-25), 높은 최소 변화율(0.3-0.5%)
─────────────────────────────────────
◆ 다른 지표와의 시너지
• 이동평균선: DCI가 0선을 돌파할 때 이동평균 교차 확인으로 신호 강화
• RSI: DCI의 추세 방향과 RSI의 과매수/과매도 수준을 결합하여 진입점 확인
• MACD: DCI의 방향성 신호와 MACD의 모멘텀 확인을 결합하여 신뢰도 향상
• 볼린저 밴드: DCI가 ±0.5에 근접할 때 볼린저 밴드 확장/수축 확인으로 변동성 분석
─────────────────────────────────────
◆ 결론
52SIGNAL 방향성 일관성 지수(DCI)는 시장의 방향성을 객관적으로 측정하고 추세의 강도를 시각화하는 강력한 도구입니다. 최소 변화율 설정을 통한 노이즈 필터링은 각자의 트레이딩 성향과 시장 특성에 맞게 조정할 수 있어 최적의 효과를 누릴 수 있습니다. 추세의 초기 단계를 식별하고 과열 구간을 감지하는 능력은 트레이더에게 중요한 진입 및 퇴출 포인트를 제공합니다. 다른 기술적 지표와 함께 사용하면 트레이딩 결정의 신뢰도를 크게 향상시킬 수 있습니다.
─────────────────────────────────────
※ 면책 조항: 과거 성과가 미래 결과를 보장하지 않습니다. 항상 적절한 리스크 관리 전략을 사용하세요.
OA - RS HistogramOA - RS Histogram Indicator
This indicator displays a histogram representation of Relative Strength (RS) analysis, helping traders visualize the momentum relationship between a security and a reference index.
Key Features:
RS Histogram: Shows the difference between the current RS ratio and its EMA smoothed line
Customizable Reference Index: Default set to XU100, but can be changed to any index
EMA Smoothing: Adjustable EMA period (default 21) for trend analysis
Visual Clarity: Histogram bars are colored aqua for positive values and purple for negative values
Zero Line Reference: Dotted gray line for easy identification of positive/negative zones
How It Works:
The indicator calculates the relative strength by comparing the normalized percentage changes of the current security against the selected reference index. A 5-period EMA is applied to the RS ratio, and then the difference between this smoothed RS line and a longer EMA (default 21 periods) is displayed as a histogram.
Technical Calculation:
Fetches reference index data with proper gap handling
Calculates normalized percentage changes for both security and index
Computes relative strength ratio
Applies EMA smoothing to reduce noise
Displays the difference as a histogram for clear momentum visualization
Customization Options:
Reference index selection (default: XU100)
EMA length adjustment (default: 21 periods)
Color customization for positive and negative histogram bars
Alert Conditions:
Histogram crossing above zero (potential bullish momentum shift)
Histogram crossing below zero (potential bearish momentum shift)
Usage:
This tool helps traders understand relative strength concepts through visual histogram representation. The zero-line crossovers can indicate momentum shifts in the security relative to the chosen benchmark index.

Chaikin Oscillator Enhanced📊 What Is the Chaikin Oscillator?
The Chaikin Oscillator is a momentum indicator that helps traders understand the strength of buying and selling pressure in the market, based on volume and price movement.
It is calculated as the difference between two moving averages (short-term and long-term) of the Accumulation/Distribution Line (A/D Line). This line combines price and volume to show whether money is flowing into or out of an asset.
________________________________________
🧠 Simple Concept
• When big traders are buying, they usually do so with volume support—the Chaikin Oscillator picks this up.
• When volume is rising but price is falling, or vice versa, it shows hidden strength or weakness.
So, this indicator helps you see what the smart money is doing, even if the price isn’t moving much.
________________________________________
🛠️ How It Works
• Oscillator Value Above Zero → More buying pressure (bullish).
• Oscillator Value Below Zero → More selling pressure (bearish).
• Crossing above zero → A potential buy signal.
• Crossing below zero → A potential sell signal.
The histogram (vertical bars) in the indicator changes color:
• Green bars = Positive momentum.
• Red bars = Negative momentum.
________________________________________
🎯 How Traders Use It for Entry and Exit
✅ For Entries:
• Buy Entry: When the oscillator crosses above the zero line and the bars turn green, it means buyers are stepping in with volume.
• For better confirmation, combine it with price breaking above a resistance level.
❌ For Exits or Shorts:
• Sell Exit or Short Entry: When the oscillator crosses below the zero line and bars turn red, it suggests selling pressure is growing.
• If the price is also below support, it’s a stronger signal.
________________________________________
🔍 Example Use Case:
1. You’re watching a stock or crypto that's been going sideways.
2. Suddenly, the Chaikin Oscillator crosses above zero, and green bars appear.
3. That’s your early clue that big buyers might be entering.
4. If price confirms this with a breakout, you can enter a long position.
________________________________________
🌐 Where Is It Useful?
The Chaikin Oscillator is great for:
• Stocks (especially volume-heavy large caps)
• ETFs
• Cryptocurrency (on exchanges that provide volume data)
• Forex – less reliable unless volume is proxy-based
⚠️ Important: It won’t work well on instruments where volume data is missing or unreliable (like some CFDs or synthetic assets).
________________________________________
🧭 Pro Tips for Using It:
• Combine it with support/resistance, moving averages, or candlestick patterns.
• Avoid trading only based on this indicator—use it as confirmation.
• Use the alerts (added in the script) so you don’t miss key movements.
________________________________________

AMV Impulse AssistantThe AMV Impulse Assistant is a custom momentum tool designed to assess how aggressively price is moving relative to recent volatility. It combines Bollinger-based range analysis and fast-moving average behavior to generate a dynamic impulse score. This score helps identify when price action is potentially overextended or showing signs of unusual momentum — useful for pullback traders, breakout traders, and anyone managing entries during trending conditions.
What it does:
Tracks the relationship between a short WMA and Bollinger basis to gauge directional strength.
Measures price movement compression/expansion with a normalized Bollinger Width Percentile.
Combines both into a smoothed Impulse Score (from -10 to +10) that reflects how aggressively price is pushing in either direction.
Colors the score line and highlights background zones when momentum enters extreme ranges.
📈 Use case:
This tool is especially effective for day traders who need to quickly identify when price is moving abnormally fast — either as an exhaustion signal or confirmation of an aggressive continuation. It can be used to:
Confirm the end of a pullback.
Spot overly aggressive moves that may revert.
Avoid entries during neutral chop or volatility compression.
It is best used alongside your primary trend filters and execution tools as a supplementary confirmation.

AMV Volume AssistantThe AMV Volume Assistant is a custom tool that visualizes volume delta strength using percentile-based scoring. It helps identify potential overbought and oversold conditions by measuring how strong recent buying or selling pressure is compared to historical volume behavior.
What it does:
Tracks delta accumulation using lower timeframe data split into buying and selling volume based on candle direction.
Converts this accumulation into a percentile score to show relative strength or weakness.
Colors the background green or red when the smoothed score crosses key thresholds (+3 or -3), highlighting moments of possible volume exhaustion or continuation.
Use case:
This tool is useful for intraday traders who want a simple way to spot strong buying or selling pressure and assess when the move may be overextended. It works best as a supporting indicator alongside your main strategy or trend framework.
This tool works best on futures such as CME_MINI:NQ1! due to the accuracy of volume data provided.
IMPORTANT: On lower tf's such as the 1 minute timeframes, 5s data is needed so a premium subscription is required for the use of this indicator.

Chaikin Money Flow (CMF) [ParadoxAlgo]OVERVIEW
This indicator implements the Chaikin Money Flow oscillator as an overlay on the price chart, designed to help traders identify institutional money flow patterns. The Chaikin Money Flow combines price and volume data to measure the flow of money into and out of a security, making it particularly useful for detecting accumulation and distribution phases.
WHAT IS CHAIKIN MONEY FLOW?
Chaikin Money Flow was developed by Marc Chaikin and measures the amount of Money Flow Volume over a specific period. The indicator oscillates between +1 and -1, where:
Positive values indicate money flowing into the security (accumulation)
Negative values indicate money flowing out of the security (distribution)
Values near zero suggest equilibrium between buying and selling pressure
CALCULATION METHOD
Money Flow Multiplier = ((Close - Low) - (High - Close)) / (High - Low)
Money Flow Volume = Money Flow Multiplier × Volume
CMF = Sum of Money Flow Volume over N periods / Sum of Volume over N periods
KEY FEATURES
Big Money Detection:
Identifies significant institutional activity when CMF exceeds user-defined thresholds
Requires volume confirmation (volume above average) to validate signals
Uses battery icon (🔋) for institutional buying and lightning icon (⚡) for institutional selling
Visual Elements:
Background coloring based on money flow direction
Support and resistance levels calculated using Average True Range
Real-time dashboard showing current CMF value, volume strength, and signal status
Customizable Parameters:
CMF Period: Calculation period for the money flow (default: 20)
Signal Smoothing: EMA smoothing applied to reduce noise (default: 5)
Big Money Threshold: CMF level required to trigger institutional signals (default: 0.15)
Volume Threshold: Volume multiplier required for signal confirmation (default: 1.5x)
INTERPRETATION
Signal Types:
🔋 (Battery): Indicates strong institutional buying when CMF > threshold with high volume
⚡ (Lightning): Indicates strong institutional selling when CMF < -threshold with high volume
Background color: Green tint for positive money flow, red tint for negative money flow
Dashboard Information:
CMF Value: Current Chaikin Money Flow reading
Volume: Current volume as a multiple of 20-period average
Big Money: Status of institutional activity (BUYING/SELLING/QUIET)
Signal: Strength assessment (STRONG/MEDIUM/WEAK)
TRADING APPLICATIONS
Trend Confirmation: Use CMF direction to confirm price trends
Divergence Analysis: Look for divergences between price and money flow
Volume Validation: Confirm breakouts with corresponding money flow
Accumulation/Distribution: Identify phases of institutional activity
PARAMETER RECOMMENDATIONS
Day Trading: CMF Period 14-21, higher sensitivity settings
Swing Trading: CMF Period 20-30, moderate sensitivity
Position Trading: CMF Period 30-50, lower sensitivity for major trends
ALERTS
Optional alert system notifies users when:
Big money buying is detected (CMF above threshold with volume confirmation)
Big money selling is detected (CMF below negative threshold with volume confirmation)
LIMITATIONS
May generate false signals in low-volume conditions
Best used in conjunction with other technical analysis tools
Effectiveness varies across different market conditions and timeframes
EDUCATIONAL PURPOSE
This open-source indicator is provided for educational purposes to help traders understand money flow analysis. It demonstrates the practical application of the Chaikin Money Flow concept with visual enhancements for easier interpretation.
TECHNICAL SPECIFICATIONS
Overlay indicator (displays on price chart)
No repainting - all calculations are based on closed bar data
Suitable for all timeframes and asset classes
Minimal resource usage for optimal performance
DISCLAIMER
This indicator is for educational and informational purposes only. Past performance does not guarantee future results. Always conduct your own analysis and consider risk management before making trading decisions.

Tsallis Entropy Market RiskTsallis Entropy Market Risk Indicator
What Is It?
The Tsallis Entropy Market Risk Indicator is a market analysis tool that measures the degree of randomness or disorder in price movements. Unlike traditional technical indicators that focus on price patterns or momentum, this indicator takes a statistical physics approach to market analysis.
Scientific Foundation
The indicator is based on Tsallis entropy, a generalization of traditional Shannon entropy developed by physicist Constantino Tsallis. The Tsallis entropy is particularly effective at analyzing complex systems with long-range correlations and memory effects—precisely the characteristics found in crypto and stock markets.
The indicator also borrows from Log-Periodic Power Law (LPPL).
Core Concepts
1. Entropy Deficit
The primary measurement is the "entropy deficit," which represents how far the market is from a state of maximum randomness:
Low Entropy Deficit (0-0.3): The market exhibits random, uncorrelated price movements typical of efficient markets
Medium Entropy Deficit (0.3-0.5): Some patterns emerging, moderate deviation from randomness
High Entropy Deficit (0.5-0.7): Strong correlation patterns, potentially indicating herding behavior
Extreme Entropy Deficit (0.7-1.0): Highly ordered price movements, often seen before significant market events
2. Multi-Scale Analysis
The indicator calculates entropy across different timeframes:
Short-term Entropy (blue line): Captures recent market behavior (20-day window)
Long-term Entropy (green line): Captures structural market behavior (120-day window)
Main Entropy (purple line): Primary measurement (60-day window)
3. Scale Ratio
This measures the relationship between long-term and short-term entropy. A healthy market typically has a scale ratio above 0.85. When this ratio drops below 0.85, it suggests abnormal relationships between timeframes that often precede market dislocations.
How It Works
Data Collection: The indicator samples price returns over specific lookback periods
Probability Distribution Estimation: It creates a histogram of these returns to estimate their probability distribution
Entropy Calculation: Using the Tsallis q-parameter (typically 1.5), it calculates how far this distribution is from maximum entropy
Normalization: Results are normalized against theoretical maximum entropy to create the entropy deficit measure
Risk Assessment: Multiple factors are combined to generate a composite risk score and classification
Market Interpretation
Low Risk Environments (Risk Score < 25)
Market is functioning efficiently with reasonable randomness
Price discovery is likely effective
Normal trading and investment approaches appropriate
Medium Risk Environments (Risk Score 25-50)
Increasing correlation in price movements
Beginning of trend formation or momentum
Time to monitor positions more closely
High Risk Environments (Risk Score 50-75)
Strong herding behavior present
Market potentially becoming one-sided
Consider reducing position sizes or implementing hedges
Extreme Risk Environments (Risk Score > 75)
Highly ordered market behavior
Significant imbalance between buyers and sellers
Heightened probability of sharp reversals or corrections
Practical Application Examples
Market Tops: Often characterized by gradually increasing entropy deficit as momentum builds, followed by extreme readings near the actual top
Market Bottoms: Can show high entropy deficit during capitulation, followed by normalization
Range-Bound Markets: Typically display low and stable entropy deficit measurements
Trending Markets: Often show moderate entropy deficit that remains relatively consistent
Advantages Over Traditional Indicators
Forward-Looking: Identifies changing market structure before price action confirms it
Statistical Foundation: Based on robust mathematical principles rather than empirical patterns
Adaptability: Functions across different market regimes and asset classes
Noise Filtering: Focuses on meaningful structural changes rather than price fluctuations
Limitations
Not a Timing Tool: Signals market risk conditions, not precise entry/exit points
Parameter Sensitivity: Results can vary based on the chosen parameters
Historical Context: Requires some historical perspective to interpret effectively
Complementary Tool: Works best alongside other analysis methods
Enjoy :)

ADX & Angle Strength📌 Indicator Overview – ADX Angle Strength
This script merges the power of the traditional ADX with a visual interpretation of the angular slope of a moving average, offering a highly effective tool to identify real impulses in price action. The goal of the indicator is not only to highlight market strength, but to reveal direction and slope —helping traders spot the end of impulses, consolidation zones, and potential reversal points.
This script does not aim to replace or compete with ADX, but instead highlights a lesser-used metric: the true angular slope of a moving average as a functional and interpretable force component. Rather than relying exclusively on traditional strength tools, it introduces an immediate, intuitive, and quantifiable way to observe trend steepness — reinforced by a robust metric like ADX.
The author considers both perspectives valuable. While ADX remains an integral part of their technical analysis, greater attention is often given to the angles formed by price-tracking moving averages, as they offer faster insight into trend acceleration. This dual-approach — with one reactive and one confirmatory signal — makes ADX & AngleStrength a practical, clear, and flexible tool for analyzing market momentum from two synchronized yet distinct vantage points.
Key user-configurable options:
- Display of ADX lines (DI+, DI−, zero line, lines 20, 25, 50, and 75)
- ADX length and smoothing
- Moving average type (SMA, EMA, WMA, HMA, ALMA)
- Length, source, color, and style of the angle calculation
- Minimum angle threshold to define color changes (slope comparison)
This indicator is highly sensitive and allows users to visualize:
- Range zones via flat angles (yellow)
- Bullish or bearish impulses through positive or negative slopes (green and red)
- Convergences or divergences relative to traditional ADX strength
📘 Single Real-World Example: Step-by-Step Interpretation
In this section, we’ll walk through a single real-world example on a 1-hour chart, divided into five key moments marked by vertical lines labeled A, B, C, D, and E. Each line identifies a specific point in the movement of price and indicator behavior. We’ll move through the chart step-by-step, explaining what happens between each line and how each indicator responds.
Before Line A: The setup
The chart shows a slight upward movement in the price, though not particularly strong. This section doesn’t have any lines marked yet but sets the foundation for what’s coming next.
The ADX is falling, dropping below the 20-level threshold, which usually signals weakening market momentum. However, the angle indicator, which is more sensitive, starts pointing upward, detecting an increase in slope as the price begins climbing.
This early upward tilt is what we call a rising angle, suggesting the market is gaining slope.
🅰 Line A: First peak
As the upward move completes, a peak forms right at Line A. The angle at that moment reaches +44.70°, showing a relatively strong upward slope.
After Line A:
- Price stalls, entering a sideways range — a classic consolidation.
- The angle indicator begins to fall, because price action no longer has a strong slope.
- The ADX, however, keeps rising, continuing even after the angle begins to decline. It reaches a peak at 35.6, then gradually drops to 15.13, reflecting that the trend’s strength has faded.
🅱 Line B: Sharp drop
Following the sideways range after Line A, the price breaks downward with a strong bearish candle.
This is where the second peak happens — but this time it's a negative angle, as price drops quickly. The angle reaches -48.45°, clearly marking the end of this quick bearish impulse.
At the same moment:
- The ADX, recovering from its earlier drop, reaches 21.83 and continues rising after the angle has peaked.
- This shows that while the angle detects the end of the move, the ADX is still registering the momentum that just occurred — a bit delayed, but confirming.
🅲 Line C: Key turning point
After the drop at Line B, price moves sideways again. During this range:
- The angle gradually declines and enters a yellow zone, indicating low slope or momentum.
But at Line C, everything changes. Unlike the other lines, Line C does not mark a peak, but rather the beginning of a stronger downward move.
From here:
- Price breaks through the range and continues falling — this marks the start of a stronger trend.
- The angle indicator shows a sequence of five descending peaks, tracking the steepening drop in price:
1. 26.47°
2. 40.64°
3. 35.87°
4. 38.71°
5. 66.3° (the steepest)
- The ADX starts rising in parallel, confirming the growing strength of the trend.
🅳 Line D: Bottom and reversal
At Line D, price reaches a bottom — a point of exhaustion marked by high volume, sometimes known as a volume climax or stopping volume.
- The angle reaches its steepest reading so far: 66.3° negative.
- The ADX keeps rising for two more candles after this angle peak, then begins to fall — revealing that the angle catches the momentum shift earlier.
🅴 Line E: Bullish reversal and final peak
After the low at Line D, price begins to rise steadily. The angle responds immediately, tilting upward again.
At Line E, we get the final peak, this time positive, as the bullish move reaches its climax. The angle here is +71.64° — the highest reading in the entire example.
Meanwhile:
- The ADX is still falling at this point, having peaked two candles after Line D and never recovering in time to catch this bullish push.
- Once again, the angle proves more responsive to changes in price behavior, especially at the end of impulses.
⚠️ Compatibility and Intended Use
This indicator is specifically designed to be used on Binance charts, as it is intended for the analysis of cryptocurrency markets, and Binance exclusively operates with crypto assets. It has been optimized for the following timeframes:
- 1 minute
- 5 minutes
- 15 minutes
- 30 minutes
- 1 hour
- 4 hours
- 1 day
These intervals were selected based on the internal architecture used for angle computation. As such, the indicator will not display any data outside of these supported timeframes or on non-Binance assets. Attempting to apply it beyond those conditions will produce a blank chart by design.
👤 Author
This indicator was developed as part of a visual technical analysis project focused on capturing true momentum through combined signals.
📄 User guide available in both Spanish and English for clarity and learning.

Volume bar range# Volume Bar Range (VBR) Indicator
## Overview
The Volume Bar Range indicator identifies key support and resistance levels based on high-volume price bars. It creates a visual range that represents significant price levels where the market has shown strong interest through volume confirmation.
## Features
### Visual Range Display
- **Blue/Aqua Area**: Shows the price range of the highest volume bar within the lookback period
- **Dynamic Color**: The fill color changes to indicate whether the range is stable (aqua) or newly updated (white)
- **Boundary Lines**: Invisible white lines mark the upper and lower boundaries of the range
### Trading Signals
- **BUY Signal**: Blue upward arrow appears when price breaks above the resistance level with volume confirmation
- **SELL Signal**: Black downward arrow appears when price breaks below the support level with volume confirmation
## How to Use
### Setup
1. Apply the indicator to any chart
2. The indicator automatically identifies the highest volume bar in the last 55 periods
3. The price range of this high-volume bar becomes your support/resistance zone
### Trading Strategy
- **Range Trading**: Trade within the identified support/resistance range
- **Breakout Trading**: Enter positions when price breaks above resistance (BUY) or below support (SELL)
- **Volume Confirmation**: Only take signals when current volume exceeds the 21-period average
### Signal Interpretation
- **BUY Signal**: Price closes above the resistance level with above-average volume
- **SELL Signal**: Price closes below the support level with above-average volume
- **No Signal**: Price remains within the range or volume is insufficient
## Key Parameters
- **Lookback Period**: 55 bars (automatically identifies the highest volume bar)
- **Volume MA**: 21-period simple moving average for volume confirmation
- **Signal Size**: Tiny markers to avoid chart clutter
## Best Practices
- Use on multiple timeframes for confirmation
- Combine with other technical indicators for stronger signals
- Pay attention to the color changes in the range area
- Consider market context and overall trend direction
## Ideal Markets
- Works well on liquid markets with consistent volume patterns
- Effective on stocks, forex, and crypto markets
- Best suited for swing trading and medium-term analysis
This indicator is particularly useful for traders who rely on volume analysis and want to identify key price levels where the market has shown significant interest.
