MACD minutesIt´s a multiple (3) Moving Average Convergence Divergence (MACD) indexes. It was created to help traders to identify trend changes in multilple time frames, in the same graph.Индикатор Pine Script®от Aldovitch4436
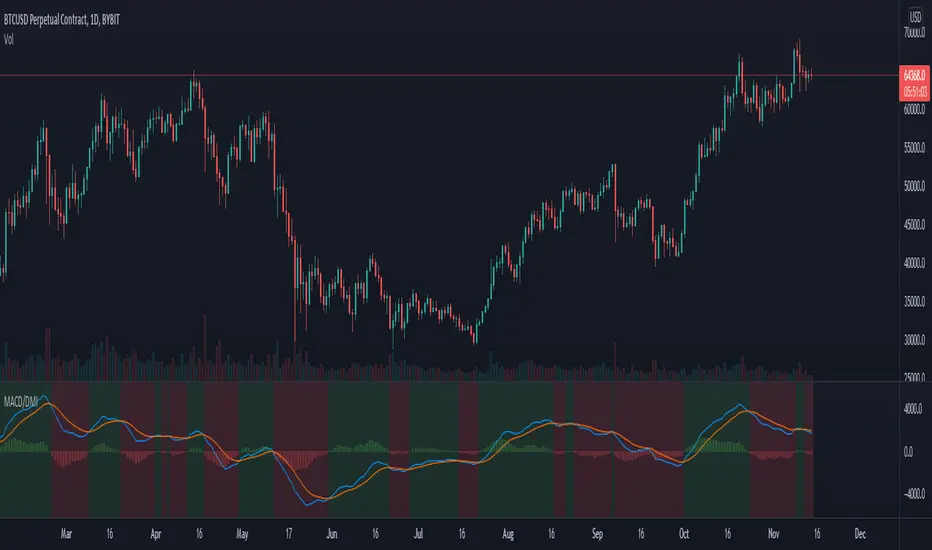
P-MACD by DGTPrice and Moving Averages Convergence/Divergence, shortly named as P-MACD P-MACD is a trend-following momentum indicator that shows the relationship between Price and Long-term Moving Average (PMACD), and the relationship between two Moving Averages (MAMACD). P-MACD is composed of two lines, and an histogram, showing price distance (convergence/divergence) to its Long-term MA (PMACD), showing short-term MA distance (convergence/divergence) to long-term MA (MAMACD), and a histogram showing the difference (momentum) between the PMACD and MAMACD The PMACD is calculated by dividing the Price to Long-term Moving Average (200-period SMA/EMA) and finally smoothed with 9-period SMA/EMA - PMACD Line Formula : (Price / SlowMovingAverage -1) * 100 and smoothed with 9-period SMA/EMA The MAMACD is calculated by dividing the Short-term Moving Average (such as 20 SMA/EMA) to the Long-term Moving Average (such as 200-period SMA/EMA) - MAMACD Line Formula : (FastMovingAverage / SlowMovingAverage -1) * 100 The Histogram is calculated by subscripting PMACD and MAMACD - Formula : PMACD - MAMACD Optional Trend Cloud calculated based on fast and slow version of MAMACD What to look for: - Line Crosses : PMACD Line can function as a trigger(signal) for buy and sell signals. Buy when the PMACD crosses above the MAMACD line and sell - or short - when the PMACD crosses below the MAMACD line - Base Crosses : PMACD and/or MAMACD crosses above or below Baseline is another way to indicate the trend and momentum. MAMACD crosses of Baseline, MAMACD positive or negative, reflects short-term moving average crosses the long-term moving average and similarly, PMACD crosses of BaseLine, PMACD positive or negative, reflects price crosses a long-term moving average - Momentum : P-MACD helps investors understand whether the bullish or bearish movement in the price is strengthening or weakening displayed with a histogram which graphs the distance between the PMACD and MAMACD. Additionally, upward momentum is confirmed with a bullish crossover, which occurs when PMACD and/or MAMACD crosses above Baseline. Conversely, downward momentum is confirmed with a bearish crossover, which occurs when PMACD and/or MAMACD crosses below Baseline - Distance : Prices high above the moving average (MA) or low below it are likely to be remedied in the future by a reverse price movement. The more distant the PMACD is above or below its baseline indicates that the distance between the Price and its SMA is growing (regarding PMACD, You may find a detailed article explained in “Price Distance to its MA” indicator by DGT) . Similarly the more distant the MAMACD is above or below its baseline indicates that the distance between the two SMAs is growing - Trend : A rising P-MACD indicates an uptrend, while a declining P-MACD indicates a downtrend MACD vs. P-MACD MACD measures the relationship between two MAs, while the P-MACD measures both the relationship between price and its MA, and the relationship between two MAs. MAMACD Line of P-MACD If set to same moving average type and same lengths as in MACD will produce the same line as MACD line, only values are represented as percentage with MAMACD. Both measure momentum in a market, but, because they measure different factors, they differentiate from each other even if they have similarities in presentation. P-MACD provides additional insights, not only to MA relation but also to Price and MA relation Warning : Moving Average are calculated based on past prices, so they are lagging. The longer the time period for the moving average, the greater the lag as well as less sensitive to price changes. This study implements usage of 200-period long-term moving average, which implies that the P-MACD will provide insight especially for long-term trades, more suited for long-term trades, usage of P-MACD for short-term trades is recommend with lower timeframes (1H or lower). Indicators aim to generate a potential signal/indication of an upcoming opportunity, but, the Indicators themselves do not guarantee the future movement of a given financial instrument, and are most useful when used in combination with other techniques. Trading success is all about following your trading strategy and the indicators should fit within your trading strategy, and not to be traded upon solely Disclaimer : The script is for informational and educational purposes only. Use of the script does not constitutes professional and/or financial advice. You alone the sole responsibility of evaluating the script output and risks associated with the use of the script. In exchange for using the script, you agree not to hold dgtrd tradingview user liable for any possible claim for damages arising from any decision you make based on use of the script Индикатор Pine Script®от dgtrdОбновлено 1313736
Price Distance to its MA by DGTPrices high above the moving average (MA) or low below it are likely to be remedied in the future by a reverse price movement as stated in an Article by Denis Alajbeg, Zoran Bubas and Dina Vasic published in International Journal of Economics, Commerce and Management Here comes a study to indicate the idea of this article, Price Distance to its Moving Averages (P/MA Ratio) The analysis expressed in the paper indicates that there is a connection between the distance of the prices to moving averages and subsequent returns : portfolios of stocks with lower prices to moving averages generally outperformed portfolios of stocks with higher prices to moving averages. This “overextended” effect is more pronounced when using shorter moving averages of 20 and 50 days, and is especially strong in short-term holding periods like one and two weeks. The highest annual returns are recorded when buying in the range of 0-5% below shorter moving averages of 20/50 days, and 0-10% below longer moving averages of 100/200 days. However, buying very far below almost all moving averages on almost all holding periods produces the lowest returns. The concept of this study recognizes three different modes of action. In a clearly established upward trend traders should be buying when prices are near or below the MA line and selling when prices move too far above the MA. Conversely, in downward trend stocks should be shorted when reaching or going above the moving average and covered when they drop too far below the MA line. In a sideways movement traders are advised to buy if the price is too low below the moving average and sell when it goes too far above it Short-term traders can expect to outperform in a one or two week time window if buying stocks with lower prices compared to their 20 and 50 SMA/EMA, one to two-week holding periods is quite high, ranging from 72,09% to 90,61% for the SMA(20, 50) and 85,03% to 87,5% for the EMA(20, 50). The best results for the SMA 20 and 50, on average, are concentrated in the region of 0-5% below the MA for the majority of holding periods. Buying very far below almost all MA in almost all holding periods turns out to be the worst possible option Candle patterns, momentum could be used in conjunction with this indicator for better results. Try Colored DMI and Ichimoku colored SuperTrend by DGT Индикатор Pine Script®от dgtrdОбновлено 4141 1.6 K
MACD with BGThis is a standard MACD indicator with Background colour and the option to draw the Background colour of the next higher timeframe.Индикатор Pine Script®от ramsay09Обновлено 22309
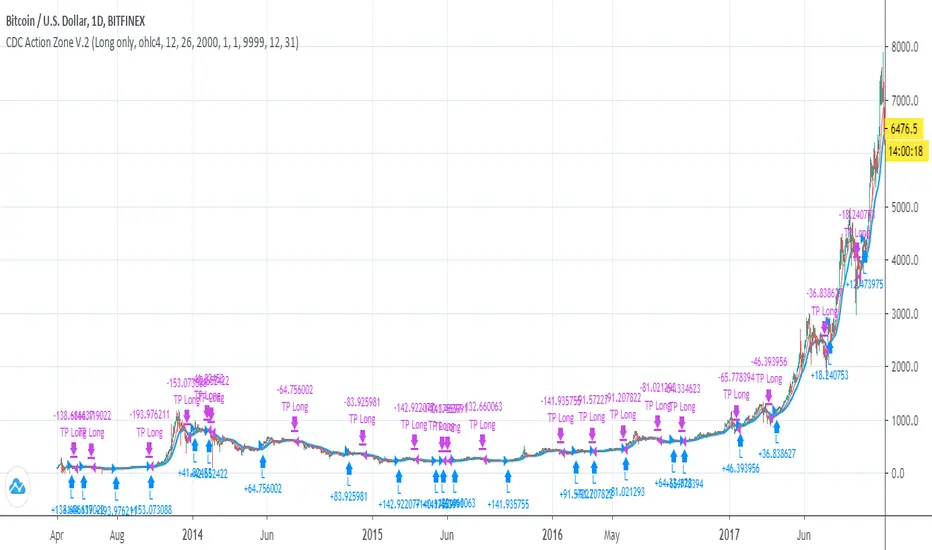
CDC Action Zone V.2 Strategy BacktestPublished for backtest purpose All credit to : CDC Action Zone V.2 by piriya33 จัดทำขึ้นเพื่อการดูผล Backtest เขียวซื้อแดงขาย ตัวสคริปท์มีการเพิ่ม - Strategy Long/Short/Both // ปรับได้ใน Setting - Back test range // ปรับได้ใน SettingСтратегия Pine Script®от DeMindSET11140
MACD Trend Following Strategy How it work ? Work like normal MACD because this is MACD without any modify but i add color of candlestick and strategy. The color meaning : Green= macd > signal and macd>0 (Buy) Red= macd < signal and macd<0 (Sell) Yellow= macd > signal and macd<0 (Maybe reversal point) Blue= macd < signal and macd>0 (Maybe reversal point) Feature - Back test range - Long/Short option - Modifiable MACD Setting Стратегия Pine Script®от DeMindSETОбновлено 1175
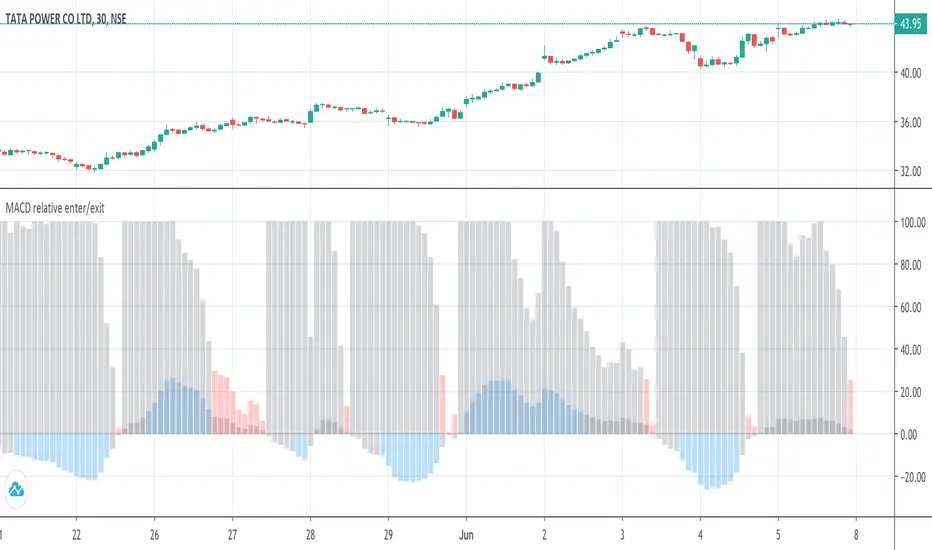
MACD histogram relative open/closePrelude This script makes it easy to capture MACD Histogram open/close for automated trading. There seems to be no "magic" value for MACD Histogram that always works as a cut-off for trade entry/exit, because of the variation in market price over time. The idea behind this script is to replicate the view of the MACD graph we (humans) see on the screen, in mathematics, so the computer can approximately detect when the curve is opening/closing. Math The maths for this is composed of 2 sections - 1. Entry - i. To trigger entry, we normalize the Histogram value by first determining the lowest and highest values on the MACD curves (MACD, Signal & Hist). ii. The lowest and highest values are taken over the "Frame of reference" which is a hyperparameter. iii. Once the frame of reference is determined, the entry cutoff param can be defined with respect to the values from (i) (10% by default) 2. Exit To trigger an exit, a trader searches for the point where the Histogram starts to drop "steeply". To convert the notion of "steep" into mathematics - i. Take the max histogram value reached since last MACD curve flip ii. Define the cutoff with reference to the value from (i) (30% by default) Plots Gray - Dead region Blue - Histogram opening Red - Histogram is closing Notes A good value for the frame of reference can be estimated by looking at the timescale of the graph you generally work with during manual trading. For me, that turned out to be ~2.5 hours. (as shown in the above graph) For a 3-minute ticker, frame of reference = 2.5 * 60 / 3 = 50 Which is the default given in this script. Ultimately, it is up to you to do grid search and find these hyperparams for the stock and ticker size you're working with. Also, this script only serves the purpose of detecting the Histogram curve opening/closing. You may want to add further checks to perform proper trading using MACD. Индикатор Pine Script®от devxpyОбновлено 11106
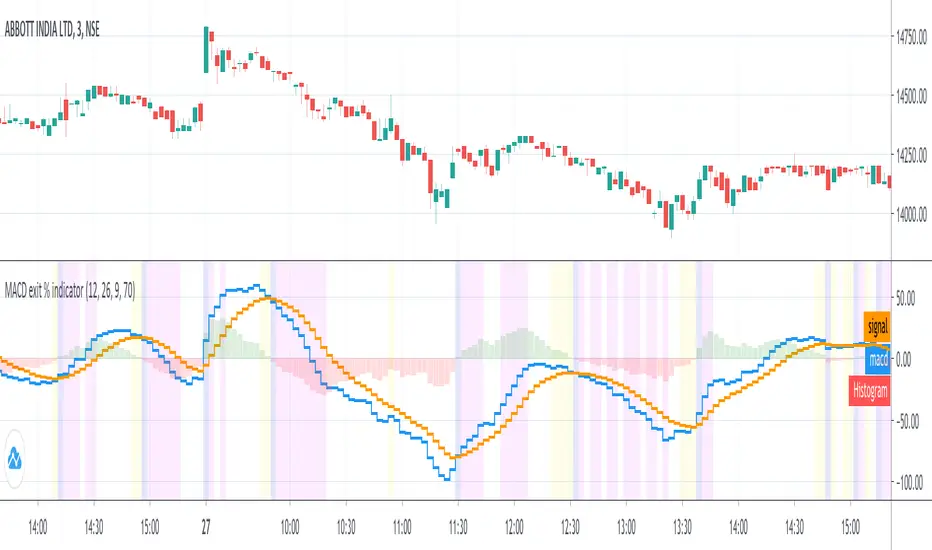
MACD exit % indicatorIntroduction An exit indicator for MACD, good for triggering order exit via MACD. It works by considering and the . Then, it just exits when the % change in these values surpasses a threshold. Indicators blue line - MACD orange line - Signal green/red columns - Histogram aqua background - Last Histogram Flip fuchsia background - Max abs(Histogram) value after last flip orange Background - Exit region Индикатор Pine Script®от devxpyОбновлено 77443
{INDYAN} RSI + MACDModded RSI and MACD for intraday use. If rsi above 60 and macd is above zero line then go for buy and if rsi is below 40 and macd below zero line then go for sell side. use it in small timeframe i.e. 3 minute or less. better for scalp trading Happy Trading Love INDYAN #It can be used best with INDYAN Go With Trend Индикатор Pine Script®от IndyanОбновлено 7373 4 K
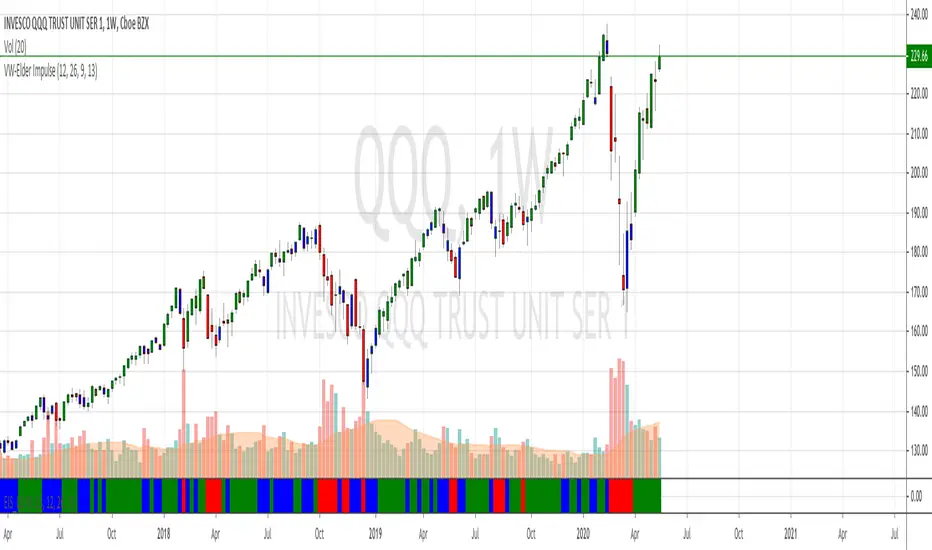
Volume-Weighted Elder Impulse SystemThis is a volume-weighted version of the Elder Impulse System. The Elder Impulse System utilizes the MACD along with EMA13(in general) to find the optimal entry and exit points. In this version, the MACD and EMA have both been changed into a Volume-weighted version. With volume involved, the indicator is, in general, faster than the original Elder Impulse system, in showing entry and exit points.Индикатор Pine Script®от xbj33177
DMA: Moving Average of OscillatorTechnical Indicator Moving Average of Oscillator (Moving Average of Oscillator OsMA) is the difference between the oscillator and oscillator smoothing. In this case, an oscillator is used the basic MACD line and the smoothing of the signal. Calculate: OSMA = MACD - SIGNAL MACD = EMA(CLOSE, 12) - EMA(CLOSE, 26) SIGNAL = EMA(MACD, 9)Индикатор Pine Script®от baiturinОбновлено 33536
MACD ColorMACD with color in Histogram and Signal to easily spot a potential change of trend.Индикатор Pine Script®от David_GDL66 1 K
Combing in MACD and MTFHi all, I'm trying to wedge in the MACD into a multiple timeframe. Scope is to create: 1) an alert when the MACD across all timeframes is positive, 2) an alert when the MACD across all timeframes is negative, and 3) one when neither of them is applicable. Would anyone be so kind to give it some thoughts, please? //@version=2 strategy(" Easy MTF Strategy", overlay=false) TF_1_time = input("3", "Timeframe 1") TF_2_time = input("5", "Timeframe 2") TF_3_time = input("15", "Timeframe 3") TF_4_time = input("30", "Timeframe 4") fastLen = input(title="Fast Length", type=integer, defval=12) slowLen = input(title="Slow Length", type=integer, defval=26) sigLen = input(title="Signal Length", type=integer, defval=9) = macd(close, fastLen, slowLen, sigLen) width = 5 upcolor = green downcolor = red neutralcolor = blue linestyle = line TF_1 = security(tickerid, TF_1_time, open) < security(tickerid, TF_1_time, close) ? true:false TF_1_color = TF_1 ? upcolor:downcolor TF_2 = security(tickerid, TF_2_time, open) < security(tickerid, TF_2_time, close) ? true:false TF_2_color = TF_2 ? upcolor:downcolor TF_3 = security(tickerid, TF_3_time, open) < security(tickerid, TF_3_time, close) ? true:false TF_3_color = TF_3 ? upcolor:downcolor TF_4 = security(tickerid, TF_4_time, open) < security(tickerid, TF_4_time, close) ? true:false TF_4_color = TF_4 ? upcolor:downcolor TF_global = TF_1 and TF_2 and TF_3 and TF_4 TF_global_bear = TF_1 == false and TF_2 == false and TF_3 == false and TF_4 == false TF_global_color = TF_global ? green : TF_global_bear ? red : white TF_trigger_width = TF_global ? 6 : width plot(1, style=linestyle, linewidth=width, color=TF_1_color) plot(5, style=linestyle, linewidth=width, color=TF_2_color) plot(10, style=linestyle, linewidth=width, color=TF_3_color) plot(15, style=linestyle, linewidth=width, color=TF_4_color) plot(25, style=linestyle, linewidth=4, color=TF_global_color) exitCondition_Long = TF_global_bear exitCondition_Short = TF_global longCondition = TF_global if (longCondition) strategy.entry("MTF_Long", strategy.long) shortCondition = TF_global_bear if (shortCondition) strategy.entry("MTF_Short", strategy.short) strategy.close("MTF_Long", when=exitCondition_Long) strategy.close("MTF_Short", when=exitCondition_Short)Стратегия Pine Script®от marcoderoniОбновлено 1111249
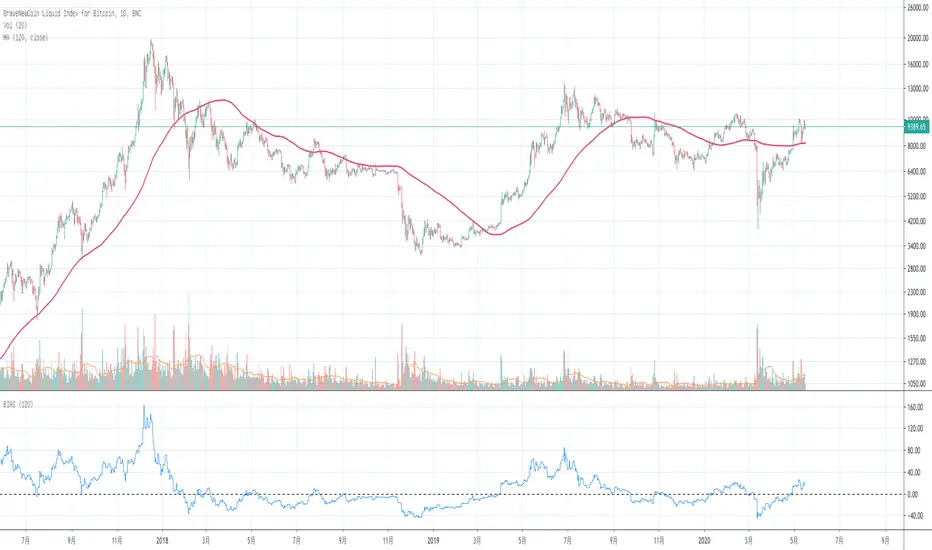
Basic BIASBasic BIAS Deviation rate (bias), also known as deviation rate, or y-value for short, is an indicator to reflect the deviation degree between the price and MA in a certain period of time by calculating the percentage difference between the market index or closing price and a moving average, so as to obtain the possibility that the price will reverse or rebound due to deviation from moving average trend in case of severe fluctuation, and that the price will move within the normal fluctuation range Form the credibility of continuing the original potential. The deviation rate is a percentage of the deviation degree (gap rate) between the price and ma. The departure rate curve (bias) is a curve that connects the values of each bias into a line and obtains a wave extension curve with the value of 0 as the horizontal axis.Индикатор Pine Script®от LinxuanAn11211
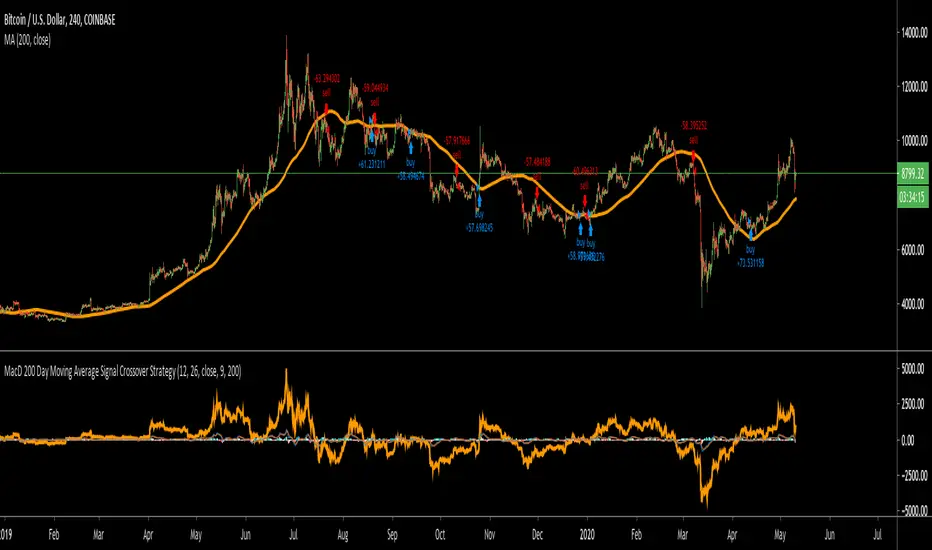
MacD 200 Day Moving Average Signal Crossover StrategyThis works on most time frames, but I noticed the 4 hour for BTCUSD on coinbase seems to work well as an example. The strategy is pretty simple. I was inspired by a youtube video that said to backtest their strategy so I did. Most of the time it doesn't work but sometimes it's pretty good as in the case I showed. Basically, you buy if the MacD crossers over the signal line and the histogram is below 0 and you are above the 200 day moving average. Do the opposite to sell!Стратегия Pine Script®от Gentleman-Goat1919404
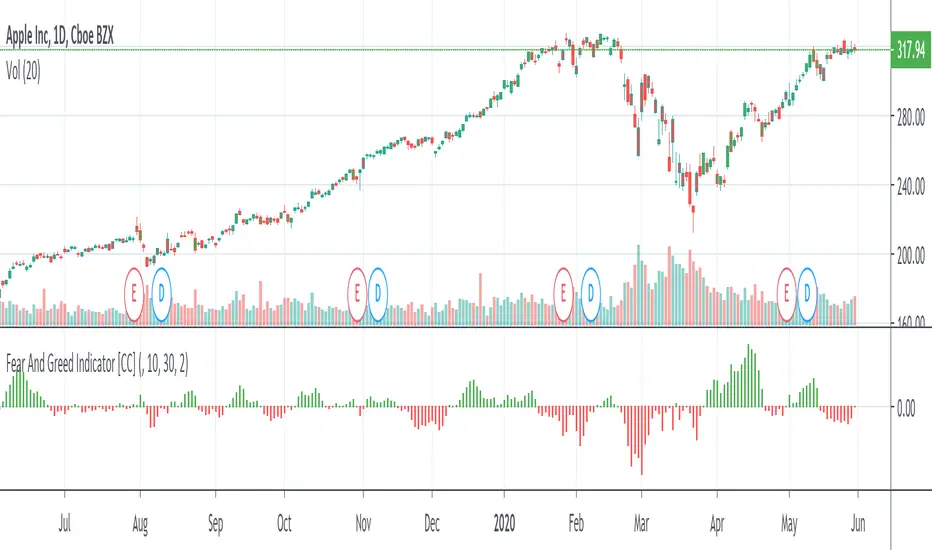
Fear And Greed IndicatorThe Fear And Greed Indicator is a very popular indicator on the Bloomberg platform and since I didn't have actual source code to work with, this is a very close approximation of that indicator. Let me know if you spot any discrepancies with the original and I will do my best to fix them. For buy and sell signals it is pretty straightforward. Just buy when the green (greed) is in control and sell when the fear (red) is in control This was a special request so let me know if you want to see more scripts from me or if you want something custom!Индикатор Pine Script®от cheatcountryОбновлено 2222 1.7 K
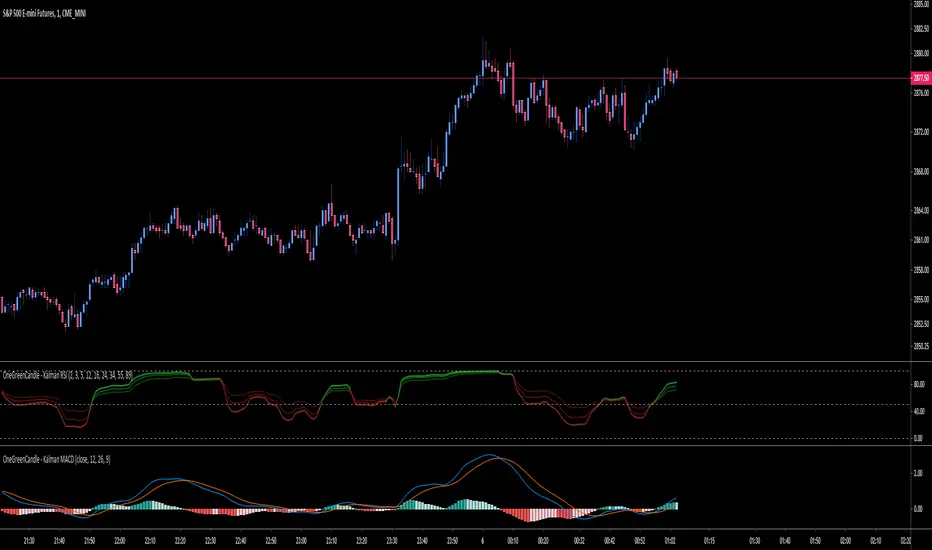
OneGreenCandle - Kalman MACDPrice smoothed by a Kalman filter to cutout noisy price.Индикатор Pine Script®от onegreencandleОбновлено 124
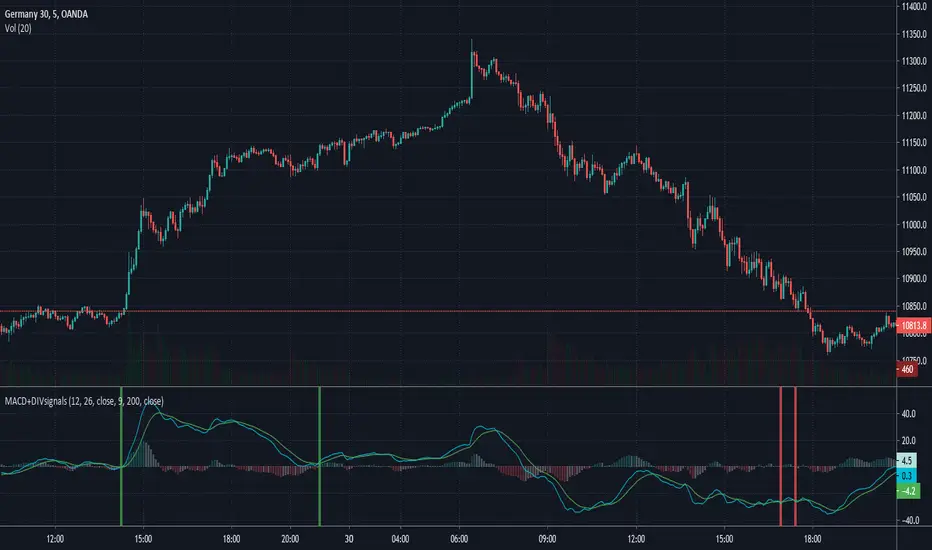
MACD with divergence signalsIts an MACD indicator which highlights places where macd and signal line cross and hidden divergence ocures. Logic behind it is to check if we have hidden divergence when crossing of that two lines and if above EMA200 (signal for BUY - green) or if below EMA200 (signal for SELL - red). You can change lenght of EMA but i think 200 is a simpliest trend indicator.Индикатор Pine Script®от Rexio1212468
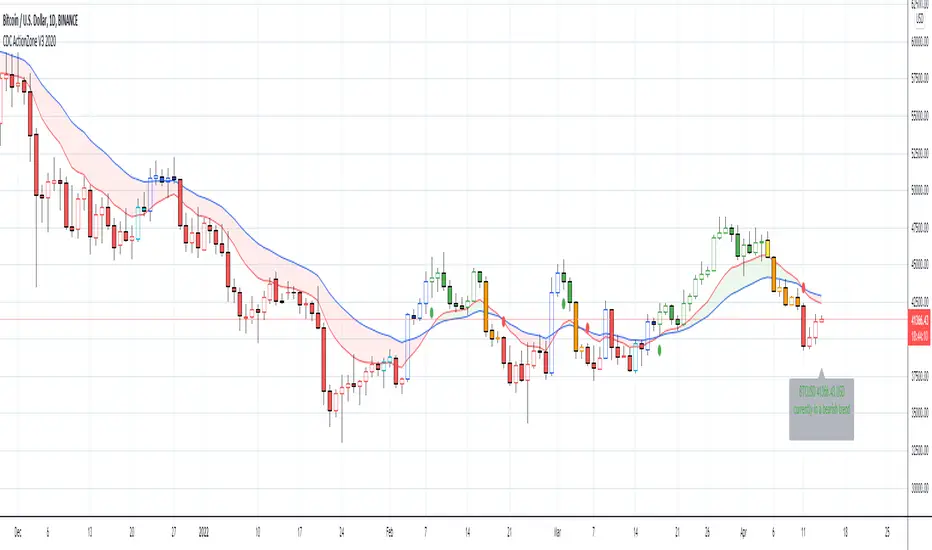
CDC ActionZone V3 2020## CDC ActionZone V3 2020 ## This is an update to my earlier script, CDC ActionZone V2 The two scripts works slightly differently with V3 reacting slightly faster. The main update is focused around conforming the standard to Pine Script V4. ## How it works ## ActionZone is a very simple system, utilizing just two exponential moving averages. The 'Zones' in which different 'actions' should be taken is highlighted with different colors on the chart. Calculations for the zones are based on the relative position of price to the two EMA lines and the relationship between the two EMAs CDCActionZone is your barebones basic, tried and true, trend following system that is very simple to follow and has also proven to be relatively safe. ## How to use ## The basic method for using ActionZone is to follow the green/red color. Buy when bar closes in green. Sell when bar closes in red. There is a small label to help with reading the buy and sell signal. Using it this way is safe but slow and is expected to have around 35-40% accuracy, while yielding around 2-3 profit factors. The system works best on larger time frames. The more advanced method uses the zones to switch between different trading system and biases, or in conjunction with other indicators. example 1: Buy when blue and Bullish Divergence between price and RSI is visible, if not Buy on Green and vise-versa example 2: Set up a long-biased grid and trade long only when actionzone is in green, yellow or orange. change the bias to short when actionzone turns to te bearish side (red, blue, aqua) (Look at colors on a larger time frame) ## Note ## The price field is set to close by default. change to either HL2 or OHLC4 when using the system in intraday timeframes or on market that does not close (ie. Cryptocurrencies) ## Note2 ## The fixed timeframe mode is for looking at the current signal on a larger time frame ie. When looking at charts on 1h you can turn on fixed time frame on 1D to see the current 'zone' on the daily chart plotted on to the hourly chart. This is useful if you wanted to use the system's 'Zones' in conjunction with other types of signals like Stochastic RSI, for example.Индикатор Pine Script®от piriya33Обновлено 6666 4.8 K
MACD crossover while RSI Oversold/OverboughtThis indicator draws signals on the chart when a Bullish MACD Crossover occurs at the same time RSI is "oversold", and also when Bearish MACD Crossover occurs at the same time RSI is "overbought" Indicators are drawn on the chart in the following scenarios: 1. Bullish signal a. MACD bullish crossover occurs on a single bar b. RSI was below the Oversold threshold (29 by default) within the prior 5 bars 2. Bearish signal a. MACD bearish crossover occurs on a singnle bar b. RSI was above the Overbought threshold (71 by default) within the prior 5 barsИндикатор Pine Script®от ericsolanОбновлено 2020 2.5 K
AverageTrueRangeConvergenceDivergenceV1sloth288Simple indicator with the thought of merging MACD and ATR. The idea has come from trying to find a way to define sideways markets. Whipped this up quickly to explore the idea. Feel free to throw in suggestions or even mention other open source indicators that define sideways markets well. Simple instructions If histogram green, breakouts/trade zone. If histogram red, sideways/keep out.Индикатор Pine Script®от sloth288101
Trend Checker by Hally - IndicatorIt is an indicator that overlaps MACD and Stochastics. It has both characteristics. The trend changes when two lines intersect. I think the reaction is bad in the range market. Also, when there are Stochastics and MACD lines above the indicator, it is possible to think whether it is overbought while riding the trend, and it may be helpful for making decisions such as "maybe it will reverse soon". Hmm. Also, I think it is better to use it in combination with other indicators. This is my first pine script, and I couldn't find it even if I searched for the script with overlapping indicators of different scales, so I tried making it by trial and error. I hope it helps somebody trying to do the same. MACDとStochasticsを重ね合わせたインジケーターです。 それぞれの特徴を併せ持っています。 2本のラインが交差する時トレンドが変化します。 レンジ相場では反応が悪いと思います。 また、インジケーターの上の位置にStochasticsとMACDラインがあるときはトレンドに乗りながらも買われすぎかどうか考えられることが出来ますし、「そろそろ反転するかも」などの判断の助けになるかもしれません。 また、他の指標との併用して使うほうが良いと思います。 pineスクリプトは初めてで、異なるスケールのインジケーターを重ね合わせていスクリプトは探しても見つからなかったので試行錯誤で作ってみました。 同じようなことをやろうとしてる誰かの参考になれば幸いです。Индикатор Pine Script®от Hally5150Обновлено 55112
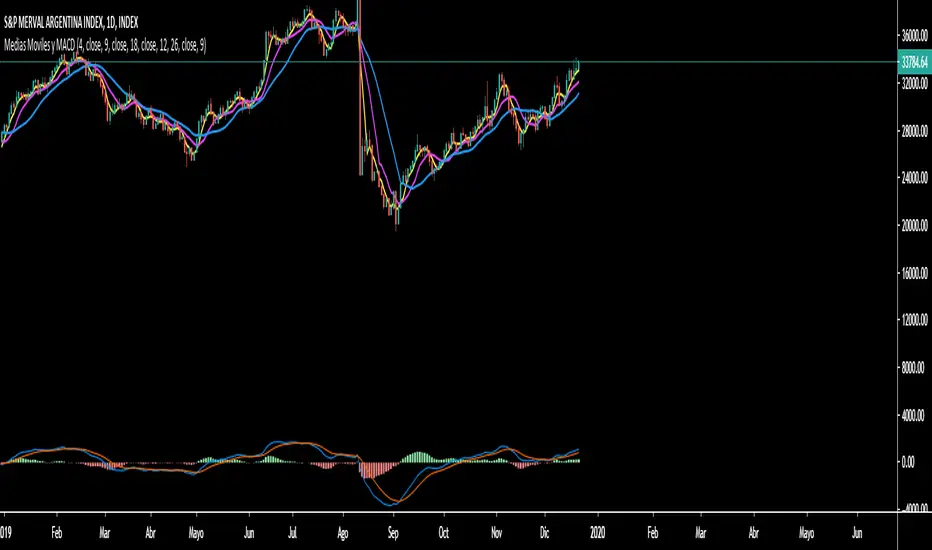
Simple Mobile Averages y MACDScript designed for users who need more than 3 indicators. It has 3 programmable "Simple Mobile Averages". MACD integrated in the main panel, also programmable.Индикатор Pine Script®от Milanesa135