High-Probability Scalper (Market Open)Market open is where volatility is real, spreads are tight, and momentum shows itself early. This scalping strategy is built specifically to operate during that window, filtering out low-quality signals that usually appear later in the session.
Instead of trading all day, the logic is restricted to the first 90 minutes after market open, where continuation moves and fast pullbacks are more reliable.
What This Strategy Does
This script looks for short-term momentum alignment using:
Fast vs slow EMA structure
RSI confirmation to avoid chasing extremes
ATR-based risk control
Session-based filtering to trade only when volume matters
It’s designed for intraday scalping, not swing trading.
Core Trading Logic
1. Market Open Filter
Trades are allowed only between 09:30 – 11:00 exchange time.
This avoids low-liquidity chop and focuses on the period where most breakouts and reversals form.
2. Trend Confirmation
Bullish bias: 9 EMA crosses above 21 EMA
Bearish bias: 9 EMA crosses below 21 EMA
This keeps trades aligned with short-term direction instead of random entries.
3. Momentum Check (RSI)
RSI is used as a quality filter, not as an overbought/oversold signal.
Long trades only when RSI is strong but not extended
Short trades only when RSI shows weakness without exhaustion
This removes late entries and reduces whipsaws.
Entries & Exits
Entries
Executed only on confirmed candles
No intrabar repainting
One position at a time
Risk Management
Stop-loss based on ATR
Take-profit calculated using a fixed risk–reward ratio
Same structure for both long and short trades
This keeps risk consistent across different symbols and volatility levels.
Why This Strategy Works Better at Market Open
Volume is highest
False breakouts are fewer
EMA crosses have follow-through
RSI behaves more cleanly
By not trading all day, the strategy avoids most of the noise that kills scalpers.
Best Use Cases
Index futures
High-liquidity stocks
Major crypto pairs during active sessions
1m to 5m timeframes
What This Strategy Is NOT
Not a martingale
Not grid-based
Not designed for ranging markets
Not a “set and forget” system
It’s a controlled scalping template meant for disciplined execution.
How to Use It Properly
Test on multiple symbols
Adjust ATR length for volatility
Tune RSI ranges per market
Always forward-test before live alerts
Final Note
This strategy focuses on structure, timing, and risk, not indicator stacking.
If you trade the open, this gives you a clear framework instead of emotional entries.
If you want:
Alerts
Session customization
News filters
Partial exits
You can extend this logic without breaking the core system.
Скользящие средние

Jack Dunn (Mean Reversion, Z-score + Vol Filter + Trend Filter))based on mean reversion and z score
FOR 1M XAUUSD or 5M USDJPY

A-Share Broad-Based ETF Dual-Core Timing System1. Strategy Overview
The "A-Share Broad-Based ETF Dual-Core Timing System" is a quantitative trading strategy tailored for the Chinese A-share market (specifically for broad-based ETFs like CSI 300, CSI 500, STAR 50). Recognizing the market's characteristic of "short bulls, long bears, and sharp bottoms," this strategy employs a "Left-Side Latency + Right-Side Full Position" dual-core driver. It aims to safely bottom-fish during the late stages of a bear market and maximize profits during the main ascending waves of a bull market.
2. Core Logic
A. Left-Side Latency (Rebound/Bottom Fishing)
Capital Allocation: Defaults to 50% position.
Philosophy: "Buy when others fear." Seeks opportunities in extreme panic or momentum divergence.
Entry Signals (Triggered by any of the following):
Extreme Panic: RSI Oversold (<30) + Price below Bollinger Lower Band + Bullish Candle Close (Avoid catching falling knives).
Oversold Bias: Price deviates more than 15% from the 60-day MA (Life Line), betting on mean reversion.
MACD Bullish Divergence: Price makes a new low while MACD histogram does not, accompanied by strengthening momentum.
B. Right-Side Full Position (Trend Following)
Capital Allocation: Aggressively scales up to Full Position (~99%) upon signal trigger.
Philosophy: "Follow the trend." Strike heavily once the trend is confirmed.
Entry Signals (All must be met):
Upward Trend: MACD Golden Cross + Price above 20-day MA.
Breakout Confirmation: CCI indicator breaks above 100, confirming a main ascending wave.
Volume Support: Volume MACD Golden Cross, ensuring price increase is backed by volume.
C. Smart Risk Control
Bear Market Exhaustion Exit: In a bearish trend (MA20 < MA60), the strategy does not "hold and hope." It immediately liquidates left-side positions upon signs of rebound exhaustion (breaking below MA20, touching MA60 resistance, or RSI failure).
ATR Trailing Stop: Uses Average True Range (ATR) to calculate a dynamic stop-profit line that rises with the price to lock in profits.
Hard Stop Loss: Forces a stop-loss if the left-side bottom fishing fails and losses exceed a set ATR multiple, preventing deep drawdowns.
3. Recommendations
Target Assets: High liquidity broad-based ETFs such as CSI 300 ETF (510300), CSI 500 ETF (510500), ChiNext ETF (159915), STAR 50 ETF (588000).
Timeframe: Daily Chart.

ZeroProfit_Trading_Inc - Black Asp Strategy V1.0WMA/RSI/MACD combined in one for a good lower (1/2 min) time frame chart, either follow the signals manually or automate the trades and relax. Has opening range as well as previous day/week/month high and lows.

[STRATEGY] Adaptive Multi Factor Trend Trading v1.1Daily Filters
Close vs. short/long daily SMAs (customizable) defines directional priority.
Use the daily Short Long MA spread (or ATR‑normalized) to filter out range‑bound conditions and reduce false breakouts.
30‑Minute Entry Logic
Buy
Daily bullish regime confirmed
High breaks above the trend
Protected by trailing take‑profit and fixed stop‑loss.
Sell #1
Daily bearish regime confirmed
Low breaks below the trend
Long MA slope must be strong (trend‑quality filter).
Sell #2
Day‑session only, limited to high‑probability hours
Triggered by an aggregated bear score (multi‑factor stack) + a downward linear‑regression slope
Friday uses special thresholds/intervals (event‑risk control).
Multi‑Factor Framework
MACD, RSI, Stoch (KD), Ichimoku, CCI, PSAR, Williams %R, Heikin Ashi, Bias, Force Index, plus regression‑slope.
Signals are stacked into bull/bear totals and used as filters or weights—no single indicator dominance.
Risk & Position Management
Fixed TP/SL + trailing TP across entry types
Position size adapts to recent performance (loss‑streak counter) and slope state
Auto pause when the loss streak hits the threshold (configurable duration).
Trading‑Day Controls
Optional pre‑holiday blackout list
Date‑range limiter for backtests or deployment windows.
Design Intent
The goal is to keep net P&L stable while lifting win rate.
In strong‑trend environments, the system leans into trend signals (Sell #1 / Buy).
In short‑term chop, Sell #2 timing and the slope filter reduce noise and avoid low‑quality entries.

Gold Adaptive Surfer v42 [huntamayung]Just a trend-following optimized for minimal risk and high grip onto trend. Try to use it as a signal in 1 minute timeframe. Note that this was optimized for OANDA:XAUUSD only.

Bollinger Reversal + Swing ExitBollinger Reversal + Swing Exit is a mean-reversion strategy designed to capture short-term reversals when price stretches to an extreme and then shows the first signs of rejection.
1. Core idea
This strategy assumes that sharp deviations from a central equilibrium are often followed by a corrective move back toward normal pricing. It does not chase trends. Instead, it waits for price to reach an extreme area and then looks for a controlled turn back in the opposite direction.
2. Signal concept
A setup starts only after price reaches an outer extreme zone. The trade is taken only if the market immediately shows a reversal-type reaction rather than continuing to push outward. This reduces entries that happen too early while the move is still accelerating.
3. Long and short behavior
Long trades are allowed only after a downside extreme has been reached and price begins to recover.
Short trades are allowed only after an upside extreme has been reached and price begins to fade.
The goal is to enter close enough to the extreme to keep risk contained, while still requiring evidence that the turn has started.
4. Risk control
Risk is defined tightly. The protective stop is placed where the reversal thesis is clearly invalidated, so the strategy is built to accept small losses when the market does not revert and continues expanding in the same direction.
5. Exit logic
Profits are taken based on local market structure rather than fixed targets. Once in a position, the strategy looks for a clear exhaustion point in the move and closes the trade when the short-term swing structure signals that the rebound or pullback has likely completed. This aims to capture the core of the corrective move without overstaying.
6. Best conditions
This approach performs best in range-bound markets, during consolidations, and in instruments that frequently oscillate around a fair value. It is also useful after impulsive spikes when the move becomes overstretched and liquidity rebalances.
7. When to avoid
Avoid using it during strong, clean trends and during persistent breakout phases, where extremes can keep extending and reversals can fail repeatedly. In these conditions, mean-reversion setups can be systematically punished.
8. What to expect
Expect a higher trade frequency than trend-following systems, with many small-to-medium wins and occasional sharp losses when the market refuses to revert. The edge comes from disciplined entries only after extremes and quick exits when structure signals completion.

EMA Trend Following Strategy🎯 EMA TREND FOLLOWING STRATEGY
A simple yet powerful trend-following strategy designed for 1-hour timeframes across multiple markets including cryptocurrencies, commodities, indices, and forex pairs.
📊 STRATEGY LOGIC
This strategy is based on the classic moving average crossover technique, one of the most reliable trend-following methods in technical analysis:
- LONG ENTRIES: When the fast EMA crosses above the slow EMA, indicating the beginning of an uptrend
- SHORT ENTRIES: When the fast EMA crosses below the slow EMA, indicating the beginning of a downtrend
- EXITS: Positions are closed when the opposite crossover occurs, capturing the trend reversal
🛡️ RISK MANAGEMENT
The strategy includes professional risk management features:
- Dynamic stop-loss based on market volatility
- Automatic position sizing to risk only a fixed percentage per trade
- Optional take-profit levels for securing gains
- Customizable risk parameters to fit your trading style
⚙️ RECOMMENDED SETTINGS
- Timeframe: 1 Hour (H1)
- Fast EMA: 20 periods
- Slow EMA: 50 periods
- Risk per trade: 1-2% of capital
- Stop-loss: 2x ATR (Average True Range)
💡 BEST USE CASES
This strategy works particularly well on:
✅ BTC/USD and major cryptocurrencies
✅ GOLD and precious metals
✅ S&P 500, NASDAQ, and major indices
✅ EUR/USD, GBP/USD and major forex pairs
⚠️ IMPORTANT NOTES
- Always backtest on your specific market before live trading
- Past performance does not guarantee future results
- Use appropriate position sizing and never risk more than you can afford to lose
- This strategy works best in trending markets
📈 Perfect for swing traders and those looking for a systematic approach to capture market trends!

CryptoFlux Dynamo [JOAT]CryptoFlux Dynamo: Velocity Scalping Strategy
This Pine Script v6 strategy is designed for cryptocurrency markets operating on 5-minute and faster timeframes. It combines volatility regime detection, multi-path signal confirmation, and adaptive risk management to identify momentum-based trading opportunities in perpetual futures markets.
Core Design Principles
The strategy addresses three challenges specific to cryptocurrency trading:
24/7 market operation without session boundaries requires continuous monitoring and execution logic
Volatility regimes shift rapidly, demanding adaptive stop and target calculations
Tick-level responsiveness is critical for capturing momentum moves before they complete
Strategy Architecture
1. Signal Generation Stack
The strategy uses multiple technical indicators calibrated for cryptocurrency momentum:
MACD with parameters 8/21/5 (fast/slow/signal) optimized for crypto acceleration phases
EMA ribbon using 8/21/34 periods with slope analysis to assess trend structure
Volume impulse detection combining SMA baseline, standard deviation, and z-score filtering
RSI (21 period) and MFI (21 period) for momentum confirmation
Bollinger Bands and Keltner Channels for squeeze detection
2. Volatility Regime Classification
The strategy normalizes ATR as a percentage of price and classifies market conditions into three regimes:
Compression (< 0.8% ATR): Reduced position sizing, tighter stops (1.05x ATR), lower profit targets (1.6x ATR)
Expansion (0.8% - 1.6% ATR): Standard risk parameters, balanced risk-reward (1.55x stop, 2.05x target)
Velocity (> 1.6% ATR): Wider stops (2.1x ATR), amplified targets (2.8x ATR), tighter trailing offsets
ATR is calculated over 21 periods and smoothed with a 13-period EMA to reduce noise from wicks.
3. Multi-Path Entry System
Four independent signal pathways contribute to a composite strength score (0-100):
Trend Break (30 points): Requires EMA ribbon alignment, positive slope, and structure breakout above/below recent highs/lows
Momentum Surge (30 points): MACD histogram exceeds adaptive baseline, MACD line crosses signal, RSI/MFI above/below thresholds, with volume impulse confirmation
Squeeze Release (25 points): Bollinger Bands compress inside Keltner Channels, then release with momentum bias
Micro Pullback (15 points): Shallow retracements within trend structure that reset without breaking support/resistance
Additional scoring modifiers:
Volume impulse: +5 points when present, -5 when absent
Regime bonus: +5 in velocity, -2 in compression
Cycle bias: +5 when aligned, -5 when counter-trend
Trades only execute when the composite score reaches the minimum threshold (default: 55) and all filters agree.
4. Risk Management Framework
Position sizing is calculated from:
RiskCapital = Equity × (riskPerTradePct / 100)
StopDistance = ATR × StopMultiplier(regime)
Quantity = min(RiskCapital / StopDistance, MaxExposure / Price)
The strategy includes:
Risk per trade: 0.65% of equity (configurable)
Maximum exposure: 12% of equity (configurable)
Regime-adaptive stop and target multipliers
Adaptive trailing stops based on ATR and regime
Kill switch that disables new entries after 6.5% drawdown
Momentum fail-safe exits when MACD polarity flips or ribbon structure breaks
5. Additional Filters
Cycle Oscillator : Measures price deviation from 55-period EMA. Requires cycle bias alignment (default: ±0.15%) before entry
BTC Dominance Filter : Optional filter using CRYPTOCAP:BTC.D to reduce long entries during risk-off periods (rising dominance) and short entries during risk-on periods
Session Filter : Optional time-based restriction (disabled by default for 24/7 operation)
Strategy Parameters
All default values used in backtesting:
Core Controls
Enable Short Structure: true
Restrict to Session Window: false
Execution Session: 0000-2359:1234567 (24/7)
Allow Same-Bar Re-Entry: true
Optimization Constants
MACD Fast Length: 8
MACD Slow Length: 21
MACD Signal Length: 5
EMA Fast: 8
EMA Mid: 21
EMA Slow: 34
EMA Slope Lookback: 8
Structure Break Window: 9
Regime Intelligence
ATR Length: 21
Volatility Soothing: 13
Low Vol Regime Threshold: 0.8% ATR
High Vol Regime Threshold: 1.6% ATR
Cycle Bias Length: 55
Cycle Bias Threshold: 0.15%
BTC Dominance Feed: CRYPTOCAP:BTC.D
BTC Dominance Confirmation: true
Signal Pathways
Volume Baseline Length: 34
Volume Impulse Multiplier: 1.15
Volume Z-Score Threshold: 0.5
MACD Histogram Smoothing: 5
MACD Histogram Sensitivity: 1.15
RSI Length: 21
RSI Momentum Trigger: 55
MFI Length: 21
MFI Momentum Trigger: 55
Squeeze Length: 20
Bollinger Multiplier: 1.5
Keltner Multiplier: 1.8
Squeeze Release Momentum Gate: 1.0
Micro Pullback Depth: 7
Minimum Composite Signal Strength: 55
Risk Architecture
Risk Allocation per Trade: 0.65%
Max Exposure: 12% of Equity
Base Risk/Reward Anchor: 1.8
Stop Multiplier • Low Regime: 1.05
Stop Multiplier • Medium Regime: 1.55
Stop Multiplier • High Regime: 2.1
Take Profit Multiplier • Low Regime: 1.6
Take Profit Multiplier • Medium Regime: 2.05
Take Profit Multiplier • High Regime: 2.8
Adaptive Trailing Engine: true
Trailing Offset Multiplier: 0.9
Quantity Granularity: 0.001
Kill Switch Drawdown: 6.5%
Strategy Settings
Initial Capital: $100,000
Commission: 0.04% (0.04 commission_value)
Slippage: 1 tick
Pyramiding: 1 (no position stacking)
calc_on_every_tick: true
calc_on_order_fills: true
Visualization Features
The strategy includes:
EMA ribbon overlay (8/21/34) with customizable colors
Regime-tinted background (compression: indigo, expansion: purple, velocity: magenta)
Dynamic bar coloring based on signal strength divergence
Signal labels for entry points
On-chart dashboard displaying regime, ATR%, signal strength, position status, stops, targets, and risk metrics
Recommended Usage
Timeframes
The strategy is optimized for 5-minute charts. It can operate on 3-minute and 1-minute timeframes for faster scalping, or 15-minute for swing confirmation. When using higher timeframes, consider:
Increasing structure lookback windows
Raising RSI trigger thresholds above 58 to filter noise
Extending volume baseline length
Markets
Designed for high-liquidity cryptocurrency perpetual futures:
BTC/USDT, BTC/USD perpetuals
ETH perpetuals
Major L1 tokens with sufficient volume
For thinner order books, increase volume impulse multiplier and adjust quantity granularity to match exchange minimums.
Limitations and Compromises
Backtesting Considerations
TradingView strategy backtesting does not replicate broker execution. Actual fills, slippage, and commissions may differ
The strategy uses calc_on_every_tick=true and calc_on_order_fills=true to reduce bar-close distortions, but real execution still depends on broker infrastructure
At least 200 historical bars are required to stabilize regime classification, volume baselines, and cycle context
Market Structure Dependencies
BTC dominance feed ( CRYPTOCAP:BTC.D ) may lag during low-liquidity periods or weekends. Consider disabling the filter if data quality degrades
Volume impulse detection assumes consistent order book depth. During extreme volatility or exchange issues, volume signatures may be unreliable
Regime classification based on ATR percentage assumes normal volatility distributions. During black swan events, regime thresholds may not adapt quickly enough
Parameter Sensitivity
Default parameters are tuned for BTC/ETH perpetuals on 5-minute charts. Different assets or timeframes require recalibration
The composite signal strength threshold (55) balances selectivity vs. opportunity. Higher values reduce false signals but may miss valid setups
Risk per trade (0.65%) and max exposure (12%) are conservative defaults. Aggressive scaling increases drawdown risk
Execution Constraints
Same-bar re-entry requires broker support for rapid order placement
Quantity granularity must match exchange contract minimums
Kill switch drawdown (6.5%) may trigger during normal volatility cycles, requiring manual reset
Performance Expectations
This strategy is a framework for momentum-based cryptocurrency trading. Performance depends on:
Market conditions (trending vs. ranging)
Exchange execution quality
Parameter calibration for specific assets
Risk management discipline
Backtest results shown in publications reflect specific market conditions and parameter sets. Past performance does not indicate future results. Always forward test with paper trading or broker simulation before deploying live capital.
Code Structure
The strategy is organized into functional sections:
Configuration groups for parameter organization
Helper functions for position sizing and normalization
Core indicator calculations (MACD, EMA, ATR, RSI, MFI, volume analytics)
Regime classification logic
Multi-path signal generation and composite scoring
Entry/exit orchestration with risk management
Visualization layer with dashboard and chart elements
The source code is open and can be modified to suit your trading requirements. Everyone is encouraged to understand the logic before deploying and to test thoroughly in their target markets.
Modification Guidelines
When adapting this strategy:
Document any parameter changes in your publication
Test modifications across different market regimes
Validate position sizing logic for your exchange's contract specifications
Consider exchange-specific limitations (funding rates, liquidation mechanics, order types)
Conclusion
This strategy provides a structured approach to cryptocurrency momentum trading with regime awareness and adaptive risk controls. It is not a guaranteed profit system, but rather a framework that requires understanding, testing, and ongoing calibration to market conditions.
You should thoroughly understand the logic, test extensively in their target markets, and manage risk appropriately. The strategy's effectiveness depends on proper parameter tuning, reliable execution infrastructure, and disciplined risk management.
Disclaimer
This script and its documentation are for educational and informational purposes only. They do not constitute financial advice, investment recommendations, or trading advice of any kind. Trading cryptocurrencies and derivatives involves substantial risk of loss and is not suitable for all investors. Past performance, whether real or indicated by backtesting, does not guarantee future results.
This strategy is provided "as is" without any warranties or guarantees of profitability
You should not rely solely on this strategy for making trading decisions
Always conduct your own research and analysis before making any financial decisions
Consider consulting with a qualified financial advisor before engaging in trading activities
The authors and contributors are not responsible for any losses incurred from using this strategy
Cryptocurrency trading can result in the loss of your entire investment
Only trade with capital you can afford to lose
Use this strategy at your own risk. The responsibility for any trading decisions and their consequences lies entirely with you.

Adoptive Conditional range High/Low MA Crossover StrategyDeveloped from the doctoral research of Abu-Kadunagra at ****** University's in Australia, this strategy implements a "Campaign-Based Adaptive Execution" framework. It moves beyond simple entries and exits by treating each market engagement as a multi-phase campaign with distinct operational states. The system intelligently identifies cyclical turning points, then employs a feedback-driven approach to capital allocation—reinforcing successful momentum with pyramiding while deploying controlled defensive averaging during temporary setbacks. By anchoring its exit mechanism to dynamically updated market structure rather than static profit targets, the algorithm seeks to capture cyclical momentum while maintaining disciplined risk parameters. This research-driven approach represents an evolution toward state-aware algorithmic systems that adapt their tactics in real-time based on market phase recognition.

Conditional-range High/Low adoptive-MA Crossover StrategyDeveloped from the doctoral research of Abu-Kadunagra at ****** University on topic of Digital Finance and Crypto in Australia, this strategy implements a "Campaign-Based Adaptive Execution" framework. It moves beyond simple entries and exits by treating each market engagement as a multi-phase campaign with distinct operational states. The system intelligently identifies cyclical turning points, then employs a feedback-driven approach to capital allocation—reinforcing successful momentum with pyramiding while deploying controlled defensive averaging during temporary setbacks. By anchoring its exit mechanism to dynamically updated market structure rather than static profit targets, the algorithm seeks to capture cyclical momentum while maintaining disciplined risk parameters. This research-driven approach represents an evolution toward state-aware algorithmic systems that adapt their tactics in real-time based on market phase recognition.

Liquidity Maxing [JOAT]Liquidity Maxing - Institutional Liquidity Matrix
Introduction
Liquidity Maxing is an open-source strategy for TradingView built around institutional market structure concepts. It identifies structural shifts, evaluates trades through multi-factor confluence, and implements layered risk controls.
The strategy is designed for swing trading on 4-hour timeframes, focusing on how institutional order flow manifests in price action through structure breaks, inducements, and liquidity sweeps.
Core Functionality
Liquidity Maxing performs three primary functions:
Tracks market structure to identify when control shifts between buyers and sellers
Scores potential trades using an eight-factor confluence system
Manages position sizing and risk exposure dynamically based on volatility and user-defined limits
The goal is selective trading when multiple conditions align, rather than frequent entries.
Market Structure Engine
The structure engine tracks three key events:
Break of Structure (BOS): Price pushes beyond a prior pivot in the direction of trend
Change of Character (CHoCH): Control flips from bullish to bearish or vice versa
Inducement Sweeps (IDM): Market briefly runs stops against trend before moving in the real direction
The structure module continuously updates strong highs and lows, labeling structural shifts visually. IDM markers are optional and disabled by default to maintain chart clarity.
The trade engine requires valid structure alignment before considering entries. No structure, no trade.
Eight-Factor Confluence System
Instead of relying on a single indicator, Liquidity Maxing uses an eight-factor scoring system:
Structure alignment with current trend
RSI within healthy bands (different ranges for up and down trends)
MACD momentum agreement with direction
Volume above adaptive baseline
Price relative to main trend EMA
Session and weekend filter (configurable)
Volatility expansion/contraction via ATR shifts
Higher-timeframe EMA confirmation
Each factor contributes one point to the confluence score. The default minimum confluence threshold is 6 out of 8, but you can adjust this from 1-8 based on your preference for trade frequency versus selectivity.
Only when structure and confluence agree does the strategy proceed to risk evaluation.
Dynamic Risk Management
Risk controls are implemented in multiple layers:
ATR-based stops and targets with configurable risk-to-reward ratio (default 2:1)
Volatility-adjusted position sizing to maintain consistent risk per trade as ranges expand or compress
Daily and weekly risk budgets that halt new entries once thresholds are reached
Correlation cooldown to prevent clustered trades in the same direction
Global circuit breaker with maximum drawdown limit and emergency kill switch
If any guardrail is breached, the strategy will not open new positions. The dashboard clearly displays risk state for transparency.
Market Presets
The strategy includes configuration presets optimized for different market types:
Crypto (BTC/ETH): RSI bands 70/30, volume multiplier 1.2, enhanced ATR scaling
Forex Majors: RSI bands 75/25, volume multiplier 1.5
Indices (SPY/QQQ): RSI bands 70/30, volume multiplier 1.3
Custom: Default values for user customization
For crypto assets, the strategy automatically applies ATR volatility scaling to account for higher volatility characteristics.
Monitoring and Dashboards
The strategy includes optional monitoring layers:
Risk Operations Dashboard (top-right):
Trend state
Confluence score
ATR value
Current position size percentage
Global drawdown
Daily and weekly risk consumption
Correlation guard state
Alert mode status
Performance Console (top-left):
Net profit
Current equity
Win rate percentage
Average trade value
Sharpe-style ratio (rolling 50-bar window)
Profit factor
Open trade count
Optional risk tint on chart background provides visual indication of "safe to trade" versus "halted" state.
All visualization elements can be toggled on/off from the inputs for clean chart viewing or full telemetry during parameter tuning.
Alerts and Automation
The strategy supports alert integration with two formats:
Standard alerts: Human-readable messages for long, short, and risk-halt conditions
Webhook format: JSON-formatted payloads ready for external execution systems (optional)
Alert messages are predictable and unambiguous, suitable for manual review or automated forwarding to execution engines.
Built-in Validation Suite
The strategy includes an optional validation layer that can be enabled from inputs. It checks:
Internal consistency of structure and confluence metrics
Sanity and ordering of risk parameters
Position sizing compliance with user-defined floors and caps
This validation is optional and not required for trading, but provides transparency into system operation during development or troubleshooting.
Strategy Parameters
Market Presets:
Configuration Preset: Choose between Crypto (BTC/ETH), Forex Majors, Indices (SPY/QQQ), or Custom
Market Structure Architecture:
Pivot Length: Default 5 bars
Filter by Inducement (IDM): Default enabled
Visualize Structure: Default enabled
Structure Lookback: Default 50 bars
Risk & Capital Preservation:
Risk:Reward Ratio: Default 2.0
ATR Period: Default 14
ATR Multiplier (Stop): Default 2.0
Max Drawdown Circuit Breaker: Default 10%
Risk per Trade (% Equity): Default 1.5%
Daily Risk Limit: Default 6%
Weekly Risk Limit: Default 12%
Min Position Size (% Equity): Default 0.25%
Max Position Size (% Equity): Default 5%
Correlation Cooldown (bars): Default 3
Emergency Kill Switch: Default disabled
Signal Confluence:
RSI Length: Default 14
Trend EMA: Default 200
HTF Confirmation TF: Default Daily
Allow Weekend Trading: Default enabled
Minimum Confluence Score (0-8): Default 6
Backtesting Considerations
When backtesting this strategy, consider the following:
Commission: Default 0.05% (adjustable in strategy settings)
Initial Capital: Default $100,000 (adjustable)
Position Sizing: Uses percentage of equity (default 2% per trade)
Timeframe: Optimized for 4-hour charts, though can be tested on other timeframes
Results will vary significantly based on:
Market conditions and volatility regimes
Parameter settings, especially confluence threshold
Risk limit configuration
Symbol characteristics (crypto vs forex vs equities)
Past performance does not guarantee future results. Win rate, profit factor, and other metrics should be evaluated in context of drawdown periods, trade frequency, and market conditions.
How to Use This Strategy
This is a framework that requires understanding and parameter tuning, not a one-size-fits-all solution.
Recommended workflow:
Start on 4-hour timeframe with default parameters and appropriate market preset
Run backtests and study performance console metrics: focus on drawdown behavior, win rate, profit factor, and trade frequency
Adjust confluence threshold to match your risk appetite—higher thresholds mean fewer but more selective trades
Set realistic daily and weekly risk budgets appropriate for your account size and risk tolerance
Consider ATR multiplier adjustments based on market volatility characteristics
Only connect alerts or automation after thorough testing and parameter validation
Treat this as a risk framework with an integrated entry engine, not merely an entry signal generator. The risk controls are as important as the trade signals.
Strategy Limitations
Designed for swing trading timeframes; may not perform optimally on very short timeframes
Requires sufficient market structure to identify pivots; may struggle in choppy or low-volatility environments
Crypto markets require different parameter tuning than traditional markets
Risk limits may prevent entries during favorable setups if daily/weekly budgets are exhausted
Correlation cooldown may delay entries that would otherwise be valid
Backtesting results depend on data quality and may not reflect live trading with slippage
Design Philosophy
Many indicators tell you when price crossed a moving average or RSI left oversold. This strategy addresses questions institutional traders ask:
Who is in control of the market right now?
Is this move structurally significant or just noise?
Do I want to add more risk given what I've already done today/week?
If I'm wrong, exactly how painful can this be?
The strategy provides disciplined, repeatable answers to these questions through systematic structure analysis, confluence filtering, and multi-layer risk management.
Technical Implementation
The strategy uses Pine Script v6 with:
Custom types for structure, confluence, and risk state management
Functional programming approach for reusable calculations
State management through persistent variables
Optional visual elements that can be toggled independently
The code is open-source and can be modified to suit individual needs. All important logic is visible in the source code.
Disclaimer
This script is provided for educational and informational purposes only. It is not intended as financial, investment, trading, or any other type of advice or recommendation. Trading involves substantial risk of loss and is not suitable for all investors. Past performance, whether real or indicated by historical tests of strategies, is not indicative of future results.
No representation is being made that any account will or is likely to achieve profits or losses similar to those shown. In fact, there are frequently sharp differences between backtested results and actual results subsequently achieved by any particular trading strategy.
The user should be aware of the risks involved in trading and should trade only with risk capital. The authors and publishers of this script are not responsible for any losses or damages, including without limitation, any loss of profit, which may arise directly or indirectly from use of or reliance on this script.
This strategy uses technical analysis methods and indicators that are not guaranteed to be accurate or profitable. Market conditions change, and strategies that worked in the past may not work in the future. Users should thoroughly test any strategy in a paper trading environment before risking real capital.
Commission and slippage settings in backtests may not accurately reflect live trading conditions. Real trading results will vary based on execution quality, market liquidity, and other factors not captured in backtesting.
The user assumes full responsibility for all trading decisions made using this script. Always consult with a qualified financial advisor before making investment decisions.
Enjoy - officialjackofalltrades

EMA and Dow Theory Strategies V2📘 Overview
This strategy is an advanced evolution of the original EMA × Dow Theory hybrid model. V2 introduces true swing‑based trend detection, gradient trend‑zones, higher‑timeframe swing overlays, and dynamic exit logic designed for intraday to short‑term trading across crypto, forex, stocks, and indices.
The system provides precise entries, adaptive exits, and highly visual guidance that helps traders understand trend structure at a glance.
🧠 Key Features
🔹 1. Dual‑EMA Trend Logic (Symbol + External Index)
Both the chart symbol and an external index (OTHERS.D) are evaluated using fast/slow EMAs to determine correlation‑based trend bias.
🔹 2. Dow Theory Swing Detection (Real‑time)
The script identifies swing highs/lows and updates trend direction when price breaks them. This creates a structural trend model that reacts faster than EMAs alone.
🔹 3. Gradient Trend Zones (Visual Trend Strength)
When trend is up or down, the area between price and the latest swing level is filled with a multi‑step gradient. This makes trend strength and distance-to-structure visually intuitive.
🔹 4. Higher‑Timeframe Swing Trend (htfTrend)
Swing highs/lows from a higher timeframe (e.g., 4H) are plotted to show macro structure. Used only for visual context, not for filtering entries.
🔹 5. RSI‑Based Entry Protection
RSI prevents entries during extreme overbought/oversold conditions.
🔹 6. Dynamic Exit System
Includes:
Custom stop‑loss (%)
Partial take‑profit (TP1/TP2/TP3)
Automatic scale‑out when trend color weakens
“Color‑change lockout” to prevent immediate re‑entry
Real‑time PnL tracking and labels
🔹 7. Alerts for All Key Events
Entry, stop‑loss, partial exits, and trend‑change exits all generate structured JSON alerts.
🔹 8. Visual PnL Labels & Equity Tracking
PnL for the latest trade is displayed directly on the chart, including scale‑out adjustments.
⚙️ Input Parameters
Parameter Description
Fast EMA / Slow EMA EMAs used for symbol trend detection
Index Fast / Slow EMA EMAs applied to external index
StopLoss (%) Custom stop‑loss threshold
Scale‑Out % Portion to exit when trend color weakens
RSI Period / Levels Overbought/oversold filters
Swing Detection Length Bars used to detect swing highs/lows
Stats Display Position of statistics table
🧭 About htfTrend (Higher Timeframe Trend)
The higher‑timeframe swing trend is displayed visually but not used for entry logic.
Why? Strict HTF filtering reduces trade frequency and often removes profitable setups. By keeping it visual‑only, traders retain flexibility while still benefiting from macro structure awareness.
Use it as a contextual guide, not a constraint.
📘 概要
本ストラテジーは、V1 を大幅に拡張した EMA × ダウ理論 × スイング構造 × 上位足トレンド可視化 の複合型モデルです。 短期〜デイトレード向けに最適化されており、仮想通貨・FX・株式・指数など幅広いアセットで利用できます。
V2 では、スイング構造の自動検出、グラデーションによるトレンド強度の可視化、上位足スイングライン、動的な利確/損切りロジック が追加され、視覚的にもロジック的にも大幅に強化されています。
🧠 主な機能
🔹 1. 銘柄+外部インデックスの EMA クロス判定
対象銘柄と OTHERS.D の EMA を比較し、相関を考慮したトレンド方向を判定します。
🔹 2. ダウ理論に基づくスイング高値・安値の自動検出
スイング更新によりトレンド方向を切り替える、構造ベースのトレンド判定を採用。
🔹 3. グラデーション背景によるトレンド強度の可視化
スイングラインから現在価格までを段階的に塗り分け、 「どれだけトレンドが伸びているか」を直感的に把握できます。
🔹 4. 上位足スイングトレンド(htfTrend)の表示
4H などの上位足でのスイング高値・安値を表示し、 大局的なトレンド構造を視覚的に把握できます(ロジックには未使用)。
🔹 5. RSI による過熱・売られすぎフィルター
極端な RSI 状態でのエントリーを防止。
🔹 6. 動的イグジットシステム
カスタム損切り(%)
TP1/TP2/TP3 の段階的利確
トレンド色の弱まりによる自動スケールアウト
色変化後の再エントリー制限(waitForColorChange)
リアルタイム PnL の追跡とラベル表示
🔹 7. アラート完備(JSON 形式)
エントリー、損切り、部分利確、トレンド反転などすべてに対応。
🔹 8. 損益ラベル・統計表示
直近トレードの損益をチャート上に表示し、視覚的に把握できます。
⚙️ 設定項目
設定項目名 説明
Fast / Slow EMA 銘柄の EMA 設定
Index Fast / Slow EMA 外部インデックスの EMA 設定
損切り(%) カスタム損切りライン
部分利確割合 トレンド弱化時のスケールアウト割合
RSI 期間・水準 過熱/売られすぎフィルター
スイング検出期間 スイング高値・安値の検出に使用
統計表示位置 テーブルの表示位置
🧭 上位足トレンド(htfTrend)について
上位足スイングの更新に基づくトレンド判定を表示しますが、 エントリー条件には使用していません。
理由: 上位足を厳密にロジックへ組み込むと、トレード機会が大幅に減るためです。
本ストラテジーでは、 「大局の把握は視覚で、エントリーは柔軟に」 という設計思想を採用しています。
→ 裁量で利確判断や逆張り回避に活用できます。

Kairos MA Strategy [Personal Version] BHow it Works:
Trend Definition: Uses a Fast MA (e.g., SMA 10) and a Slow MA (e.g., SMA 11).
Uptrend: Fast MA > Slow MA.
Downtrend: Fast MA < Slow MA.
Entry Trigger: The price must retrace to touch the Fast MA.
Validation: The pullback is validated by ATR limits to ensure the price hasn't wicked or closed too far past the MA (preventing "catching a falling knife").
Filters:
Slope Filter: Ensures the MAs have a steep enough angle to avoid trading during flat/choppy markets.
Volatility: Checks VIX (maximum fear) and ATR (minimum movement) to ensure safe market conditions.
Confluence: Optional checks from oscillators like RSI, Stochastic, CCI, etc.
Exits:
Fixed Targets: Uses a defined Take Profit and Stop Loss in points.
No Trade Zone (NTZ): A specific time window that forces all active trades to close (e.g., to avoid holding overnight).
Unique Features:
Custom Dashboard: Displays real-time win rates, streaks, and a "Strategy Grade" directly on the chart.
Dual-Engine: Runs as both a visual indicator (with custom labels) and a backtestable strategy simultaneously.

FluxMA ProFluxMA Pro
FluxMA Pro is an intraday trend-following strategy based on moving-average cross signals , with built-in execution filters (time window + weekdays), direction control, and an optional strict one-trade-per-day rule.
The system enters when price crosses the selected moving average, and manages risk using fixed SL/TP in ticks . For clarity and auditing, it plots the MA and draws risk (SL) / reward (TP) zones on the chart.
This script is published for educational and research purposes , with documented mechanics and replication settings to support transparency and reproducibility.
How the strategy works
Signal engine (MA cross)
A base Moving Average (MA) is computed from a selectable price source.
A Long signal triggers when price crosses above the MA.
A Short signal triggers when price crosses below the MA.
Execution filters
Time filter : trades only inside the configured window (supports overnight windows correctly).
Weekday filter : enable/disable trading by day (Mon–Sun).
Direction filter : run Long only , Short only , or Both .
One trade per day (optional) : if enabled, once a trade is placed, no new trades are allowed until the next daily reset.
Risk management (ticks)
Stop-loss and take-profit are set using fixed distances in ticks from entry.
Orders are placed with a stop and a limit exit to keep execution auditable.
Visual audit layer
Plots the Moving Average on the chart.
Draws SL/TP zones as boxes that extend while the position is open.
Adds entry labels (“buy” / “sell”) for quick review in replays and optimizations.
Visual features
MA plot with selectable MA type (SMA/EMA/WMA/RMA) and length.
Risk/Reward boxes projected from entry (SL zone + TP zone).
Entry labels with configurable styling (label/flag) and colors.
Settings used for the published backtest (replication)
The performance screenshots included with this publication were generated using the following configuration:
Market & chart
Symbol : XAUUSD (FXCM feed)
Timeframe : 15 minutes
Date range : 02 Jan 2025 → 07 Nov 2025
Inputs (Strategy settings)
Source : Close
MA type : SMA
MA length : 10
Stop Loss : 1400 ticks
Take Profit : 2000 ticks
Time filter : enabled — 06:00 to 22:15 (exchange time)
Weekday filter : enabled — Monday to Sunday enabled
Direction : Long only
One trade per day : enabled
TradingView Strategy Properties used
Initial capital : 1,000 USD
Commission : 0.2 (as set in Strategy Properties)
Slippage : 1 tick
Backtest snapshot (as shown)
Net Profit : +727.41 USD (+72.74%)
Max Drawdown : 200.25 USD (12.71%)
Total Trades : 218
Win Rate : 52.29% (114 / 218)
Profit Factor : 1.485
Backtest context and limitations
Stop/limit fills may occur intrabar depending on TradingView’s execution model and bar magnifier assumptions.
Results vary by symbol, timeframe, broker feed, spreads, commissions, slippage, and session selection.
Past performance does not guarantee future results.
This script is not financial advice.
Originality and usefulness
While MA-cross strategies are a known concept, FluxMA Pro focuses on an execution-grade implementation designed for testing and disciplined deployment:
Execution guardrails : optional one-trade-per-day lock + direction filter to prevent over-trading and strategy drift.
Session handling done properly : time windows support overnight logic (no “broken window” edge cases).
MA modularity : SMA/EMA/WMA/RMA selection enables controlled experiments without rewriting logic.
Auditable visuals : SL/TP zones and labels allow fast review of behavior during replays, optimization, and multi-asset scans.

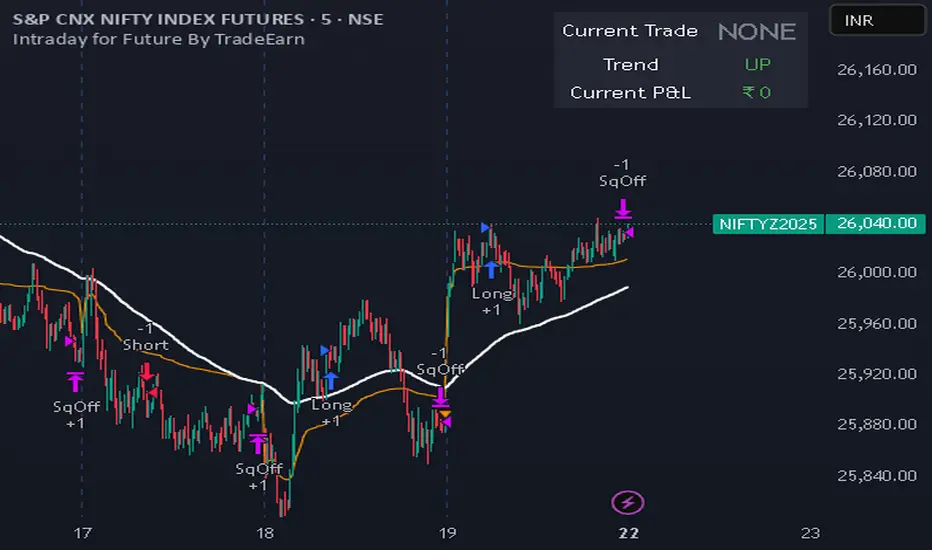
Intraday for Future By TradeEarnIntraday Strategy (StochRSI + VWAP + EMA)
Overview The Intraday Pullback Scalper is a specialized trend-following strategy designed for futures and equity traders who prefer to enter existing trends on pullbacks rather than chasing breakouts. By combining volume-weighted data (VWAP) with exponential moving averages (EMA) and momentum oscillators (Stochastic RSI), this script identifies high-probability entry points during intraday sessions. It includes built-in automation hooks (Alerts) compatible with bridge services for seamless execution.
How It Works
The strategy relies on a three-step confirmation process to filter noise and precision-time entries:
Trend Definition (The Filter):
VWAP (Volume Weighted Average Price): Acts as the primary regime filter. Longs are only permitted if price > VWAP; Shorts only if price < VWAP.
EMA (Exponential Moving Average): A secondary trend filter (default 100 periods) ensures alignment with the broader trend.
Time Range Breakout (Optional): Users can enable an "Initial Balance" filter where trades are only taken if the price breaks out of a specific time range (e.g., first hour High/Low).
Entry Trigger (The Signal):
Long Entry: The market must be in an Uptrend (Price > VWAP & EMA). The script waits for a "dip" where the Stochastic RSI drops below the Oversold level (default 20) and then crosses back up.
Short Entry: The market must be in a Downtrend (Price < VWAP & EMA). The script waits for a "rally" where the Stochastic RSI rises above the Overbought level (default 80) and then crosses back down.
Risk Management:
The strategy uses fixed Target Profit and Stop Loss values defined in currency (₹) relative to the trade quantity.
It features visual SL and TP lines on the chart for the duration of the trade to assist with manual monitoring.
Key Features
Universal Compatibility: Works on the "Current Chart" (Nifty, Bank Nifty, Stocks, Commodities) without needing complex dropdown selection.
Visual Dashboard: An on-screen table displays the Current Trade Status (Long/Short), Trend Direction, and Running P&L in real-time.
Algobaba Bridge Ready: Pre-formatted alert messages are included for users utilizing the Algobaba bridge for automation (supports MIS/NRML product types).
Customizable Trend Filters: Users can toggle the Time Range filter or adjust the VWAP Anchor (Session, Week, Month).
Settings & Configuration
Trade Quantity: Set your default lot size (e.g., 50 for Nifty).
Risk Settings: Define Target and Stop Loss in Rupees (₹) per trade setup.
Indicators: Adjustable lengths for EMA, RSI, and Stochastic.
Trading Window: Restrict entries to specific session hours (e.g., 09:15 - 15:10).
⚠️ IMPORTANT DISCLAIMER & RISK WARNING ⚠️
1. Educational Purpose Only This strategy script is provided solely for educational, informational, and research purposes. It does not constitute financial advice, investment recommendations, or a solicitation to buy or sell any securities, futures, or derivatives. The author is not a SEBI registered Research Analyst or Investment Advisor.
2. No Guarantee of Profit The "P&L" and performance metrics displayed on the chart are hypothetical and based on historical data. Past performance is not indicative of future results. Market conditions change, and a strategy that worked in the past may fail in the future.
3. Limitations of Backtesting
Slippage & Commission: The script results may not fully account for real-world execution costs such as broker commissions, taxes (STT/GST), slippage, or liquidity issues.
Repainting/Data Lag: While every effort is made to ensure code stability, real-time data feeds may vary from historical data due to internet latency or data provider differences.
4. High Risk in Derivatives Trading Futures and Options (F&O) involves a substantial risk of loss and is not suitable for every investor. You can lose more than your initial capital. Please assess your risk tolerance and financial situation before trading.
5. Automation & Third-Party Tools This script includes alert messages formatted for third-party bridge services (e.g., Algobaba). The author assumes no responsibility for:
Technical failures, API errors, or connectivity issues with your broker or bridge provider.
Incorrect order execution resulting from automation.
Users are solely responsible for monitoring their trades and verifying order execution.
Usage Agreement By using this script, you acknowledge that you are trading at your own risk and hold the author harmless from any losses incurred. Always test on a paper trading account before deploying real capital.
Best RSI (SIIT) By Nagaraj HiremathBest RSI (SIIT) By Nagaraj Hiremath is based on RSI shows when to By and sell .


10>20,p>50 DEMARenders daily EMA, 10, 20 and 50 on any timeframe below 1D
30m timeframe works well.
Use trend of 10 > 20 + price > 50 for long and 10 < 20 + price < 50 for shorts or exits.

225 SMA CrossoverWell-known strategy from Zahlengraf from the Mauerstrassenwetten subreddit for you to test yourself.
You can change the length of the SMA and whether to trade long, short or both directions.

Buy the dips StrategyThis strategy getting in long position only after the price drop- Buy the dips
The % of the drop is Determined by SMA for the first trade
The inputs of SMA and % of the drop can be adjust from the User
After that Strategy start taking safe trades if not take profit from the first trade
The safe trades are Determined by step down deviation % and by quantity
There is no Stop loss is not for one with small tolerance to getting under
if any question ask

Trend Core Strategy v1.0 - GUMROADLog Regression Channel Pro Strategy
This is a trend-following pullback strategy built for TradingView (Pine Script v6).
It uses logarithmic regression channels to define the market’s primary trend, and looks for low-risk pullback entries within strong trending conditions.
Momentum and trend strength filters are applied to avoid ranging or weak markets.
This strategy is designed to be used when the market is clearly trending, not during choppy or sideways price action.
Best Used When
Strong uptrend or downtrend is present
Price is pulling back toward the regression channel
Volatility is sufficient (ADX confirms trend strength)
Suitable for 1H / 4H timeframes
Commonly used on BTC, ETH, and major crypto pairs
Key Characteristics
Non-repainting logic
Volatility-based risk management (ATR)
Designed for realistic backtesting
No martingale, no grid, no over-optimization
Gumroad Disclaimer (3 Lines)
This strategy is provided for educational purposes only and is not financial advice.
Trading involves risk, and losses may occur.
You are fully responsible for your own trading decisions.
