Mean Reversion Pro Strategy [tradeviZion]Mean Reversion Pro Strategy : User Guide
A mean reversion trading strategy for daily timeframe trading.
Introduction
Mean Reversion Pro Strategy is a technical trading system that operates on the daily timeframe. The strategy uses a dual Simple Moving Average (SMA) system combined with price range analysis to identify potential trading opportunities. It can be used on major indices and other markets with sufficient liquidity.
The strategy includes:
Trading System
Fast SMA for entry/exit points (5, 10, 15, 20 periods)
Slow SMA for trend reference (100, 200 periods)
Price range analysis (20% threshold)
Position management rules
Visual Elements
Gradient color indicators
Three themes (Dark/Light/Custom)
ATR-based visuals
Signal zones
Status Table
Current position information
Basic performance metrics
Strategy parameters
Optional messages
📊 Strategy Settings
Main Settings
Trading Mode
Options: Long Only, Short Only, Both
Default: Long Only
Position Size: 10% of equity
Starting Capital: $20,000
Moving Averages
Fast SMA: 5, 10, 15, or 20 periods
Slow SMA: 100 or 200 periods
Default: Fast=5, Slow=100
🎯 Entry and Exit Rules
Long Entry Conditions
All conditions must be met:
Price below Fast SMA
Price below 20% of current bar's range
Price above Slow SMA
No existing position
Short Entry Conditions
All conditions must be met:
Price above Fast SMA
Price above 80% of current bar's range
Price below Slow SMA
No existing position
Exit Rules
Long Positions
Exit when price crosses above Fast SMA
No fixed take-profit levels
No stop-loss (mean reversion approach)
Short Positions
Exit when price crosses below Fast SMA
No fixed take-profit levels
No stop-loss (mean reversion approach)
💼 Risk Management
Position Sizing
Default: 10% of equity per trade
Initial capital: $20,000
Commission: 0.01%
Slippage: 2 points
Maximum one position at a time
Risk Control
Use daily timeframe only
Avoid trading during major news events
Consider market conditions
Monitor overall exposure
📊 Performance Dashboard
The strategy includes a comprehensive status table displaying:
Strategy Parameters
Current SMA settings
Trading direction
Fast/Slow SMA ratio
Current Status
Active position (Flat/Long/Short)
Current price with color coding
Position status indicators
Performance Metrics
Net Profit (USD and %)
Win Rate with color grading
Profit Factor with thresholds
Maximum Drawdown percentage
Average Trade value
📱 Alert Settings
Entry Alerts
Long Entry (Buy Signal)
Short Entry (Sell Signal)
Exit Alerts
Long Exit (Take Profit)
Short Exit (Take Profit)
Alert Message Format
Strategy name
Signal type and direction
Current price
Fast SMA value
Slow SMA value
💡 Usage Tips
Consider starting with Long Only mode
Begin with default settings
Keep track of your trades
Review results regularly
Adjust settings as needed
Follow your trading plan
⚠️ Disclaimer
This strategy is for educational and informational purposes only. It is not financial advice. Always:
Conduct your own research
Test thoroughly before live trading
Use proper risk management
Consider your trading goals
Monitor market conditions
Never risk more than you can afford to lose
📋 Release Notes
14 January 2025
Added New Fast & Slow SMA Options:
Fibonacci-based periods: 8, 13, 21, 144, 233, 377
Additional period: 50
Complete Fast SMA options now: 5, 8, 10, 13, 15, 20, 21, 34, 50
Complete Slow SMA options now: 100, 144, 200, 233, 377
Bug Fixes:
Fixed Maximum Drawdown calculation in the performance table
Now using strategy.max_drawdown_percent for accurate DD reporting
Previous version showed incorrect DD values
Performance metrics now accurately reflect trading results
Performance Note:
Strategy tested with Fast/Slow SMA 13/377
Test conducted with 10% equity risk allocation
Daily Timeframe
For Beginners - How to Modify SMA Levels:
Find this line in the code:
fastLength = input.int(title="Fast SMA Length", defval=5, options= )
To add a new Fast SMA period: Add the number to the options list, e.g.,
To remove a Fast SMA period: Remove the number from the options list
For Slow SMA, find:
slowLength = input.int(title="Slow SMA Length", defval=100, options= )
Modify the options list the same way
⚠️ Note: Keep the periods that make sense for your trading timeframe
💡 Tip: Test any new combinations thoroughly before live trading
"Trade with Discipline, Manage Risk, Stay Consistent" - tradeviZion
Movingaveragecrossover

HOD/LOD/PMH/PML/PDH/PDL Strategy by @tradingbauhaus This script is a trading strategy @tradingbauhaus designed to trade based on key price levels, such as the High of Day (HOD), Low of Day (LOD), Premarket High (PMH), Premarket Low (PML), Previous Day High (PDH), and Previous Day Low (PDL). Below, I’ll explain in detail what the script does:
Core Functionality of the Script:
Calculates Key Price Levels:
HOD (High of Day): The highest price of the current day.
LOD (Low of Day): The lowest price of the current day.
PMH (Premarket High): The highest price during the premarket session (before the market opens).
PML (Premarket Low): The lowest price during the premarket session.
PDH (Previous Day High): The highest price of the previous day.
PDL (Previous Day Low): The lowest price of the previous day.
Draws Horizontal Lines on the Chart:
Plots horizontal lines on the chart for each key level (HOD, LOD, PMH, PML, PDH, PDL) with specific colors for easy visual identification.
Defines Entry and Exit Rules:
Long Entry (Buy): If the price crosses above the PMH (Premarket High) or the PDH (Previous Day High).
Short Entry (Sell): If the price crosses below the PML (Premarket Low) or the PDL (Previous Day Low).
Long Exit: If the price reaches the HOD (High of Day) during a long position.
Short Exit: If the price reaches the LOD (Low of Day) during a short position.
How the Script Works Step by Step:
Calculates Key Levels:
Uses the request.security function to fetch the HOD and LOD of the current day, as well as the highs and lows of the previous day (PDH and PDL).
Calculates the PMH and PML during the premarket session (before 9:30 AM).
Plots Levels on the Chart:
Uses the plot function to draw horizontal lines on the chart representing the key levels (HOD, LOD, PMH, PML, PDH, PDL).
Each level has a specific color for easy identification:
HOD: White.
LOD: Purple.
PDH: Orange.
PDL: Blue.
PMH: Green.
PML: Red.
Defines Trading Rules:
Uses conditions with ta.crossover and ta.crossunder to detect when the price crosses key levels.
Long Entry: If the price crosses above the PMH or PDH, a long position (buy) is opened.
Short Entry: If the price crosses below the PML or PDL, a short position (sell) is opened.
Long Exit: If the price reaches the HOD during a long position, the position is closed.
Short Exit: If the price reaches the LOD during a short position, the position is closed.
Executes Orders Automatically:
Uses the strategy.entry and strategy.close functions to open and close positions automatically based on the defined rules.
Advantages of This Strategy:
Based on Key Levels: Uses important price levels that often act as support and resistance.
Easy to Visualize: Horizontal lines on the chart make it easy to identify levels.
Automated: Entries and exits are executed automatically based on the defined rules.
Limitations of This Strategy:
Dependent on Volatility: Works best in markets with significant price movements.
False Crosses: There may be false crosses that generate incorrect signals.
No Advanced Risk Management: Does not include dynamic stop-loss or take-profit mechanisms.
How to Improve the Strategy:
Add Stop-Loss and Take-Profit: To limit losses and lock in profits.
Filter Signals with Indicators: Use RSI, MACD, or other indicators to confirm signals.
Optimize Levels: Adjust key levels based on the asset’s behavior.
In summary, this script is a trading strategy that operates based on key price levels, such as HOD, LOD, PMH, PML, PDH, and PDL. It is useful for traders who want to trade based on significant support and resistance levels.

Triple EMA + QQE Trend Following Strategy [TradeDots]The "Triple EMA + QQE Trend Following Strategy" harnesses the power of two sophisticated technical indicators, the Triple Exponential Moving Average (TEMA) and the Qualitative Quantitative Estimation (QQE), to generate precise buy and sell signals. This strategy excels in capturing shifts in trends by identifying short-term price momentum and dynamic overbought or oversold conditions.
HOW IT WORKS
This strategy integrates two pivotal indicators:
Triple Exponential Moving Average (TEMA): TEMA enhances traditional moving averages by reducing lag and smoothing the data more effectively. It achieves this by applying the EMA formula three times onto the price, as follows:
tema(src, length) =>
ema1 = ta.ema(src, length)
ema2 = ta.ema(ema1, length)
ema3 = ta.ema(ema2, length)
tema = 3*ema1 - 3*ema2 + ema3
This computation helps to sharpen the sensitivity to price movements.
Qualitative Quantitative Estimation (QQE): The QQE indicator improves upon the standard RSI by incorporating a smoothing mechanism. It starts with the standard RSI, overlays a 5-period EMA on this RSI, and then enhances the result using a double application of a 27-period EMA. A slow trailing line is then derived by multiplying the result with a factor number. This approach establishes a more refined and less jittery trend-following signal, complementing the TEMA to enhance overall market timing during fluctuating conditions.
APPLICATION
Referenced from insights on "Trading Tact," the strategy implementation follows:
First of all, we utilize two TEMA lines: one set at a 20-period and the other at a 40-period. Then following the rules below:
40-period TEMA is rising
20-period TEMA is above 40-period TEMA
Price closes above 20-period TEMA
Today is not Monday
RSI MA crosses the Slow trailing line
This strategy does not employ an active take profit mechanism; instead, it utilizes a trailing stop loss to allow the price to reach the stop loss naturally, thereby maximizing potential profit margins.
DEFAULT SETUP
Commission: 0.01%
Initial Capital: $10,000
Equity per Trade: 80%
Users are advised to adjust and personalize this trading strategy to better match their individual trading preferences and style.
RISK DISCLAIMER
Trading entails substantial risk, and most day traders incur losses. All content, tools, scripts, articles, and education provided by TradeDots serve purely informational and educational purposes. Past performances are not definitive predictors of future results.
Reference:
Trading Tact. What Is the QQE Indicator? Retrieved from: tradingtact.com

Ahsan Tufail Precise MA Crossover Filter for Reliable SignalsIntroduction:
In the ever-evolving world of Forex trading, strategies that provide a competitive edge are highly sought after. The Moving Average (MA) crossover technique is a popular long-term approach, but its vulnerability to false signals can lead to potential losses. To overcome this challenge, we introduce a game-changing MA crossover filter designed to weed out false signals and unlock the full potential of this strategy. In this article, we delve into the mechanics of this filter, providing a comprehensive analysis of its components and how it enhances the accuracy of buy and sell signals.
The Power of the MA Crossover Filter:
The essence of our MA crossover filter lies in the integration of a specialized indicator that operates on a scale of 0 to 100. This ingenious indicator dynamically measures the distance between the middle Bollinger band and either the upper or lower Bollinger band. By analyzing the values of the last 504 candlesticks, it maps the range from 50 to 100 for the largest and smallest distances between the middle and upper Bollinger bands. Similarly, for values ranging from 0 to 50, it measures the distance between the middle and lower Bollinger bands.
Unveiling the Signal Execution Process:
The brilliance of this filter is revealed in its meticulous execution of buy and sell signals, which significantly reduces false crossovers. Let's explore the process step-by-step:
Buy Signal Precision:
To initiate a buy signal, the price must be positioned above the 200-period Simple Moving Average (SMA).
The filter validates the crossover by checking the indicator's value, ensuring it falls below the threshold of 25.
Sell Signal Accuracy:
For a sell signal, the price must be below the 200-period Simple Moving Average (SMA).
The filter confirms the crossover by verifying the indicator's value, which should exceed the threshold of 75.
This selective approach ensures that only high-confidence crossovers are considered, maximizing the potential for profitable trades.
Fine-Tuning the Filter for Optimal Performance:
While the MA crossover filter exhibits its prowess in GBPUSD and EURUSD currency pairs, it may require adjustments for other pairs. Currency pairs possess unique characteristics, and adapting the filter to specific behavior is crucial for its success.
To fine-tune the filter for alternative currency pairs, traders should conduct rigorous backtesting and analyze historical price data. By experimenting with indicator threshold values, traders can calibrate the filter to accurately match the dynamics of the target currency pair. This iterative process allows for customization, ultimately resulting in a finely-tuned filter that aligns with the unique behavior of the selected market.
Conclusion:
The MA crossover filter represents a paradigm shift in long-term Forex trading strategies. By intelligently filtering false signals, this precision tool unleashes the true potential of the MA crossover technique, elevating its profitability and enhancing overall trading performance. While no strategy guarantees absolute success, incorporating this filter empowers traders with a heightened level of confidence in their buy and sell signals. Embracing the power of this innovative filter can be a transformative step towards mastering Forex profits and staying ahead in the dynamic world of currency trading.

Buy Only Strategy with Dynamic Re-Entry and ExitThe strategy aims to create a simple buy-only trading system based on moving average crossovers and the Weekly Commodity Channel Index (CCI) or Weekly Average Directional Index (ADX). It generates buy signals when the fast-moving average crosses above the slow-moving average and when the Weekly CCI and or Weekly ADX meet the specified conditions.
The strategy also allows for dynamic re-entry, which means it can open new long positions if the price goes above the three moving averages after an exit. However, the strategy will exit the long position if the price closes below the third moving average.
ENTRY CONDITIONS
The script defines the conditions for generating buy signals. It checks for two conditions for a valid buy signal:
• If the fast-moving average crosses above the slow-moving average -THERE IS Dynamic Re-Entry also
• If the user chooses HE OR SHE CAN FILTER TRADES BY USING CCI OR ADX
Dynamic Re-Entry:
the script allows for dynamic re-entry. If there is no active long position and the price is above all three moving averages a new long position is opened.
Exit Conditions
The script defines the exit condition for closing a long position. If the price closes below the third moving average, the script closes the long position.
IMPORTANT NOTICE
ONLY DAILY TIME FRAME
THERE WOULD BE WHIPSAW USE YOUR OWN ACCUMEN TO MINIMISE THEM
ITS ONLY BUY STRATEGY
EXIT CAN BE STRATEGY BASED OR SET PROFIT AND TARGETS AS PER RISK APETITE /RISK MANAGEMENT
DONT TRADE OPTIONS ON THIS
SUITABLE FOR STOCKS OF USA AND INDIAN MARKETS
ALWAYS REMEMBER TO DO YOUR OWN RESEARCH BEFORE TRADING AND INVESTING

twisted SMA strategy [4h] Hello
I would like to introduce a very simple strategy that uses a combination of 3 simple moving averages ( SMA 4 , SMA 9 , SMA 18 )
this is a classic combination showing the most probable trend directions
Crosses were marked on the basis of the color of the candles (bulish cross - blue / bearish cross - maroon)
ma 100 was used to determine the main trend, which is one of the most popular 4-hour candles
We define main trend while price crosses SMA100 ( for bullish trend I use green candle color )
The long position strategy was created in combination of 3 moving averages with Kaufman's adaptive moving average by alexgrover
The strategy is very accurate and is easy to use indicators
the strategy uses only Buy (Long) signals in a combination of crossovers of the SMA 4, SMA 9, SMA 18 and the Kaufman Adaptive Moving Average.
As a signal to close a long position, only the opposite signal of the intersection of 3 different moving averages is used
the current strategy is recommended for higher time zones (4h +) due to the strength of the closing candles, which translates into signal strength
works fascinatingly well for long-term bullish market assets (for example 4h Apple, Tesla charts)
Enjoy and trade safe ;)

VWMA/SMA 3Commas BotThis strategy utilizes two pairs of different Moving Averages, two Volume-Weighted Moving Averages (VWMA) and two Simple Moving Averages (SMA).
There is a FAST and SLOW version of each VWMA and SMA.
The concept behind this strategy is that volume is not taken into account when calculating a Simple Moving Average.
Simple Moving Averages are often used to determine the dominant direction of price movement and to help a trader look past any short-term volatility or 'noise' from price movement, and instead determine the OVERALL direction of price movement so that one can trade in that direction (trend-following) or look for opportunities to trade AGAINST that direction (fading).
By comparing the different movements of a Volume-Weighted Moving Average against a Simple Moving Average of the same length, a trader can get a better picture of what price movements are actually significant, helping to reduce false signals that might occur from only using Simple Moving Averages.
The practical applications of this strategy are identifying dominant directional trends. These can be found when the Volume Weighted Moving Average is moving in the same direction as the Simple Moving Average, and ideally, tracking above it.
This would indicate that there is sufficient volume supporting an uptrend or downtrend, and thus gives traders additional confirmation to potentially look for a trade in that direction.
One can initially look for the Fast VWMA to track above the Fast SMA as your initial sign of bullish confirmation (reversed for downtrending markets). Then, when the Fast VWMA crosses over the Slow SMA, one can determine additional trend strength. Finally, when the Slow VWMA crosses over the Slow SMA, one can determine that the trend is truly strong.
Traders can choose to look for trade entries at either of those triggers, depending on risk tolerance and risk appetite.
Furthermore, this strategy can be used to identify divergence or weakness in trending movements. This is very helpful for identifying potential areas to exit one's trade or even look for counter-trend trades (reversals).
These moments occur when the Volume-Weighted Moving Average, either fast or slow, begins to trade in the opposite direction as their Simple Moving Average counterpart.
For instance, if price has been trending upwards for awhile, and the Fast VWMA begins to trade underneath the Fast SMA, this is an indication that volume is beginning to falter. Uptrends need appropriate volume to continue moving with momentum, so when we see volume begin to falter, it can be a potential sign of an upcoming reversal in trend.
Depending on how quickly one wants to enter into a movement, one could look for crosses of the Fast VWMA under/over the Fast SMA, crosses of the Fast VWMA over/under the Slow SMA, or crosses over/under of the Slow VWMA and the Slow SMA.
This concept was originally published here on TradingView by ProfitProgrammers.
Here is a link to his original indicator script:
I have added onto this concept by:
converting the original indicator into a strategy tester for backtesting
adding the ability to conveniently test long or short strategies, or both
adding the ability to calculate dynamic position sizes
adding the ability to calculate dynamic stop losses and take profit levels using the Average True Range
adding the ability to exit trades based on overbought/oversold crosses of the Stochastic RSI
conveniently switch between different thresholds or speeds of the Moving Average crosses to test different strategies on different asset classes
easily hook this strategy up to 3Commas for automation via their DCA bot feature
Full credit to ProfitProgrammers for the original concept and idea.
Any feedback or suggestions are greatly appreciated.

MA Simple Strategy with SL & TP & ATR FiltersHello Guys! Nice to meet you all!
This is my second script!
This Logic is trend following logic, This detects long & short trends by comparing the value of MAs.
This fits to the longer time frame.
### Long Condition
1. Compare 4 MAs (you can chose MA Type)
- Shortest MA (MA 1)
- Shorter MA (MA 2)
- Normal MA (MA 3)
- Longer MA (MA 4)
2. If MA 1 > MA 2 > MA 3 > MA 4, then Enter Long Position
- ‘The arrangement of MAs in descending orders’ is the proxy of the long trend.
### Short Condition
1. Compare 4 MAs (you can chose MA Type)
- Shortest MA (MA 1)
- Shorter MA (MA 2)
- Normal MA (MA 3)
- Longer MA (MA 4)
2. If MA 1 < MA 2 < MA 3 < MA 4, then Enter Short Position
- ‘The arrangement of MAs in ascending orders’ is the proxy of the short trend.
### Close Condition
1. When trend Changes
- When (MA 1 > MA 2 > MA 3 > MA 4) breaks or (MA 1 < MA 2 < MA 3 < MA 4) breaks.
2. When the price hits the stoploss
3. When the price hits the take profit level (basically 50% of qty will be closed)
### Etc
1. Trend filter (ATR should be bigger than SMA of ATR)
- If the volatility of price is to small (ATR), then there could be false signal. To filter this out, I used the condition ‘ATR should be larger than SMA of ATR’.
2. Stoploss
- Enabled Stoploss based on ATR, Percent, Risk-Reward Ratio,
- Enabled Trailing Stoploss.
3. Choose MA Type
- You can choose MA Type
+ Thanks for the stoploss template @jason5480

RSI with Slow and Fast MA Crossing Strategy (by Coinrule)This strategy utilises 3 different conditions that have to be met to buy and 1 condition to sell. This strategy works best on the ETH/USDT pair on the 4-hour timescale.
In order for the strategy to enter the trade, it must meet all of the conditions listed below:
ENTRY
RSI increases by 5
RSI is lower than 70
MA9 crosses above MA50
To exit a trade, the below condition must be met:
EXIT
MA50 crosses above MA9
This strategy works well on LINK/USDT on the 1-day timeframe, MIOTA/USDT on the 2-hour timeframe, BTC/USDT on the 4-hour timeframe, and BEST/USDT on the 1-day timeframe (and 4h).
Back-tested from 1 January 2020.
The strategy assumes each order is using 30% of the available coins to make the results more realistic and to simulate you only ran this strategy on 30% of your holdings. A trading fee of 0.1% is also taken into account and is aligned to the base fee applied on Binance.

Fast v Slow Moving Averages Strategy (Variable) [divonn1994]This is a simple moving average based strategy that takes 2 moving averages, a Fast and a Slow one, plots them both, and then decides to enter a 'long' position or exit it based on whether the two lines have crossed each other. It goes 'long when the Fast Moving Average crosses above the Slow Moving Average. This could indicate upwards momentum in prices in the future. It then exits the position when the the Fast Moving Average crosses back below. This could indicate downwards momentum in prices in the future. This is only speculative, though, but sometimes it can be a very good indicator/strategy to predict future action.
I've tried some strategy settings and I found different promising strategies. Here are a few:
BTCUSD ( BitStamp ) 1 Day Timeframe : EMA, Fast length 25 bars, Slow length 62 bars => 28,792x net profit (default)
BTCUSD ( BitStamp ) 1 Day Timeframe : VWMA, Fast length 21 bars, Slow length 60 bars => 15,603x net profit
BTCUSD ( BitStamp ) 1 Day Timeframe : SMA, Fast length 18 bars, Slow length 51 bars => 19,507x net profit
BTCUSD ( BitStamp ) 1 Day Timeframe : RMA, Fast length 20 bars, Slow length 52 bars => 5,729x net profit
BTCUSD ( BitStamp ) 1 Day Timeframe : WMA, Fast length 29 bars, Slow length 60 bars => 19,869x net profit
Features:
-You can choose your preferred moving average: SMA , EMA , WMA , RMA & VWMA .
-You can change the length average for each moving average
-I made the background color Green when you're currently in a long position and Red when not. I made it so you can see when you'd be actively in a trade or not. The Red and Green background colors can be toggled on/off in order to see other indicators more clearly overlayed in the chart, or if you prefer a cleaner look on your charts.
-I also have a plot of the Fast moving average and Slow moving average together. The Opening moving average is Purple, the Closing moving average is White. White on top is a sign of a potential upswing and purple on top is a sign of a potential downswing. I've made this also able to be toggled on/off.
Let me know if you think I should change anything with my script, I'm always open to constructive criticism so feel free to comment below :)

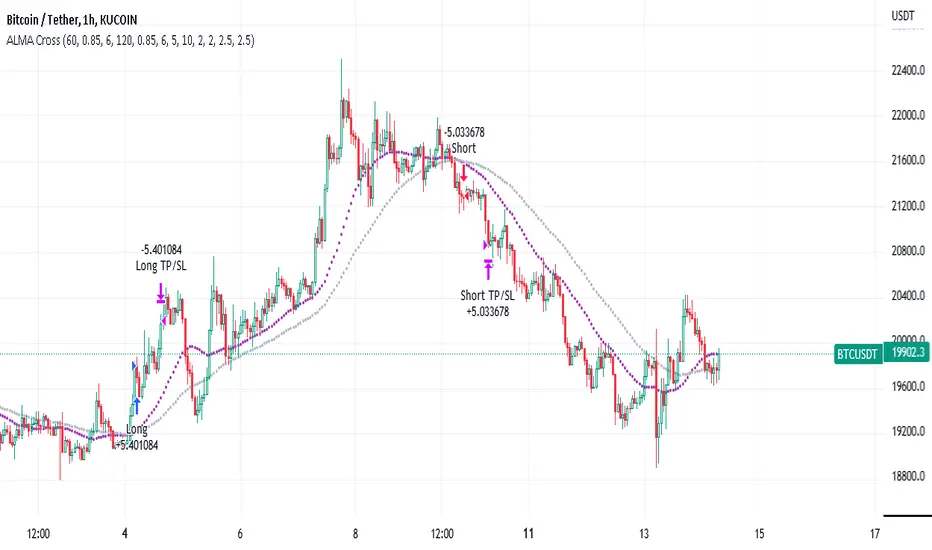
Arnaud Legoux Moving Average Cross (ALMA)This strategy uses two different Arnaud Legoux Moving Average Lengths, one fast and one slow, to determine crosses for entries. The Arnaud Legoux Moving Average is an improvement to traditional MA's because it reduces lag and smooths the signal line. I have added a volume filter to improve the accuracy of the signals. This script is optimized to be used with crypto, but could be adjusted to use on different instruments. Alert functionality is included. The backtesting results displayed use 10% of the initial account equity, adjust as necessary.
Chirag Strategy SMA with StopLossThe Moving Average Crossover trading strategy is possibly the most popular trading strategy in the world of trading. This strategy is a good example of so-called traditional strategies. Traditional strategies are always long or short. That means they are never out of the market. The concept of having a strategy that is always long or short may be scary, particularly in today’s market where you don’t know what is going to happen as far as risk on any one market. But a lot of traders believe that the concept is still valid, especially for those of traders who do their own research or their own discretionary trading.
This version uses crossover of simple moving averages of length 10 and 13. This strategy is best suitable for NIFTY and BANKNIFTY under 15min candlestick for intraday and 1hour candlestick for long-term.

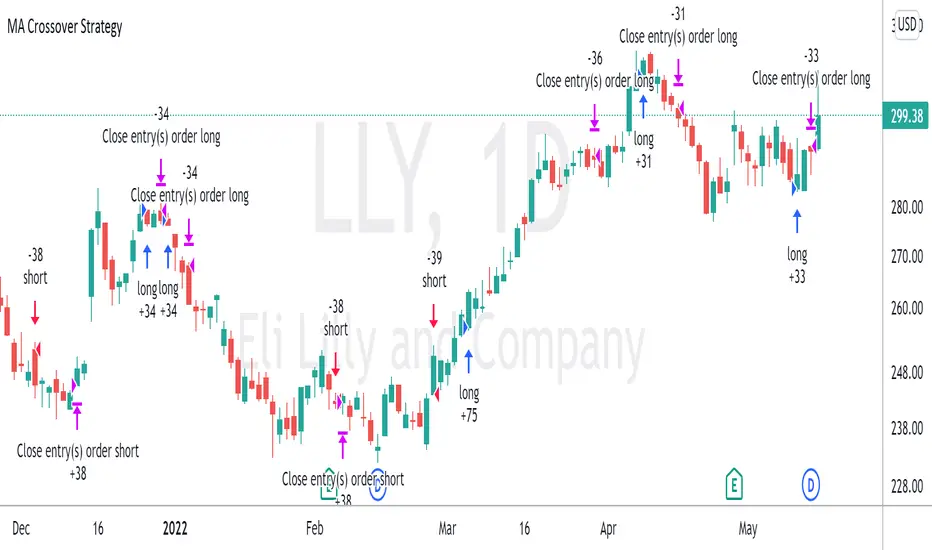
Moving Average Crossover StrategyThe Moving Average Crossover indicator uses 3 moving averages (2 simple moving averages and 1 exponential moving average ) to signal long and short opportunities based on moving average crossovers. This strategy serves as a backtest to that indicator. By taking entry and exit positions based on moving average crossovers, we are able to project profit with this script. You are given the option to select which moving average crossings trigger entry and exit signals. Fast refers to an EMA which should be your shortest MA. Slow refers to the first SMA which will serve as a signal line. Trend refers to a long SMA which will help determine if you should take long positions or short. You can also filter by extra conditions such as minimum volume or RSI. For example, you may have the script trigger a buy signal if the 5ema crosses the 20 sma while RSI reads 60 and sell if it crosses again.
This strategy starts with $100,000 and uses 10% of the account per trade.
Best TradingView Strategy - For NASDAQ and DOW30 and other IndexThe script is totally based on momentum , volume and price. We have used :
1: Bollinger Band Squeezes to know when a breakout might happen.
2: Used Moving Averages(SMA and EMA) to know the direction.
3: The success Rate of this strategy is above 75% and if little price action is added it can easily surpass 90% success mark.
4: Do not worry about drawdowns , we have implemented trailing SL ,so you might see a little extra drawdown but in reality its pretty less.
5: I myself have tested this strategy for 41 days with a 250$ account and right now I have 2700$.

DC Breakout Strategy | This is simplicity at its finest.As the title already describes: this is a Donchian breakout strategy. This strategy, as of now, only goes long. It goes long when the price close makes a new high and the 8 day moving average is above the 32 day moving average. The strategy exits the trade if the price breaks the atr trailing stop of * 3 or the 8 day moving average crosses below the 32 day moving average.
This is simplicity at its finest.

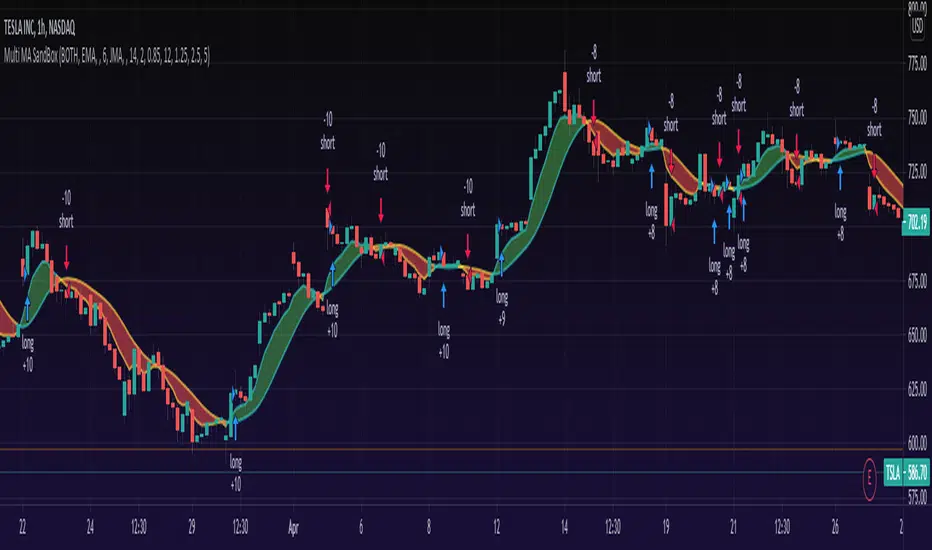
Multi MA MTF SandBox StrategyA moving averages SandBox strategy where you can experiment using two different moving averages (like KAMA, ALMA, HMA, JMA, VAMA and more) on different time frames to generate BUY and SELL signals, when they cross.
Great sandbox for experimenting with different moving averages and different time frames.
== How to use ==
We select two types of moving averages on two different time frames (or the same time frame):
First is the FAST moving average that should be at the same time frame or higher.
Second is the SLOW moving average that should be on the same time frame or higher.
== Buy and Sell Signals ==
When FAST moving average cross over the SLOW moving average we have a BUY signal (for LONG)
When FAST moving average cross under the SLOW moving average we have a SELL signal (for SHORT)
WARNING: Using a lower time frame than your chart time frame will result in unrealistic results in your backtesting and bar replay.
== NOTES ==
You can select BOTH, LONG, SHORT or NONE in the strategy settings.
You can also enable Stop Loss and Take Profit.
More sandboxes to come, Follow to get notified.
Like if you like and Enjoy!
Can also act as indicator by setting 'What trades should be taken' to 'NONE':