BBP Oscillator V1 + Multiple Time FrameBull Bear Power + HTF/LTF Filter (BBP+)
Overview:
BBP+ is a minimalist Bull Bear Power histogram designed to help traders identify potential bearish signals while filtering them with current and higher timeframe trends. An optional lower timeframe (LTF) filter can further reduce false signals, without displaying extra markers on the chart.
Inputs:
BBP Length: EMA length for BBP calculation (smaller → more sensitive, larger → smoother).
EMA Trend (Current TF): Current timeframe trend filter (signals only when bearish).
HTF Timeframe & EMA: Higher timeframe trend filter (optional).
Enable HTF Filter: Toggle HTF trend filter.
LTF Timeframe & Enable LTF Filter: Optional filter to reduce false signals; no visual output.
Show Signals: Toggle to show/hide main bearish signals.
Signal Logic:
Main bearish signals appear when:
Current trend is bearish
BBP momentum is decreasing
Optional HTF trend filter passes
Optional LTF momentum filter passes
Important Notes
Indicator is not a guaranteed profit tool; use for analysis only.
Past performance does not indicate future results.
LTF filter does not appear visually, only helps filter main signals.
Adjust BBP Length, EMA Trend, and HTF/LTF settings according to market volatility and timeframe.
Multiple-timeframe

Multi-TrendMulti-Trend is an indicator that simplifies the task of tracking market trends across up to 10 custom timeframes. With the flexibility to select your preferred timeframes, with current or any specific data in past, this indicator offers a clear visual representation of the market's direction.
For each chosen timeframe and history, Multi-Trend provides a straightforward arrow-based signal system: an upward arrow signifies a rising market, a downward arrow indicates a falling market, and a right arrow denotes a market at equilibrium. These default symbols can be effortlessly personalized to your choice of symbols or text, allowing you to tailor the indicator to your specific needs.
The trend direction is calculated using a reliable methodology based on the percentage change in the close price for the selected timeframe.

MTF Commodity Oddity Index (CCI+)MTF Commodity Oddity Index (CCI+)
This chart overlay indicator is based upon the Commodity Channel Index (CCI) and can signal multiple triple-timeframe CCI overbought and oversold confluences directly onto your chart, intended for use as a confluence either for reversal trade entries, or potential trade exits, indicating where price may be probable to reverse.
Features include:
- Primary set of fully configurable triple-timeframe overbought and oversold signals, indicating where 3 selected timeframes are all overbought or all oversold at the same time. Enabled by default.
- Secondary set of fully configurable triple-timeframe overbought and oversold signals, indicating where 3 selected timeframes are all overbought or all oversold at the same time. Enabled by default.
- Optional drawing of background colours and/or ribbon seen at bottom of the chart image.
- The default primary MTF #1 timeframes are set to 1 minute, 5 minute and 15 minute. These are highly suitable for low timeframe scalpers trading on < 5m charts, and can often pin point price reversals.
- The default Secondary MTF #2 timeframes are set to 15 minute, 30 minute and 120 minute. These are suitable for both low timeframe scalpers and considerably higher timeframe traders.
- Independent alerts for MTF #1 and MTF #2 triple-timeframe confluences, including options for alerting MTF overbought and MTF oversold individually, as well as an option for alerting either overbought or oversold in a single combined alert.
- Also includes standard configurable CCI options, including CC length and source type.
Note: The features listed above are accurate at the time of publishing but maybe updated or added to in future.
A similar MTF CCI indicator is also available as a panel indicator here .
This indicator is based upon the original MTF Fantastic Stochastic (FS+) available here .
What is the Commodity Channel Index (CCI)?
Investopedia has described the popular oscillator as follows:
“The Commodity Channel Index (CCI) is a momentum-based oscillator used to help determine when an investment vehicle is reaching a condition of being overbought or oversold.
Developed by Donald Lambert, this technical indicator assesses price trend direction and strength, allowing traders to determine if they want to enter or exit a trade, refrain from taking a trade, or add to an existing position. In this way, the indicator can be used to provide trade signals when it acts in a certain way.”
You can read more about the CCI , its use cases and calculations here .
How do traders use overbought and oversold levels in their trading?
The oversold level, that is traditionally when the CCI is above the 100 level is typically interpreted as being 'overbought', and below the -100 level is typically considered 'oversold'. Traders will often use the CCI at an overbought level as a confluence for entry into a short position, and the CCI at an oversold level as a confluence for an entry into a long position. These levels do not mean that price will necessarily reverse at those levels in a reliable way, however. This is why this version of the CCI employs the triple timeframe overbought and oversold confluence, in an attempt to add a more confluence and reliability to this usage of the CCI . While traditionally, the overbought and oversold levels are below -100 for oversold, and above 100 for overbought, the default threshold settings of this indicator have been increased to provide fewer, stronger signals, especially suited to the low timeframes and highly volatile assets.

Mulitiple time frame Slow Stochastic JamilaThis is a very useful Multiple time frame Slow Stochastic for traders who which to entry and exit when the slow stochastic of the different time frame are all in sync.
How to use this indicator. Only entry long when the day, 3day, weekly, monthly stochastic are going up. Exit when the day or 3day stochastic reaches 80% level.

Multi EMA with labels (Any timeframe)This script lets you add up to 8 EMAs (Exponential Moving Averages) that can be set to any timeframe and length. The difference between this and other EMA indicators is that it has a simple label attached to each EMA showing which timeframe it belongs to and what length it is, so you can get that information at a glance while trading without having to remember the specific settings for each EMA.
I was personally looking for something like this because I like clarity on my chart and these labels really help. The existing EMA indicators I found with labels don't support multiple timesframes or if they do, they don't include the timeframe itself in the label, so that's why I created this simple script and shared it in case somebody else is looking for the same. Enjoy.

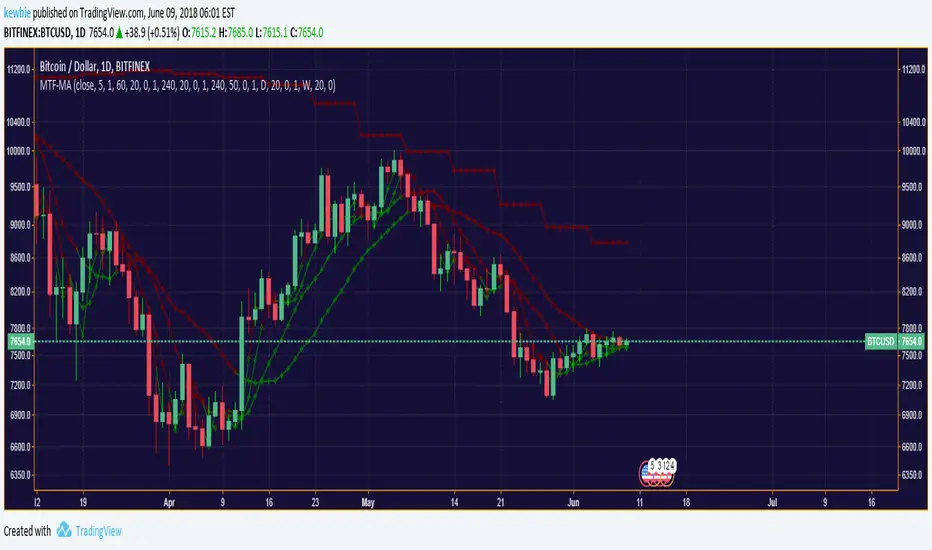
Multiple Timeframe Moving Average SystemModified code from ChrisMoody, RicardoSantos & Ricardo M Arjona.
Allows for multiple moving average types across custom time-frames.