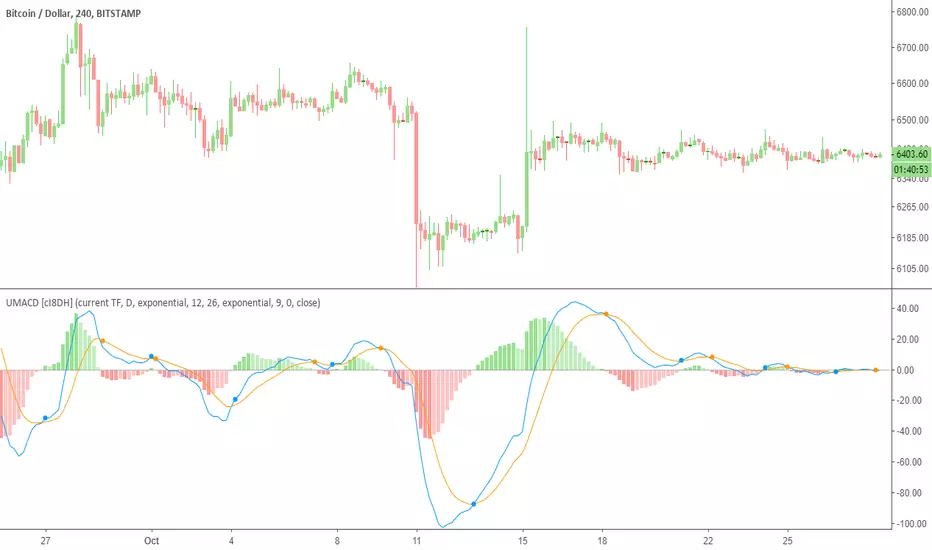
Ultimate MACD (UMACD) [cI8DH]Ultimate MACD ( UMACD ) includes True MACD fix, normalized MACD, multi time frame, bar coloring, and false cross avoidance options. It can also replicate Bill Williams Awesome Oscillator and Accelerator Oscillator. By default, this indicator is configured to work like the built-in MACD indicator. You need to customize it to your liking. Chart below shows example multi time frame setup.
True MACD and normalization
True MACD fix is similar to True RSI fix. The chart below proves that MACD is asymmetrical. This issue is most visible when analyzing charts across wide price ranges. It shows a logical problem in MACD, and most other indicators, as they can give you conflicting signals. For example, it can show long signal for both TRYUSD and its inverse pair USDTRY simultaneously. True MACD fixes this issue as shown in the chart below. Interestingly, this fix also normalizes MACD which is a major improvement upon regular MACD . (FYI, True MACD fix uses a different mechanism than my previous NMACD indicator.)
Avoiding false signals
This feature is very useful to avoid trading during sideways. To use this feature, set the std deviation multiplier option to a number greater than 1. I did some backtests on BTC chart with contract size set to 100% equity. It showed significant improvements for the time frames that I tested. (std deviation multiplier set to 1.5 @1h TF: 4x improvements, @2h: near 2x, 0.7 @4h: 2x, 0.4@12h: 3x, 0.4@daily: 1.5x). I also backtested True MACD fix separately and it showed significant improvement for most time frames.
Bar coloring
Bar coloring works similar to my previous indicators, Ultimate Money Flow and Ultimate RSI , and is subject to change in the future.
Bill Williams Awesome Oscillator and Accelerator Oscillator
Chart below both validates calculations in this indicator and also shows you how you can replicate Bill Williams AO indicators. You can apply all the features added to MACD to these indicators.
Here is a TL;DR list of my indicators to save you some time from looking at my obsolete indicators.
PS: I might publish the asymmetry fix as True MACD or as a general fix to all price-based indicators as an open source script in the future.
Normalized
Normalized Relative Vigor IndexThis is the Relative Vigor Index indicator just multiplied by 100 to have non-zero integer part

RSI normalized by Bollinger BandsEnglish.
RSI indicator with Bollinger Bands in one. Forgot oversold and overbought!
With BB and RSI you can dinamically saw when RSI is in critical values. And when you can see figure 'M' or 'W' in oscillator it means that current movement of impulse is down.
Русский.
RSI и Ленты Боллинджера в одном. Забудьте о тупых линиях перекупленности и перепроданности!
При работе в связке вы можете определять эти зоны динамически. И при формировании фигуры 'M' или 'W' на осцилляторе будет четко показано, что текущий импульс умер, надо выходить из сделки.
Example of usage (exit points) / Пример использования (точки выхода)

Normalised Elliot Wave Oscillator [Unelma]This is a normalised version of the Lazy Bear EWO_.
The normalisation makes it easier to read especially with cryptos, where there are fast and big price changes which make most of indicators impossible to read over a long span.
The normalisation also highlights divergences which couldn't be spot before.

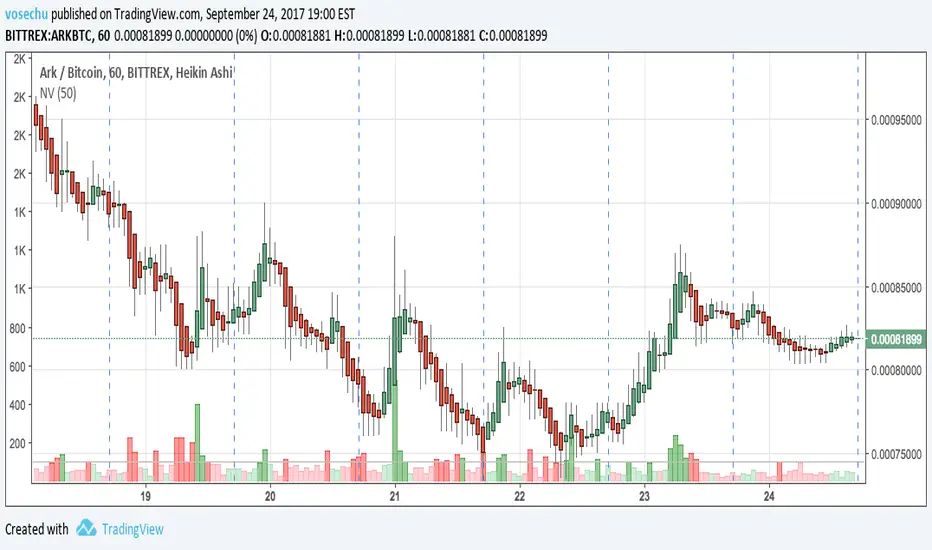
Normalized Volume by vosechuThis script adds a volume indicator that is normalized by SMA(50) by default. This will help you easily see whether the volume is _actually_ high or not. It also highlights when volume is exceeding the average by making the column a darker color.
Caveats:
* This changes the volume into a percentage, so don't use this number for calculations
Hints:
* Make sure to set your "bottom margin" to 0% or the volume chart will appear to be floating above the bottom
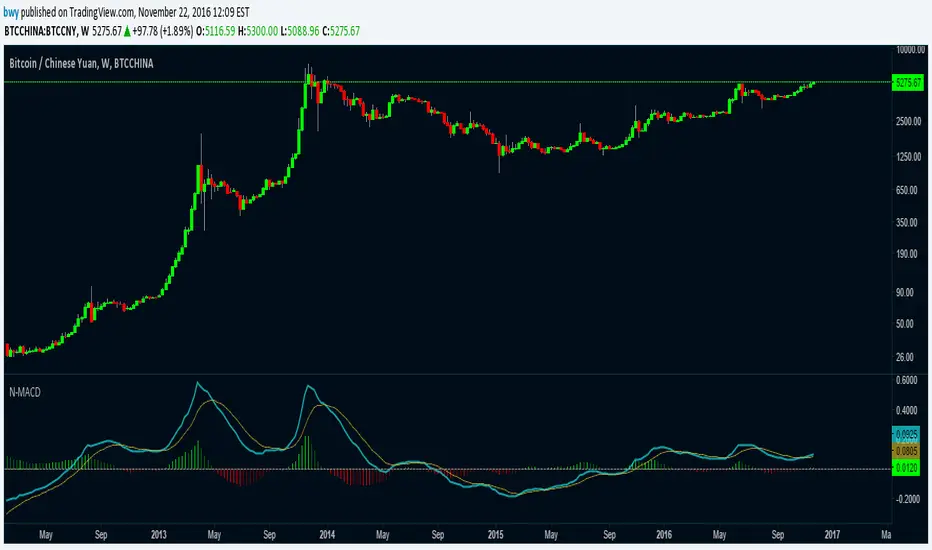
Normalized Moving Average Convergence/DivergenceThis MACD normalizes the price so that it can be compared against moves that took place at prices of significant difference.
There are also options to change if the MACD and the signal line are computed using EMA or SMA.
Normalized MACD (v420)did i remove the EMA and replace it with HullMA?
yes
:-)
also some other maths added

Dollar normalized volumeAn indicator that multiply the closing price with the current volume. (close X volume)
This will show the relative interest in the underlying asset regardless of the price change over time. For the case of FXCM, when the price fell from $16 to $1, its volume spiked 16x at the same time given the fact that 16x more shares can now be purchased with the same amount of dollar.
Enjoy! and remember to give a thumbs up.
