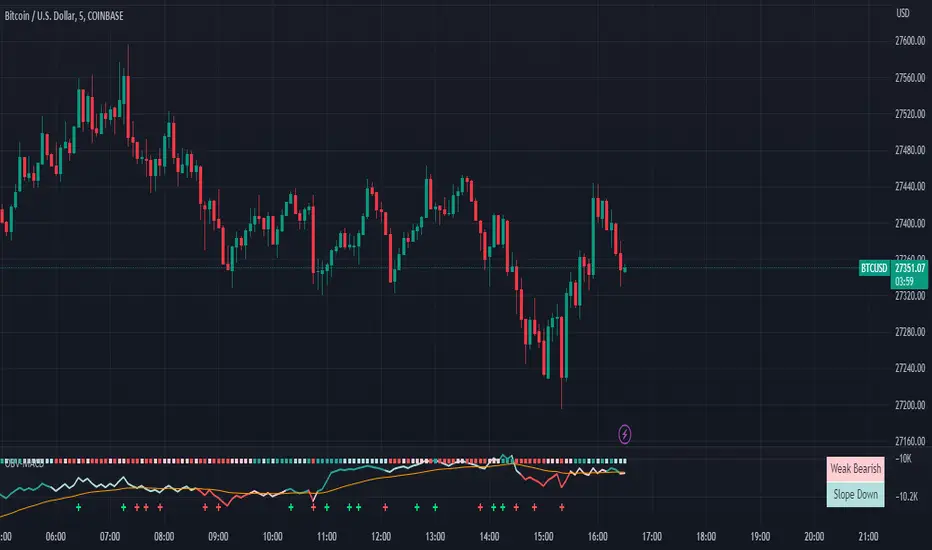
RBX - OBV MACDOBV (On-Balance Volume) is a technical indicator that measures the momentum of buying and selling pressure in a market based on the volume of trades. It uses a cumulative total of volume traded during periods of price increases and decreases to determine the overall trend. When prices rise, OBV increases, and when prices fall, OBV decreases.
The enhanced version of OBV combines the traditional OBV formula with the MACD (Moving Average Convergence Divergence) indicator to provide more information about the momentum of the volume flow. The MACD is a trend-following momentum indicator that shows the relationship between two moving averages of price.
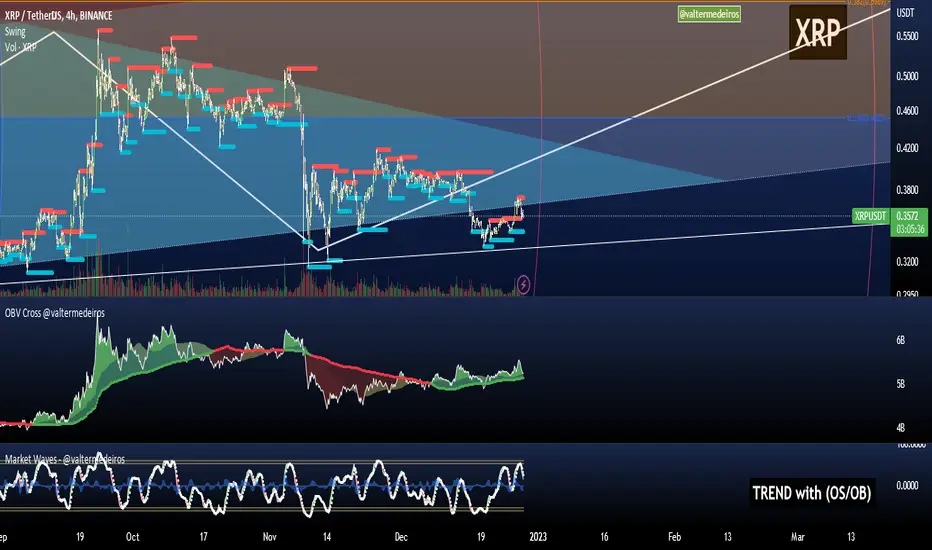
In the enhanced OBV with MACD, the top color in the OBV line indicates the quadrant of the MACD, with green indicating the first quadrant (positive value of MACD and increasing), red indicating the second quadrant (negative value of MACD and decreasing), magenta indicating the third quadrant (negative value of MACD and increasing), and cyan indicating the fourth quadrant (positive value of MACD and decreasing).
The top bar color in the enhanced OBV with MACD indicates the increasing or decreasing of the MACD histogram. A green bar indicates an increasing histogram, while a red bar indicates a decreasing histogram.
In addition, the plus bar sign in the enhanced OBV with MACD signifies that the OBV is making a new high or new low. This helps traders identify potential trend reversals or confirm the current trend.
Overall, the enhanced OBV with MACD provides traders with more information about the momentum of volume flow and potential trend reversals, making it a useful tool for technical analysis in trading.
Индикатор балансового объёма (OBV)
Indicatore volatilità v5 con segnali------------- INGLESE -------------
This indicator uses an exponential moving average (HMA) of the length specified by the user to calculate market volatility. Volatility is calculated by multiplying the Average True Range (ATR) by the simple moving average (SMA) of the volume.
The code uses colors to display market conditions. If the closing price is above the HMA, the columns turn green. If the closing price is below the HMA, the columns turn red. If volatility is below the SMA of volatility multiplied by the user-specified sideways volatility threshold, the columns turn orange.
In addition, the code uses the Rate of Change (ROC) to generate buy and sell signals. If the ROC is positive and the columns are green, a buy signal is generated and the columns turn black. If the ROC is negative and the columns are red, a sell signal is generated and the columns turn purple.
In summary, this indicator uses colors to display market conditions and help the user enter and exit the market based on volatility.
If you like this indicator give me a boost and leave a comment!! Thank you!
------------- ITALIANO -------------
Questo indicatore utilizza una media mobile esponenziale (HMA) della lunghezza specificata dall’utente per calcolare la volatilità del mercato. La volatilità viene calcolata moltiplicando l’Average True Range (ATR) per la media mobile semplice (SMA) del volume.
Il codice utilizza i colori per visualizzare le condizioni di mercato. Se il prezzo di chiusura è superiore all’HMA, le colonne diventano verdi. Se il prezzo di chiusura è inferiore all’HMA, le colonne diventano rosse. Se la volatilità è inferiore alla SMA della volatilità moltiplicata per la soglia di volatilità laterale specificata dall’utente, le colonne diventano arancioni.
Inoltre, il codice utilizza il Rate of Change (ROC) per generare segnali di acquisto e vendita. Se il ROC è positivo e le colonne sono verdi, viene generato un segnale di acquisto e le colonne diventano nere. Se il ROC è negativo e le colonne sono rosse, viene generato un segnale di vendita e le colonne diventano viola.
In sintesi, questo indicatore utilizza i colori per visualizzare le condizioni di mercato e aiutare l’utente a entrare e uscire dal mercato in base alla volatilità.
Se ti piace questo indicatore mettimi un boost e lascia un commento!! Grazie!

Volume DockThis oscillator has two different modes:
The first one called RSIs is a comparison between the Relative strength index of the Accumulation/Distribution (and the On Balance Volume) and the normal price, to analyze the differences in momentum between the price with volume and without.
The second one, called Dock, is similar except for the fact that the lines are smoothed using the hull moving average formula, this mode is great to signal entries and for reversal analyzing.

BE - OBV MACD█ Overview
BE - OBV MACD - Algo Trading is an indicator developed to analyze volume , MACD and PSAR simultaneously in order to understand how they are co-related to each other. This tool calculates the likelihood of strength for buying or selling within the market direction.
█ Calculations
The algorithm individually computes the likelihood of flow of volumes (OBV, MACD & PSAR). A positive score is assigned for events where the Buyers volume is rising over the candle, MACD on the price is rising and MACD on the OBV is providing positive output and the PSAR is Below the close price thus generating the Buy Signal, and a negative score for the vise versa thus generating the Sell Signal.
Note: Since this indicator is an overlay indicator MACD and OBV is not shown on the chart. One can add them on the chart if you wish to analyze the impact of the same.
█ Settings
Customization of settings is possible for risk management concepts like setting the initial SL level, Trail SL Level, Day Max Level.
Hide or Show plots and Table is possible from the indicator settings.
-----------------
Disclaimer
The information contained in my Scripts/Indicators/Ideas/Algos/Systems does not constitute financial advice or a solicitation to buy or sell any securities of any type. I will not accept liability for any loss or damage, including without limitation any loss of profit, which may arise directly or indirectly from the use of or reliance on such information.
All investments involve risk, and the past performance of a security, industry, sector, market, financial product, trading strategy, back-test, or individual's trading does not guarantee future results or returns. Investors are fully responsible for any investment decisions they make. Such decisions should be based solely on an evaluation of their financial circumstances, investment objectives, risk tolerance, and liquidity needs.
My Scripts/Indicators/Ideas/Algos/Systems are only for educational purposes!

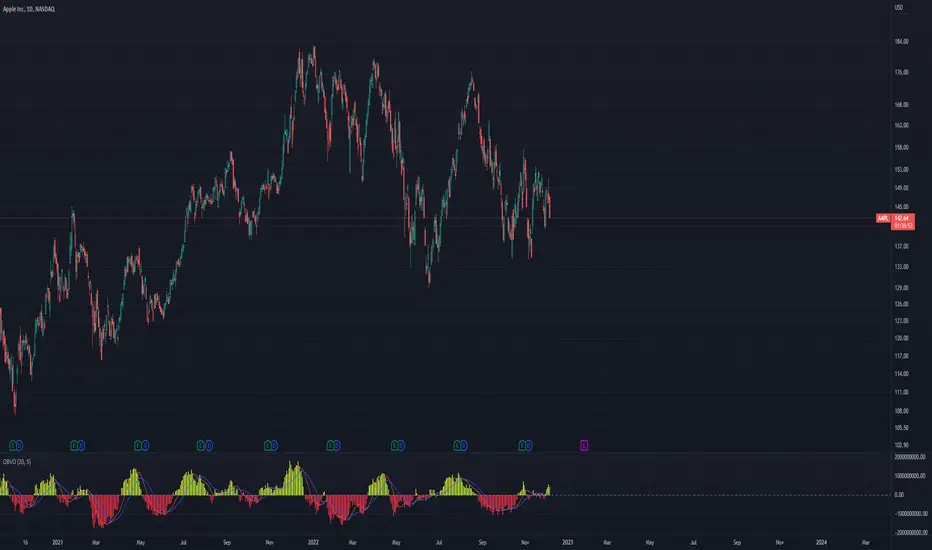
OBV-MACDThe OBV-MACD indicator is a momentum-based technical analysis tool that helps traders identify trend reversals and trend strength. This Pine script is an implementation of the OBV-MACD indicator that uses the On-Balance Volume (OBV) and Moving Average Convergence Divergence (MACD) indicators to provide a momentum data of OBV.
The OBV-MACD indicator uses the OBV to calculate the cumulative volume, which is then smoothed using two moving averages - fast and slow. The difference between these moving averages is plotted as a histogram, with a signal line plotted over it. A buy signal is generated when the histogram crosses above the signal line, indicating a bullish trend, while a sell signal is generated when the histogram crosses below the signal line, indicating a bearish trend.
This Pine script also includes an OBV-MACD-Donchian version that incorporates Donchian channels for the OBV-MACD. The Donchian channel is a technical analysis indicator that helps traders identify the highs and lows of an asset's price over a certain period. The OBV-MACD-Donchian version uses the OBV-MACD indicator along with the Donchian channels to provide signals that the momentum of OBV is making new high/low during that period of time.
Traders can customize the input parameters of the OBV-MACD indicator, such as the timeframe, method of calculation for the moving averages, and the lengths of the moving averages and breakout lengths. The colors of the plot can also be customized to suit the trader's preferences.

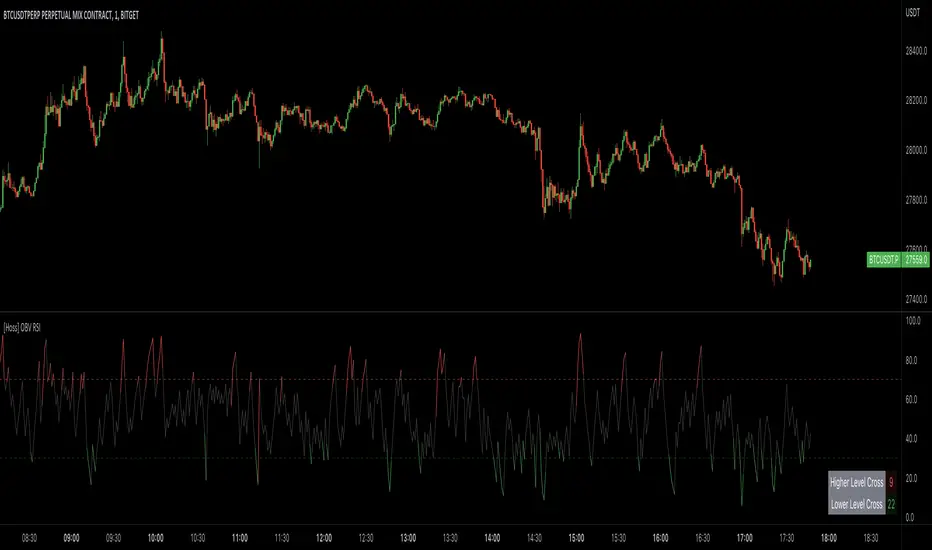
[Hoss] OBV RSIThe OBV ( On Balance Volume ) RSI ( Relative Strength Index ) indicator is an innovative tool that combines the power of OBV and RSI to provide traders with a comprehensive view of the market's momentum and volume dynamics. This combination enables users to make better-informed trading decisions by analyzing the relationship between price, volume , and relative strength .
The script starts by calculating the On Balance Volume , which is a cumulative volume-based indicator that measures buying and selling pressure. The OBV increases when the closing price is higher than the previous closing price and decreases when the closing price is lower than the previous closing price. This helps traders identify potential price trend reversals based on volume accumulation or distribution.
Next, the script computes the Relative Strength Index ( RSI ) based on the OBV values, offering a unique perspective on the market's momentum through the lens of volume . The RSI is a popular momentum indicator that ranges from 0 to 100 and helps traders identify overbought and oversold conditions. In this script, the user can define the RSI length and the higher and lower levels (default values are 70 and 30, respectively).
A distinctive feature of this OBV RSI indicator is the addition of a monitor that counts the number of times the RSI crosses above the higher level and below the lower level within a user-defined lookback period. This monitor is displayed as a table in the bottom right corner of the chart and can be enabled or disabled through an input option.
The cross count monitor provides valuable insights into the historical frequency of RSI crossings, helping traders to identify potential trading opportunities based on historical price behavior around these levels.
Multiple Divergences - Candle Edition - Libertus█ OVERVIEW
This script will help you track multiple indicator divergences in an easy, clean, and very visible way. Currently supported indicators at the time of script publishing are the Relative strength index (RSI) and On balance volume (OBV). If you have suggestions on which other popular indicators to add, leave them in the comments or message me directly.
You can track divergences manually, but it's time-consuming, you can easily miss them and if you want to track it on more than one indicator it will consume a lot of your screen space.
The script is using my time-tested divergences code, loved by a lot of TradingView users. If you want to use RSI divergences code in your scripts, you can find it in my Relative Strength Index - Divergences - Libertus indicator .
This script continues to improve on my popular RSI Divergences - Candle Edition - Libertus .
█ USAGE
In short, divergences occur between price and indicator. When the price makes a new high or low, but the indicator doesn't make a new high or low. Please check Investopedia for a more detailed explanation of RSI and OBV divergences.
BULL marks bullish divergence, which means the price made a new low, but the indicator value still hasn't made a new low. It can indicate a bullish trend change.
BEAR marks bearish divergences, which means the price made a new high, but the indicator value still hasn't made a new high. It can indicate a bearish trend change.
PIVOT is the highest or lowest price (candle) in the lookback period.
ALERTS are available for all PIVOTS and divergences, including candles with multiple divergences.
█ SETTINGS
HIDE PIVOT - ON by default, hides pivots.
SHORTER LABELS - OFF by default, removes text from BEAR / BULL labels.
HIDE LABELS AND COLOR BACKGROUND - OFF by default, hides labels completely and colors chart background.
LOOKBACK PERIODS - number of candles script will check in history for the pivot.
Hopefully, this indicator will help you in your trading. Good luck!

The On Balance Volume & Accumulation Distribution RibbonMedic trades using "Smart Money Concepts", and Medic's system revolves around the one taught by MentFX (i.e. Structure, Supply/ Demand Zone , and Confirmation). While this system per se doesn't require the use of a volume indicator, Medic has come to respect the OBV and Accumulation / Distribution .
The OBV Ribbon is available in many a shape and form, but Medic wanted something more responsive, and the OBVAD is just that.
This ribbon works across all time frames, and allows users to visualize what is happening behind the scenes of The Trigger indicator.
The Ribbon applies 11 DEMA of different periods to the cumulative sum of SpaceTrader's OBV/AD formula: volume*(close-open)/( high-low )*hlc3.
The Ribbon is able to identify the general trend, and changes into a blu ein an uptrend, and purple in a downtrend, and also potential reversals by means of divergences.

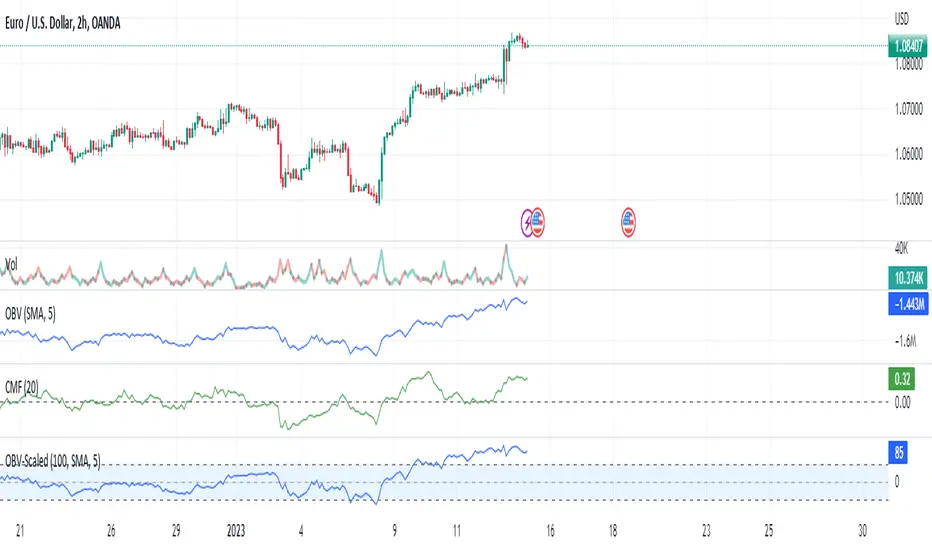
On Balance Volume Scaled - OBV ScaledThe main idea of this oscillator is to place the OBV oscillator and its oscillation around the range of 0 and around -50 to +50 and for this scaling of the "On Balance Volume" oscillator, I have used Min-max normalization.
Since this oscillator does not have a specific minimum and maximum, just setting the maximum and minimum does not seem the best thing to do. As in this case, we will constantly observe sudden changes and we will have problems such as volatility. On the one hand, we will constantly deal with sudden changes and problems such as volatility. Also on the other hand, the continuous collisions of the high/low(+50 & -50) and index and returning from that is another thing that we are going to deal with.
Therefore, to solve these problems and create more flexible maximum and minimum ranges, another similar method has been used. Choosing the maximum of our normalization to the size of the moving average of 100 candles of the index maximum and choosing the minimum of normalization to the size of the moving average of 100 candles of the minimums of the OBV index, and then normalizing the OBV index with the Min-max method with those ranges, is the recommended method ,which has been used to eliminate problems. In this case, we will not have any problem hitting 50 and returning or hitting -50 and returning. Also, our scaled OBV index will have the ability to touch and cross 50 and -50 and can fluctuate without problems.
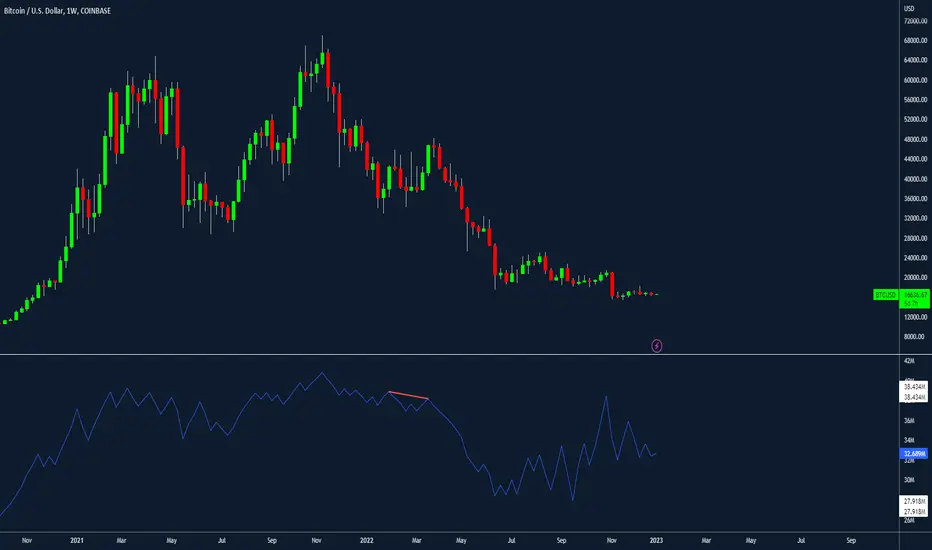
Aggregated OBVWhat is it?
This OBV is a replacement for previous scripts i have issued which produced a combined OBV for Bitcoin and ETH using multiple exchanges.
When combined volume is selected, it will pick up volume across major crypto exchanges and use them together to produce a combined OBV.
There is also the added functionality of enabling users to choose the quoted price rather than the volume of coins traded.. i.e. showing the USD impact (or whatever the denominator currency is)
There is also the added function of divergences added.
The combined volume function will only work for crypto exchanges - de-select if not reviewing crypto
The quote price will work for any asset selected.
Other than the additional functionality, the indicator should be used in TA as per normal OBV analysis.
Exchanges Considered:
BITFINEX
COINBASE
BITSTAMP
KRAKEN
BINANCE
GEMINI
HOUBI
KUCOIN
OKEX
BITTREX
Thanks to eAkosKovacs for help in making the code more robust.
On Balance Volume CrossoversCheck on balance volume but with crossover. You can choose the smoothing method, which is set by default to use the Volume Weighted Moving Average (bringing volume to the equation is always a good idea) but you can change to SMA, MA, EMA, ...
Hope you guys enjoy it and don't forget to rate it up! :)
I plan to include % from 0-100 OBV in here later! Stay tuned.
Feedback is cool.
Custom OBV OscillatorThis is a modified OBV indicator that creates an oscillator by smoothing the difference between the value of the OBV and a short moving average of the OBV. SMAs of the oscillator are also provided to study crosses and convergence/divergence.
The indicator should mostly be used on common stock, but works on futures contracts with some tuning and a shorter timeframe.
GIRISH indicatorHello traders,
This indicator is the enhancement to my previous indicator (RSI+OBV). There is combined RSI and OBV with DMI. This new indicator is combination of RSI and OBV with VWAP . I have been using this indicator for intraday trades in NIFTY & BANKNIFTY .
The white line indicates the movement of VWAP wrt current price. There default range for this has been defined as -40 to 40 .
Entry for long: When white line goes below -40, we need to wait for green background. Entry has to be taken when green background appears. If price goes below the entry point, averaging can be done once. Price will surely go long and give us good profit.
Entry for short: When white line goes above 40 , we need to wait for red background (if darker red comes, it is better) . Entry has to be taken when red background appears. If price goes above the entry point, averaging can be done once. Price will surely go down and give us good profit on short side.
PS: Please do back testing in chart before taking trades.

Cheat Code's RedemptionWELCOME TO THE CHEAT CODE REDEMPTION PACK!!!!
I want to take a deep dive into what this indicator consists of and how you can use it to improve your trading strategy.
-What does the CCR consist of?
The Oscillator:
The oscillator is a combination of a true strength index sampled from on-balance volume and a regular RSI at default settings. The reason I added the on-balance volume is that it does not tend to remain at overbought or oversold conditions as traditional momentum oscillators do.
The Histogram:
The histogram is copied to a tee from the MACD histogram, the only difference here is that I extended the moving averages to depict a special pairing; the ema55 slow and ema21 fast. I then converted it into another true strength index, as the calculations fit all time frames.
The Divergences:
The divergences of an indicator can be extremely useful in catching scalp opportunities, a DARK RED/GREEN represents a REGULAR divergence, while a SALMON/LIGHT GREEN color represents a HIDDEN divergence.
The moving average:
The moving average built into this indicator is depicted as an aqua or yellow line, when the oscillator is moving in an uptrend, the moving average will appear aqua, when the oscillator is in a downtrend it will appear yellow. Use this as confirmation bias or as the third derivative of market position.
Oscillator Colors:
The Oscillator color is an important thesis of this indicator. When the line is green, it means the market is effectively in an uptrend, when it is red, it means the market is in a downtrend. Use this to prevent longing in a serious downtrend and vice versa.
If you have any questions regarding the indicator(s), feel free to reach out to me in the comments or through Direct Message!!!
Safe Trading, Don't get Rekt
- CheatCode1 <3

Multi-Indicator Divergence ScreenerHere is a new screener for everyone.
I have applied my Better Divergence On Any Indicator logic to scan 3 different indicators and up to 6 different assets at one time. Shoutout to LonesomeTheBlue and QuantNomad for their respective work on divergence and scanner scripts. I've implemented similar logic to put together this scanner.
So far, I have added support for RSI, OBV, MACD, MFI, Stochastic, and FSR, though I'm happy to add more by request. Please note, for simplicity, I have removed the logic to filter for only overbought/oversold divergences. Because this can scan both centered oscillators and non-centered indicators, overbought/oversold does not apply to all of them. I may try to find a way to work in back in later, as time allows.
Personally, I like to find confluences different types of indicators. For instance, agreeable divergence with a centered strength oscillator like RSI and a volume based indicator like OBV gives me more confidence that there will be follow-through.
Like in the Better Divergence script, you can opt to scan for confirmed divergences, potential divergences, or both.
You have the option to show or hide a table that will tell you exactly which assets have divergence, on which indicator they were found, and how many points of divergence were identified. By default, bull divergences will be green, bear will be red, but you can change these base colors to your liking. Confirmed divergences are shown with a solid background, while potentials (if selected) are shown with transparent background. If all 3 of your chosen indicators have divergence in the same direction, the asset name will show in the bull or bear color to highlight the confluence.
Alerts have also been set up to fire on bar close. The message will essentially tell you the same thing the table does, but in condensed format.
You can choose to have alerts fire any time there is any divergence detected across all assets, only when there are divergences on at least 2 of the chosen indicators for a given asset, or limit them to only when all 3 indicators show divergence in agreement.

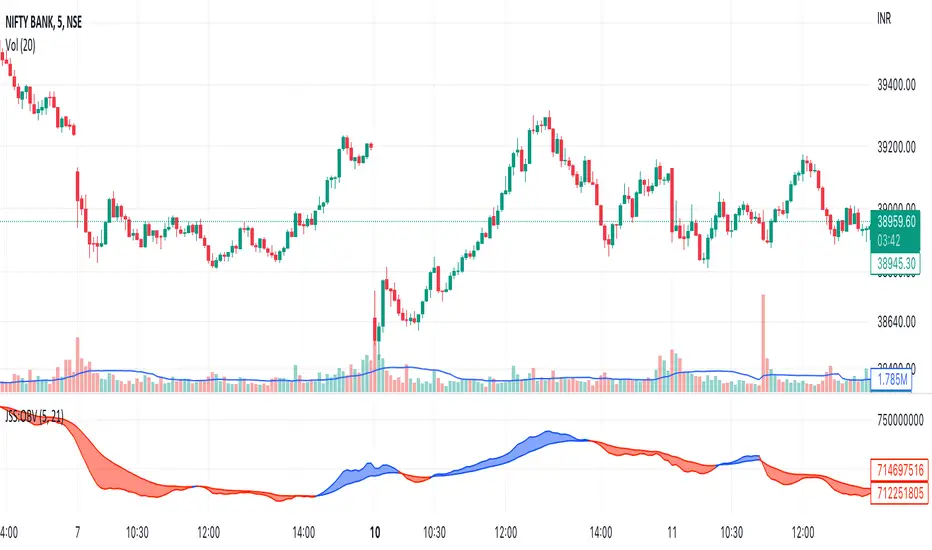
JSS: On Balance Volume//Date: 11-Oct-22
//Author: Jatinder Sodhi
OBV Indicator with colour coding.
Blue - Long
Red - Short
Best used for Intraday on 5 minute charts. Works well on other timeframes as well.
@Inspired by Asit Baran's RankDelta:OBV Indicator
//Not an exact replica as I have found one line correctly ema(obv,21)
//Whereas second line ema(obv,5) corresponds closely with Asit's indicator values but not exact.
//Advisable to use along with my RSI indicator based on Asit Baran's RankDelta:RSI indicator.
filbfilbs Better OBVThis indicator looks at the delta on the buying and selling volume of customizable lower timeframes to the timeframe selected and cumulates the delta between the buying and selling of those candles.
For example on a 4-hour chart, it will look at the 1 min timeframes and consider the delta by LTF candle, ranter than the summised view on the 4-hour.
In essence, it is trying to replicate CVD using time and price data without the order book, it becomes a "better, lower timeframe based, customizable OBV"
It also prints divergence as squares above or below the chart, where, for example, there would be buying on LTFs but the HTF candle closes red, this would be shown as bearish divergence.
Credit to Trading view and their up / down indicator, which this is a derivative of.
Any questions please ask!
RSI+OBVthis strategy works on the basis of crossovers of RSI at different period and OBV at different periods (separately). I am using it for Nifty and Bank Nifty. Entry for long can be taken when green bar appears; and exit has to be done when it disappears. Entry for short has to be taken when red bar appears; and exit has to be done when it disappears.
With little help from price action good results can be achieved.

Moving Average Convergence Divergence On Alter OBVOBV:
The OBV is perfect indicator to understand the strength of the particular stock. As the strength increase, the trend of the stock goes high along with price. But, the OBV is considered only with close of previous close which is to make sure the double confirmation on the price to accumulate the volume.
Altered OBV:
So, here is the altered OBV, which basically consider the close of previous close and also buying interested of the day when close is higher than open.
MACD:
I always admire the magic of MACD with pre-defined timeframe. Now, this MACD applied on top of altered OBV to signal us the moving of the ticker strength.
I hope the another MACDAltOBV would help on your swing trading strategy.
Happy Investing.

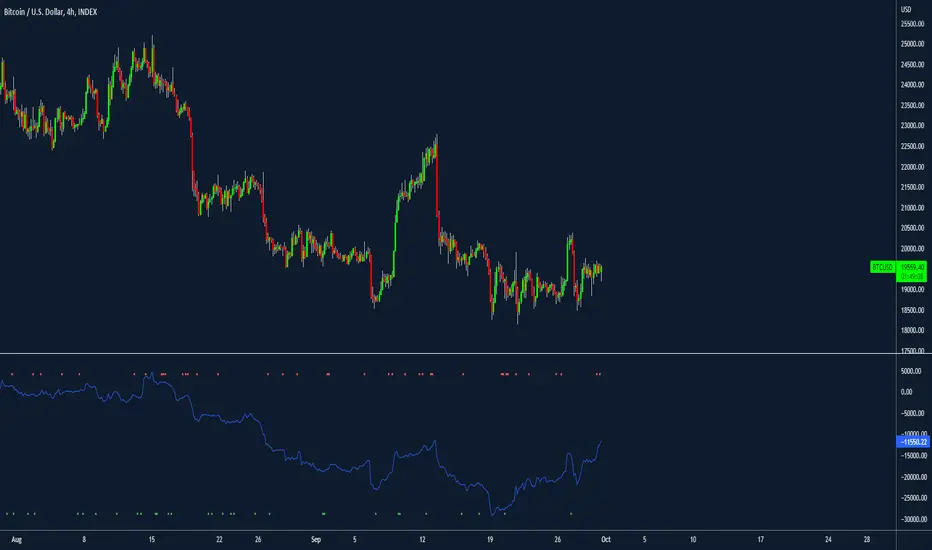
On Balance Volume DeviationThe objective of this indicator is to be a leading indicator that can detect a large price change before it happens. It is based on the On Balance Volume (OBV) indicator, which is a leading indicator based on the premise that a large change in volume often precedes a large price change. This indicator charts the N-Period deviation of the OBV data and displays it as a histogram. This is overlayed on an area chart of the M-Period SMA of the histogram data. This combination helps to visually enhance the pattern that signifies that a jump in price is about to happen.
Useage:
When the histogram bars are above the area plot, then a jump in price is about to happen
As with all leading indicators, there are a lot of false signals. Confirm with price action or another indicator
The further the histogram bars are above the area plot, the larger the predicted jump in price
It seems to work better on shorter intraday timeframes than on the longer timeframes
At the close of a market session, it is a good indicator of how much the price will jump on the opening of the next market session.

OBV ScalingOBV Scaling Indicator
Objective - Use for executed order
Description - OBV Scaling is the introduction of obv to scaling it into 1 Standard deviation. Since the obv scaling in general has a wide distribution of data, we need to scaling the data to reduce fragmentation.
Applications - The principle of OBV Scaling is to use it as an executed order when the value of the OBV scaling crosses EMA of OBV Scaling.
Recommendation - OBV Scaling should be used in conjunction with indicators used to filter trend. for example Supertrend, Parabolic Sar

OBV CSI [mado]This Indicator shows you the strength of the Currency based OBV RSI.
If the Currency label is on the top, it is strong, if it is on the bottom, it is weak
use sample image
I use 1 chart just for OBV CSI :)

Stochastic Slow and OBV Percent Oscillator
Purpose - Stochastic is the best momentum indicator and On Balance Volume (OBV) is the best volume indicator. Why not combine both to come up with a more sophisticated oscillator?
How It's Done - I had to put OBV as an oscillator (returning values between 0 and 100) in order to put it in the same pane with the slow stochastic oscillator. Otherwise, their synergy won't be that great. So, I have decided to visualize OBV as a percentage relative to selected period's high and low value. That way, I can keep the OBV value to stay within boundary.
Interpretation
1. Dot color indicates the whether the stochastic K/OBV is over or below the stochastic D/Signal line.
2. When Stoch and OBV are moving in the same direction and are close together (on top of each other), this indicates a strong trend
3. When Stoch crosses up or down the OBV oscillator, it may indicate a trend reversal
