Apex Wallet - Opening Range Breakout (ORB) & Session LevelsOverview The Apex Wallet Opening Range Breakout (ORB) is a professional intraday tool designed to capture the volatility of the first minutes of the trading session. By defining a clear range at the market open, this indicator provides traders with high-probability breakout levels and psychological targets based on mathematical extensions of the initial move.
Core Mechanics
Customizable Session: Easily define your preferred opening range duration (e.g., first 5, 15, or 30 minutes) and session start time.
Dynamic Timezone Adjustment: Includes a built-in UTC offset feature to ensure session times align perfectly with your local market, regardless of where you are trading from.
Automated Level Tracking: The script automatically identifies and locks the high and low of the specified opening period.
Key Features:
Psychological Mid-Lines: Calculates the 50% median of the range (ORB Mid) as a pivot point for trend strength.
Advanced Volatility Extensions: Plots internal and external targets (High+Mid, Low+Mid) to identify potential exhaustion zones or secondary breakout levels.
Intraday Optimization: Designed specifically for low-timeframe traders (1m to 15m) looking for clear execution zones at the bell.
How to use: Wait for the opening range to be established. A breakout above the ORB High often indicates bullish dominance, while a break below the ORB Low suggests bearish momentum. Use the internal extension lines as take-profit targets or areas to move your stop-loss to breakeven.
Openingrange

15 Zaman Kutusu ve 10 Zaman Acilisi15 Range Boxes & 10 Open Lines
This indicator is a comprehensive technical analysis tool designed to track specific time intervals (Sessions, Killzones) and critical opening prices on your chart.
Key Features:
15 Custom Range Boxes: Individual settings for color, time, and labels.
10 Open Price Lines: Track daily, weekly, or session opens.
Smart History Limit: "Son X Kutuyu Goster" feature preventing lag and flickering.
Pips Display: Automatically calculates and displays the range width in pips.
Minimalist Mode: Hides details when "Cok Kucuk" label size is selected.
Language: Fully Turkish menu settings.
Note: Inspired by Nephew Sam's concept, coded from scratch with performance optimizations and additional features.
DISCLAIMER This indicator is for educational purposes only. It does not constitute financial advice or trading signals. Use at your own risk.

ORB + Key Session Levels (QC)Overview
A comprehensive session-based levels indicator that plots Opening Range Breakout (ORB) levels alongside key session highs and lows from Asian, London, and New York trading sessions.
Features
• Opening Range Breakout (ORB) with configurable duration (5m/15m/30m/1hr/custom)
• Previous Day High/Low with two modes: RTH Only (9:30-4:00 ET) or Full Session (6pm-5pm ET for futures)
• Asian, London, NY AM, and NY PM session levels
• Kill Zones mode (non-overlapping) vs Full Sessions mode
• Fair Value Gap detection with optional mitigation removal
• HTF Bias dashboard showing market structure
• Lines extend from the exact candle where highs/lows occurred
• Alerts for all level breaks
Kill Zone Defaults (ET)
• Asian: 8:00 PM - 12:00 AM
• London: 2:00 AM - 5:00 AM
• NY AM: 8:30 AM - 11:00 AM
• NY PM: 1:30 PM - 4:00 PM
How To Use
1. Select Session Mode (Kill Zones or Full Sessions)
2. Choose PDH/PDL Source (RTH for equities, Full Session for futures)
3. Customize session times as needed
4. Set up alerts for level breaks
All times are in Eastern Time (ET) and fully customizable.
This indicator is for educational purposes only. Not financial advice.

ORB (x2) by jaXn# ORB (x2) Professional Suite
## 🚀 Unleash the Power of Precision Range Trading
**ORB (x2)** isn't just another breakout indicator—it is a complete **Opening Range Breakout workspace** designed for professional traders who demand flexibility, precision, and chart cleanliness.
Whether you are trading Indices, Forex, or Commodities, the Opening Range is often the most critical level of the day. This suite allows you to master these levels by tracking **two independent ranges** simultaneously, giving you a distinctive edge.
## 🔥 Why choose ORB (x2)?
Most indicators force you to choose one specific time. **ORB (x2)** breaks these limits.
### 🌎 1. Multi-Session Mastery (London & New York)
Trade the world's biggest liquidity pools. Set **ORB 1** for the **London Open** (e.g., 03:00–03:05 EST) and **ORB 2** for the **New York Open** (09:30–09:35 EST). Watch how price reacts to London levels later in the New York session.
### ⏱️ 2. Multi-Strategy Stacking (The "Fractal" Approach)
This is a game-changer for intraday setups. Instead of two different times, track **two different durations** for the *same* open.
* **Setup:** Configure **ORB 1** as the classic **5-minute range** (09:30–09:35).
* **Setup:** Configure **ORB 2** as the statistically significant **15-minute or 30-minute range** (09:30–10:00).
* **Result:** You now see immediate scalping levels *and* major trend reversals levels on the same chart, automatically.
### 🎯 3. "Plot Until" Tech: Keep Your Chart Clean
Sick of lines extending infinitely into the void?
Our exclusive **"Plot Until"** feature separates the signal from the noise. You define exactly when the trade idea invalidates.
* *Example:* Plot the 09:30 levels only until 12:00 (Lunch).
* The script intelligently cuts the lines off at your exact minute, ensuring your chart is ready for the afternoon session without morning clutter.
### ⚡ Precision Engine
We use a dedicated "Precision Timeframe" input. Even if you are viewing a 1-hour or 4-hour chart to see the big picture, ORB (x2) can fetch data from the **1-minute** timeframe to calculate the *exact* high and low of the opening range. No more "repainting" or guessing where the wick was.
## 🛠 Feature Breakdown
* **Dual Independent Engines:** Fully separate Color, Style, Time, and Cutoff settings for both ORB 1 and ORB 2.
* **Absolute Time Cutoff:** Lines obey day boundaries perfectly. A cutoff at 16:00 means 16:00, not "whenever the next bar closes".
* **Style Control:** Visually distinguish between your "Scalp" ORB (e.g., Dotted Lines) and your "Trend" ORB (e.g., Solid Thick Lines).
* **Performance Mode:** Adjustable "Lookback Days" limits history to keep your chart lightning fast.
## 💡 Configuration Examples
**The "Double Barrel" (Standard Stock + Futures)**
* *ORB 1:* `0930-0935` (5 min) - The immediate reaction.
* *ORB 2:* `0930-1000` (30 min) - The institutional trend setter.
**The "Transatlantic" (Forex/Indices)**
* *ORB 1:* `0800-0805` (London Open) - European liquidity.
* *ORB 2:* `1330-1335` (NY Open) - US liquidity injection.
## ⚠️ Disclaimer
Trading involves substantial risk. This tool helps visualize critical price levels but does not guarantee profits. Always combine with proper risk management and your own analysis.

Opening Range {basic}Introduction
Opening range {basic} is a clean and reliable indicator designed to help traders visualize the opening range of a trading session with minimal setup and visual clutter.
This version focuses on the core components of opening range analysis, making it ideal for traders who want a simple, effective framework for identifying early-session structure across futures, forex and crypto markets.
Description
The indicator automatically calculates the opening range high, low and midpoint over a user-defined opening window (5m, 15m, 30m or 60m) within a selected trading session (default: NY session).
During the opening range window, the indicator dynamically tracks price to form the range. Once the opening range is complete, the high, low and midpoint are extended forward for the remainder of the session, providing clear reference levels that can be used for bias, mean reversion or breakout-based decision making.
A shaded fill highlights the opening range area, with an optional size display showing the total range in price units. Styling and logic are intentionally simplified to keep the chart clean and easy to interpret.
Features
Configurable opening range length
Choose between 5m, 15m, 30m or 60m opening ranges.
Session-based calculation
Opening range is calculated only within the selected trading session.
Opening range levels
Opening range high, low and midpoint.
Range fill & size display
Shaded fill between the opening range high and low.
Text showing total opening range size.
Clean, minimal design
Fixed line styles and thickness for clarity.
Dark and light theme support.
Minimal settings for fast, intuitive use.
Optimized performance
Designed for intraday timeframes compatible with the selected opening range length.
Terms & Conditions
This indicator is provided for educational and informational purposes only and does not constitute financial advice.
Trading involves risk and past performance is not indicative of future results.
The user assumes full responsibility for any trading decisions made using this indicator.

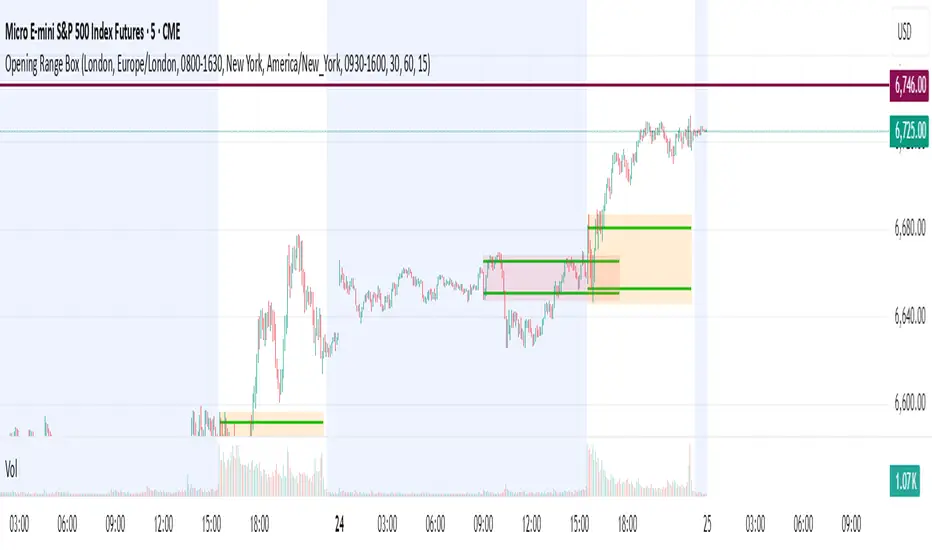
Opening Range BoxOPENING RANGE BOX + LEVELS (RTH)
OVERVIEW
This indicator draws the Opening Range for the U.S. Regular Trading Hours session starting at 9:30 AM New York time. It plots the Opening Range High, Low, and Midpoint, and can extend those levels for the rest of the session. It also displays the Opening Range size in points and ticks.
WHAT IT DRAWS
• Opening Range box for the first N minutes of RTH (ex: 5, 10, 15)
• OR High (ORH)
• OR Low (ORL)
• OR Midline (midpoint of ORH/ORL)
• Opening Range value label (range in points + ticks)
KEY FEATURES
• Time-anchored drawings (bar_time) so levels stay accurate on any intraday timeframe
• Configurable Opening Range length in minutes
• Configurable box fill/border colors
• Independent styling for OR High / OR Low / Midline (color, width, line style)
• Line extension modes:
Line extension modes
- To RTH Close
- Right Forever
- For N Minutes
- None
Optional label placement to the LEFT of the Opening Range so it doesn’t block new candles
Option to keep previous sessions’ Opening Ranges visible for context
BEST FOR
• Futures: ES / NQ / MNQ (and other RTH-based products)
• Intraday stocks and ETFs
• OR breakout, rejection/fade, and mean reversion workflows
NOTES
• Intended for intraday charts
• Opening Range is calculated strictly inside the selected time window (no extra bars)
• Session is America/New_York, 09:30–16:00

Opening Path Selector (EMA200 Context Tool)📝 Description
Opening Path Selector is a context-based indicator designed to help traders quickly identify which asset may offer the cleanest directional path at the market open.
This tool does not generate entry or exit signals.
Its purpose is to reduce decision fatigue during the first minutes of the session by ranking a small set of high-liquidity assets based on higher-timeframe EMA200 structure.
🔍 What this indicator evaluates
The dashboard compares a predefined group of major symbols and ranks them according to:
• Proximity to the nearest EMA200
• Relative position versus higher-timeframe EMA200 levels
• Directional context inferred from EMA structure
The result is a priority-based list that highlights which asset may present:
• Less immediate EMA resistance
• Clearer directional context
• Lower probability of early-session chop
📊 How to read the dashboard
• Priority – Ranking based on opening context
• Symbol – Evaluated instrument
• Nearest EMA200 – Distance and side relative to price
• Possible Path – Direction with less immediate EMA resistance
• Bias – Strength of the higher-timeframe context
Colored markers are used to provide fast visual identification of the highest-priority assets.
⚠️ Important notes
• This is a context and selection tool, NOT a trading system
• No buy/sell signals, alerts, TP, or SL logic are included
• Designed to be used alongside your own execution methodology
🔧 Compatibility
Due to Pine Script multi-symbol and multi-timeframe constraints, this public version is intentionally limited to a small set of symbols.
TradingView Pro / Premium or higher is recommended for consistent performance.
🔗 Complementary tools
This indicator can be complemented with Multi-Tool VWAP + EMAs (Multi-Timeframe) + Key Levels , which provides detailed visibility of multiple EMA levels, VWAP structure, and higher-timeframe reference zones directly on the chart.
While Opening Path Selector helps decide which asset to focus on at the open, the complementary tool can assist with in-chart context and confirmation once an asset has been selected.
Both tools are designed to serve different stages of the decision process and can be used independently.

Session Opening Bar RangeSession Opening Bar Range (OBR) - Advanced Opening Range Indicator with Statistical Analysis
Overview
The Session First Bar Range (FBR) indicator is a comprehensive tool that captures and projects key levels based on the first bar of a user-defined trading session. Unlike traditional daily opening range indicators, this script allows traders to focus on specific session windows (New York RTH, London, Asia, etc.) and analyze price behavior relative to the initial momentum established in that session's opening bar.
What makes this indicator unique is its combination of three distinct projection methodologies: statistical analysis based on historical range data, Fibonacci extensions, and fixed-point rotation levels commonly used by institutional traders. To our knowledge, this is the only opening range indicator that incorporates statistical standard deviation levels calculated from historical first bar ranges, making it both a technical and probabilistic tool.
Core Concept
The opening range concept is based on the principle that the initial price action of a trading session often sets the tone for the remainder of that session.
Professional traders have long observed that:
The first bar's high and low act as key reference points
Price often respects or breaks these levels with significance
Expansion beyond the opening range tends to occur in measurable increments
This indicator takes these observations and enhances them with:
Historical probability analysis - "Based on the last 60 sessions, price typically extends X standard deviations beyond the opening range"
Proportional projections - Fibonacci-based extensions showing where measured moves typically target
Fixed-point rotations - Institutional rotation levels (e.g., 65 points for NQ, 15 points for ES)
How It Works
Session Detection & First Bar Capture
The indicator uses Pine Script's time() function with timezone support to precisely detect when a trading session begins. When the first bar of the selected timeframe occurs within the session window, the script captures:
High (H): The high of the first bar
Low (L): The low of the first bar
Mid (M): The midpoint (hl2) of the first bar
Critical Detail: These levels are fixed from the first bar only - they do not update as the session progresses. This differs from many "opening range" indicators that use a time period (e.g., first 30 minutes). Here, you select the bar timeframe (default 5-minute), and only that single first bar's range is captured.
Statistical Level Calculation
The indicator maintains a rolling array of the last N session's first bar ranges (default: 60 sessions). For each new session, it calculates:
Average Range: Mean of historical first bar ranges
Standard Deviation: Volatility of those ranges
Projection Levels: High/Low ± (Average Range + Std Dev × Multiplier)
This provides probability-based levels. For example, a +2σ level suggests: "Historically, price extending this far beyond the opening range is a 2-standard-deviation event (approximately 95th percentile)."
Fibonacci Extensions
Using the first bar range as the base unit (100%), the indicator projects Fibonacci levels:
100% extension: One full range above the high / below the low
1.618x extension: (Default) Golden ratio projection
2.618x, 3.618x extensions: Additional Fibonacci levels
Calculation: Range = H - L, then Target = H + (Range × Multiplier) for upside projections.
OR Rotation Levels
These are fixed-point increments from the first bar's high and low. Unlike percentage-based methods, rotations use absolute point values:
NQ traders often use 65-point increments
ES traders often use 15-point increments
Gold/bonds use different values
The indicator draws 5 levels above the high (R+1 through R+5) and 5 below the low (R-1 through R-5), each separated by your specified point increment.
Features:
Session Options
Pre-configured Sessions:
New York RTH (9:30am - 4:00pm)
New York Futures (8:00am - 5:00pm)
London (2:00am - 8:00am)
Asia (7:00pm - 2:00am)
Midnight to 5pm
ZB/Gold/Silver OR (8:20am - 4:00pm)
CL OR (9:00am - 4:00pm)
Custom Session: Define your own start/end times in HHMM format
Timezone Support: All sessions respect the selected timezone (default: America/New_York)
Customizable Timeframe
Select any timeframe for the first bar (1min, 5min, 15min, etc.)
Default: 5-minute bars
Important: This is the timeframe for the first bar capture, independent of your chart's timeframe
Display Options
Historical Ranges: Show/hide past session ranges (with configurable limit to manage performance)
Line Styles: Choose between Solid, Dashed, or Dotted for range lines and midline
Label Position: Left or Right side of range
Show Prices: Optionally display actual price values on labels
Custom Colors: Fully customizable colors for all components
Statistical Levels
Lookback Period: Number of historical sessions to analyze (default: 60)
Two Multiplier Levels: Default 1σ and 2σ, fully adjustable
Separate styling: Different line styles (dashed vs dotted) for each sigma level
Optional Labels: Show/hide sigma notation labels
Fibonacci Extensions
Four Extension Levels: 100%, 1.618x, 2.618x, 3.618x (all customizable)
Bidirectional: Projections both above and below the opening range
Optional Labels: Toggle percentage/multiplier labels
OR Rotation Levels
Configurable Increment: Set the point value for your instrument
Five Levels Each Direction: R±1 through R±5
Dynamic Labels: Show both rotation number and point value (e.g., "R+1 (65)")
Three Line Styles: Solid, Dashed, or Dotted
How to Use
Setup
Add the indicator to your chart
Select your trading session from the dropdown
Set the timeframe for first bar capture (typically 5-15 minutes)
Configure which projection methods you want to see (Statistical, Fibonacci, and/or Rotations)
For Day Traders
Scenario: Trading NQ during New York RTH
Session: Select "New York RTH (9:30am - 4:00pm)"
Timeframe: 5-minute (captures 9:30-9:35 bar)
Enable: OR Rotations with 65-point increments
Strategy:
Watch for acceptance/rejection at rotation levels
Use R+1/R-1 as initial profit targets
R+2/R-2 as extended targets
Statistical levels show when price is in "outlier" territory
and rotation levels
Performance Notes
The indicator limits objects to stay within TradingView's constraints (500 max)
If you enable all features, reduce "Maximum Historical Ranges" to prevent slowdown
Typical configuration: 10-20 historical ranges with all features enabled works well
Settings Guide
Session Settings
Session: Choose from pre-configured sessions or "Custom"
Custom Session Start/End: HHMM format (e.g., "0930" for 9:30am)
Timezone: Critical for accurate session detection
Opening Bar Format
Timeframe: The bar size for capturing the first bar's range
Show Midline: Toggle the mid-point line
Show Historical Ranges: Display previous sessions (recommended: leave ON)
Maximum Historical Ranges: Limit history to manage performance (1-500)
Range Style / MidLine Style: Solid, Dashed, or Dotted
Position: Label placement (Left or Right)
Show Prices: Include actual price values on labels
Statistical Levels
Lookback Periods: How many historical first bar ranges to analyze (default: 60)
Std Dev Multiplier 1/2: The sigma levels to project (default: 1.0 and 2.0)
All visual settings (colors, line width, label size)
Fibonacci Extensions
Show Fib Extensions: Enable/disable Fibonacci projections
Measured Move Extensions 1-4: The multipliers (default: 1.618, 2.618, 3.618, 4.618)
Visual customization options
OR Rotations
Rotation Increment: The point value for your instrument
NQ: 65 points
ES: 15 points
Adjust for other instruments based on their typical rotation behavior
Show Rotation Labels: Display level numbers and point values
Visual customization options
Use Cases
Gap Trading: When price gaps away from previous day's close, the first bar range shows the initial gap acceptance/rejection zone
Breakout Confirmation: Price breaking and holding above the first bar high with volume suggests trend day potential. Rotation levels provide measured targets.
Reversal Identification: Price reaching +2σ statistical level = rare event, potential exhaustion
Range Bound Days: Price oscillating between first bar high/low suggests range-bound session; trade reversals at extremes
Institutional Level Awareness: OR Rotations at 65 points (NQ) align with levels professional traders watch
Technical Notes
The indicator uses request.security() with lookahead=barmerge.lookahead_on to ensure the first bar levels are captured correctly
All drawing objects (lines, labels, fills) are managed in arrays with automatic cleanup to prevent memory issues
The statistical calculations use array.avg() and array.stdev() for accurate probability estimates
Rotation levels use individual line variables (like Fibonacci) rather than loops for reliability
Summary
This indicator is original in its combination of three distinct methodologies for projecting levels from a session's opening range:
Statistical Analysis - No other opening range indicator (to our knowledge) calculates standard deviation projections from historical first bar ranges
Time-Based Session Flexibility - Most OR indicators use only daily or fixed time periods; this allows any custom session window
Multiple Projection Methods - Traders can use statistical, Fibonacci, AND rotation levels together or separately

Opening Range Manipulation DetectorBasic indicator that checks the 15m opening candle to see if it's a manipulation candle or not. You can use aq threshold of 20 to 25% for indices like NQ, ES, YM, or RTY.

Custom Session ORB - Extending Past Current CandleCustom Session ORB - Extending Past Current Candle
This indicator plots Opening Range Breakout (ORB) levels for one or two customizable trading sessions directly on your chart. It dynamically tracks the high, low, and midpoint of the defined session(s) and extends these levels beyond the session using a configurable offset.
Features:
Supports two custom sessions.
New York and Asia pre-saved.
Automatically tracks session High, Low, and Mid.
Option to extend ORB levels past the live candle.
Option to display only the most recent ORB for a clean chart.
Configurable line thickness, style, and label size.
Works in Eastern Standard Time (EST) without manual adjustment.
Settings:
Show Labels: Toggle to display ORB values on chart.
Label Font Size: Small, Normal, Large.
Mid Line Style: Solid, Dashed, or Dotted.
ORB Line Thickness: Set line thickness of ORB levels.
Extend Past Current Candle by N Bars: Controls how far the ORB extends visually.
Show Only Current ORB: Cleans chart by removing previous session ORB levels.
Enable Session 1 / 2: Toggle individual sessions on/off.
Session Time: Set the start and end times for each session (automatically in EST).
How It Works:
The indicator monitors the defined session time, records the high, low, and midpoint, and draws lines at those levels. When the session ends, the lines are extended by the specified offset for easy breakout visualization. Labels can optionally show the exact price levels.

ORB_RDORB_RD - Opening Range Box (Ryan DeBraal)
This indicator automatically draws a high/low box for the first portion of
each trading day, automatically stepping the range window from 15, 30, 45,
up to 60 minutes after the session starts. The box updates live as the range
forms, then optionally extends across the rest of the session.
FEATURES
-----------------------------------------------------------------------------
• Opening Range Detection
- Automatically ladders the range window: 0–15, 0–30, 0–45, 0–60 minutes
- Automatic reset at each new trading day
- Live high/low updates while inside the 0–60 minute window
• Auto-Drawing Range Box
- Draws a dynamic rectangle as the range forms
- Top and bottom update with every new high/low
- Extends sideways in real time during formation
- Optional full-day extension after the 60-minute range finalizes
• Customizable Visuals
- Adjustable fill transparency
- Mild green tint by default for clarity
PURPOSE
-----------------------------------------------------------------------------
This tool highlights the evolving opening range, a widely used intraday
reference for breakout traders, mean-reversion setups, and session structure
analysis. Ideal for:
• Identifying early support and resistance
• Framing breakout and pullback decisions
• Tracking intraday trend bias after the morning range

Session Open Range, Breakout & Trap Framework - TrendPredator OBSession Open Range, Breakout & Trap Framework — TrendPredator Open Box
Stacey Burke’s trading approach combines concepts from George Douglas Taylor, Tony Crabel, Steve Mauro, and Robert Schabacker. His framework focuses on reading price behaviour across daily templates and identifying how markets move through recurring cycles of expansion, contraction, and reversal. While effective, much of this analysis requires real-time interpretation of session-based behaviour, which can be demanding for traders working on lower intraday timeframes.
The TrendPredator indicators formalize parts of this methodology by introducing mechanical rules for multi-timeframe bias tracking and session structure analysis. They aim to present the key elements of the system—bias, breakouts, fakeouts, and range behaviour—in a consistent and objective way that reduces discretionary interpretation.
The Open Box indicator focuses specifically on the opening behaviour of major trading sessions. It builds on principles found in classical Open Range Breakout (ORB) techniques described by Tony Crabel, where a defined time window around the session open forms a structural reference range. Price behaviour relative to this range—breaking out, failing back inside, or expanding—can highlight developing session bias, potential trap formation, and directional conviction.
This indicator applies these concepts throughout the major equity sessions. It automatically maps the session’s initial range (“Open Box”) and tracks how price interacts with it as liquidity and volatility increase. It also incorporates related structural references such as:
* the first-hour high and low of the futures session
* the exact session open level
* an anchored VWAP starting at the session open
* automated expansion levels projected from the Open Box
In combination, these components provide a unified view of early session activity, including breakout attempts, fakeouts, VWAP reactions, and liquidity targeting. The Open Box offers a structured lens for observing how price transitions through the major sessions (Asia → London → New York) and how these behaviours relate to higher-timeframe bias defined in the broader TrendPredator framework.
Core Features
Open Box (Session Structure)
The indicator defines an initial session range beginning at the selected session open. This “Open Box” represents a fixed time window—commonly the first 30 minutes, or any user-defined duration—that serves as a structural reference for analysing early session behaviour.
The range highlights whether price remains inside the box, breaks out, or rejects the boundaries, providing a consistent foundation for interpreting early directional tendencies and recognising breakout, continuation, or fakeout characteristics.
How it works:
* At the session open, the indicator calculates the high and low over the specified time window.
* This range is plotted as the initial structure of the session.
* Price behaviour at the boundaries can illustrate emerging bias or potential trap formation.
* An optional secondary range (e.g., 15-minute high/low) can be enabled to capture early volatility with additional precision.
Inputs / Options:
* Session specifications (Tokyo, London, New York)
* Open Box start and end times (e.g., equity open + first 30 minutes, or any custom length)
* Open Box colour and label settings
* Formatting options for Open Box high and low lines
* Optional secondary range per session (e.g., 15-minute high/low)
* Forward extension of Open Box high/low lines
* Number of historic Open Boxes to display
Session VWAPs
The indicator plots VWAPs for each major trading session—Asia, London, and New York—anchored to their respective session opens. These session-specific VWAPs assist in tracking how value develops through the day and how price interacts with session-based volume distributions.
How it works:
* At each session open, a VWAP is anchored to the open price.
* The VWAP updates throughout the session as new volume and price data arrive.
* Deviations above or below the VWAP may indicate balance, imbalance, or directional control.
* Viewed together, session VWAPs help identify transitions in value across sessions.
Inputs / Options:
* Enable or disable VWAP per session
* Adjustable anchor and end times (optionally to end of day)
* Line styling and label settings
* Number of historic VWAPs to draw
First Hour High/Low Extensions
The indicator marks the high and low formed during the first hour of each session. These reference points often function as early control levels and provide context for assessing whether the session is establishing bias, consolidating, or exhibiting reversal behaviour.
How it works:
* After the session starts, the indicator records the highest and lowest prices during the first hour.
* These levels are plotted and extended across the session.
* They provide a visual reference for observing reactions, targets, or rejection zones.
Inputs / Options:
* Enable or disable for each session
* Line style, colour, and label visibility
* Number of historic sessions displayed
EQO Levels (Equity Open)
The indicator plots the opening price of each configured session. These “Equity Open” levels represent short-term reference points that can attract price early in the session.
Once the level is revisited after the Open Box has formed, it is automatically cut to avoid clutter. If not revisited, the line remains as an untested reference, similar to a naked point of control.
How it works:
* At session open, the open price is recorded.
* The level is plotted as a local reference.
* If price interacts with the level after the Open Box completes, the line is cut.
* Untested EQOs extend forward until interacted with.
Inputs / Options:
* Enable/disable per session
* Line style and label settings
* Optional extension into the next day
* Option for cutting vs. hiding on revisit
* Number of historic sessions displayed
OB Range Expansions (Automatic)
Range expansions are calculated from the height of the Open Box. These levels provide structured reference zones for identifying potential continuation or exhaustion areas within a session.
How it works:
* After the Open Box is formed, multiples of the range (e.g., 1×, 2×, 3×) are projected.
* These expansion levels are plotted above and below the range.
* Price reactions near these areas can illustrate continuation, hesitation, or potential reversal.
Inputs / Options:
* Enable or disable per session
* Select number of multiples
* Line style, colour, and label settings
* Extension length into the session
Stacey Burke 12-Candle Window Marker
The indicator can highlight the 12-candle window often referenced in Stacey Burke’s session methodology. This window represents the key active period of each session where breakout attempts, volatility shifts, and reversal signatures often occur.
How it works:
* A configurable window (default 12 candles) is highlighted from each session open.
* This window acts as a guide for observing active session behaviour.
* It remains visible throughout the session for structural context.
Inputs / Options:
* Enable/disable per session
* Configurable window duration (default: 3 hours)
* Colour and transparency controls
Concept and Integration
The Open Box is built around the same multi-timeframe logic that underpins the broader TrendPredator framework.
While higher-timeframe tools track bias and setups across the H8–D–W–M levels, the Open Box focuses on the H1–M30 domain to define session structure and observe how early intraday behaviour aligns with higher-timeframe conditions.
The indicator integrates with the TrendPredator FO (Breakout, Fakeout & Trend Switch Detector), which highlights microstructure signals on lower timeframes (M15/M5). Together they form a layered workflow:
* Higher timeframes: context, bias, and developing setups
* TrendPredator OB: intraday and intra-session structure
* TrendPredator FO: microstructure confirmation (e.g., FOL/FOH, switches)
This alignment provides a structured way to observe how daily directional context interacts with intraday behaviour.
See the public open source indicator TP FO here (click on it for access):
Practical Application
Before Session Open
* Review previous session Open Box, Open level, and VWAPs
* Assess how higher-timeframe bias aligns with potential intraday continuation or reversal
* Note untested EQO levels or VWAPs that may function as liquidity attractors
During Session Open
* Observe behaviour around the first-hour high/low and higher-timeframe reference levels
* Monitor how the M15 and 30-minute ranges close
* Track reactions relative to the session open level and the session VWAP
After the Open Box completes
* Assess price interaction with Open Box boundaries and first-hour levels
* Use microstructure signals (e.g., FOH/FOL, switches) for potential confirmation
* Refer to expansion levels as reference zones for management or target setting
After Session
* Review how price behaved relative to the Open Box, EQO levels, VWAPs, and expansion zones
* Analyse breakout attempts, fakeouts, and whether intraday structure aligned with the broader daily move
Example Workflow and Trade
1. Higher-timeframe analysis signals a Daily Fakeout Low Continuation (bullish context).
2. The New York session forms an Open Box; price breaks above and holds above the first-hour high.
3. A Fakeout Low + Switch Bar appears on M5 (via FO), after retesting the session VWAP triggering the entry.
4. 1x expansion level serves as reference targets for take profit.
Relation to the TrendPredator Ecosystem
The Open Box is part of the TrendPredator Indicator Family, designed to apply multi-timeframe logic consistently across:
* higher-timeframe context and setups
* intraday and session structure (OB)
* microstructure confirmation (FO)
Together, these modules offer a unified structure for analysing how daily and intraday cycles interact.
Disclaimer
This indicator is for educational purposes only and does not guarantee profits.
It does not provide buy or sell signals but highlights structural and behavioural areas for analysis.
Users are solely responsible for their trading decisions and outcomes.

Opening Range Box, 2 SessionsOpening Range & Session Box Indicator
This indicator automatically draws Opening Range (OR) boxes and Session Boxes based on specific time zone settings, helping you visualize key trading periods across different global markets.
Key Features:
Custom Sessions: Define two independent trading sessions (e.g., New York and London).
Time Zone Selection: Choose the exact time zone for each session from a simple dropdown menu, ensuring accurate session mapping regardless of your chart's time zone.
Opening Range Definition: The initial portion of each session (defined by the Opening Range Minutes input) establishes the high and low of the box.
Offset Lines: Automatically draws two percentage offset lines inside the box, allowing you to easily track price movement relative to the Opening Range high and low (e.g., 10% retracement levels).
How to Use the Inputs:
Session A/B Timezone - Select the time zone for Session A (e.g., America/New_York).
Session A/B Time - Define the start and end time for Session A (e.g., 0930-1600).
Opening Range Minutes - Set how long the initial opening range period lasts (e.g., 30 minutes).
Percent from High/Low for Line - Set the percentage distance for the inner offset lines (e.g., 10.0 for 10% retracement).
Number of Boxes to Show - Controls the number of historical session boxes and lines that remain visible on the chart.
Luxy BIG beautiful Dynamic ORBThis is an advanced Opening Range Breakout (ORB) indicator that tracks price breakouts from the first 5, 15, 30, and 60 minutes of the trading session. It provides complete trade management including entry signals, stop-loss placement, take-profit targets, and position sizing calculations.
The ORB strategy is based on the concept that the opening range of a trading session often acts as support/resistance, and breakouts from this range tend to lead to significant moves.
What Makes This Different?
Most ORB indicators simply draw horizontal lines and leave you to figure out the rest. This indicator goes several steps further:
Multi-Stage Tracking
Instead of just one ORB timeframe, this tracks FOUR simultaneously (5min, 15min, 30min, 60min). Each stage builds on the previous one, giving you multiple trading opportunities throughout the session.
Active Trade Management
When a breakout occurs, the indicator automatically calculates and displays entry price, stop-loss, and multiple take-profit targets. These lines extend forward and update in real-time until the trade completes.
Cycle Detection
Unlike indicators that only show the first breakout, this tracks the complete cycle: Breakout → Retest → Re-breakout. You can see when price returns to test the ORB level after breaking out (potential re-entry).
Failed Breakout Warning
If price breaks out but quickly returns inside the range (within a few bars), the label changes to "FAILED BREAK" - warning you to exit or avoid the trade.
Position Sizing Calculator
Built-in risk management that tells you exactly how many shares to buy based on your account size and risk tolerance. No more guessing or manual calculations.
Advanced Filtering
Optional filters for volume confirmation, trend alignment, and Fair Value Gaps (FVG) to reduce false signals and improve win rate.
Core Features Explained
### 1. Multi-Stage ORB Levels
The indicator builds four separate Opening Range levels:
ORB 5 - First 5 minutes (fastest signals, most volatile)
ORB 15 - First 15 minutes (balanced, most popular)
ORB 30 - First 30 minutes (slower, more reliable)
ORB 60 - First 60 minutes (slowest, most confirmed)
Each level is drawn as a horizontal range on your chart. As time progresses, the ranges expand to include more price action. You can enable or disable any stage and assign custom colors to each.
How it works: During the opening minutes, the indicator tracks the highest high and lowest low. Once the time period completes, those levels become your ORB high and low for that stage.
### 2. Breakout Detection
When price closes outside the ORB range, a label appears:
BREAK UP (green label above price) - Price closed above ORB High
BREAK DOWN (red label below price) - Price closed below ORB Low
The label shows which ORB stage triggered (ORB5, ORB15, etc.) and the cycle number if tracking multiple breakouts.
Important: Signals appear on bar close only - no repainting. What you see is what you get.
### 3. Retest Detection
After price breaks out and moves away, if it returns to test the ORB level, a "RETEST" label appears (orange). This indicates:
The original breakout level is now acting as support/resistance
Potential re-entry opportunity if you missed the first breakout
Confirmation that the level is significant
The indicator requires price to move a minimum distance away before considering it a valid retest (configurable in settings).
### 4. Failed Breakout Detection
If price breaks out but returns inside the ORB range within a few bars (before the breakout is "committed"), the original label changes to "FAILED BREAK" in orange.
This warns you:
The breakout lacked conviction
Consider exiting if already in the trade
Wait for better setup
Committed Breakout: The indicator tracks how many bars price stays outside the range. Only after staying outside for the minimum number of bars does it become a committed breakout that can be retested.
### 5. TP/SL Lines (Trade Management)
When a breakout occurs, colored horizontal lines appear showing:
Entry Line (cyan for long, orange for short) - Your entry price (the ORB level)
Stop Loss Line (red) - Where to exit if trade goes against you
TP1, TP2, TP3 Lines (same color as entry) - Profit targets at 1R, 2R, 3R
These lines extend forward as new bars form, making it easy to track your trade. When a target is hit, the line turns green and the label shows a checkmark.
Lines freeze (stop updating) when:
Stop loss is hit
The final enabled take-profit is hit
End of trading session (optional setting)
### 6. Position Sizing Dashboard
The dashboard (bottom-left corner by default) shows real-time information:
Current ORB stage and range size
Breakout status (Inside Range / Break Up / Break Down)
Volume confirmation (if filter enabled)
Trend alignment (if filter enabled)
Entry and Stop Loss prices
All enabled Take Profit levels with percentages
Risk/Reward ratio
Position sizing: Max shares to buy and total risk amount
Position Sizing Example:
If your account is $25,000 and you risk 1% per trade ($250), and the distance from entry to stop loss is $0.50, the calculator shows you can buy 500 shares (250 / 0.50 = 500).
### 7. FVG Filter (Fair Value Gap)
Fair Value Gaps are price inefficiencies - gaps left by strong momentum where one candle's high doesn't overlap with a previous candle's low (or vice versa).
When enabled, this filter:
Detects bullish and bearish FVGs
Draws semi-transparent boxes around these gaps
Only allows breakout signals if there's an FVG near the breakout level
Why this helps: FVGs indicate institutional activity. Breakouts through FVGs tend to be stronger and more reliable.
Proximity setting: Controls how close the FVG must be to the ORB level. 2.0x means the breakout can be within 2 times the FVG size - a reasonable default.
### 8. Volume & Trend Filters
Volume Filter:
Requires current volume to be above average (customizable multiplier). High volume breakouts are more likely to sustain.
Set minimum multiplier (e.g., 1.5x = 50% above average)
Set "strong volume" multiplier (e.g., 2.5x) that bypasses other filters
Dashboard shows current volume ratio
Trend Filter:
Only shows breakouts aligned with a higher timeframe trend. Choose from:
VWAP - Price above/below volume-weighted average
EMA - Price above/below exponential moving average
SuperTrend - ATR-based trend indicator
Combined modes (VWAP+EMA, VWAP+SuperTrend) for stricter filtering
### 9. Pullback Filter (Advanced)
Purpose:
Waits for price to pull back slightly after initial breakout before confirming the signal.
This reduces false breakouts from immediate reversals.
How it works:
- After breakout is detected, indicator waits for a small pullback (default 2%)
- Once pullback occurs AND price breaks out again, signal is confirmed
- If no pullback within timeout period (5 bars), signal is issued anyway
Settings:
Enable Pullback Filter: Turn this filter on/off
Pullback %: How much price must pull back (2% is balanced)
Timeout (bars): Max bars to wait for pullback (5 is standard)
When to use:
- Choppy markets with many fake breakouts
- When you want higher quality signals
- Combine with Volume filter for maximum confirmation
Trade-off:
- Better signal quality
- May miss some valid fast moves
- Slight entry delay
How to Use This Indicator
### For Beginners - Simple Setup
Add the indicator to your chart (5-minute or 15-minute timeframe recommended)
Leave all default settings - they work well for most stocks
Watch for BREAK UP or BREAK DOWN labels to appear
Check the dashboard for entry, stop loss, and targets
Use the position sizing to determine how many shares to buy
Basic Trading Plan:
Wait for a clear breakout label
Enter at the ORB level (or next candle open if you're late)
Place stop loss where the red line indicates
Take profit at TP1 (50% of position) and TP2 (remaining 50%)
### For Advanced Traders - Customized Setup
Choose which ORB stages to track (you might only want ORB15 and ORB30)
Enable filters: Volume (stocks) or Trend (trending markets)
Enable FVG filter for institutional confirmation
Set "Track Cycles" mode to catch retests and re-breakouts
Customize stop loss method (ATR for volatile stocks, ORB% for stable ones)
Adjust risk per trade and account size for accurate position sizing
Advanced Strategy Example:
Enable ORB15 only (disable others for cleaner chart)
Turn on Volume filter at 1.5x with Strong at 2.5x
Enable Trend filter using VWAP
Set Signal Mode to "Track Cycles" with Max 3 cycles
Wait for aligned breakouts (Volume + Trend + Direction)
Enter on retest if you missed the initial break
### Timeframe Recommendations
5-minute chart: Scalping, very active trading, crypto
15-minute chart: Day trading, balanced approach (most popular)
30-minute chart: Swing entries, less screen time
60-minute chart: Position trading, longer holds
The indicator works on any intraday timeframe, but ORB is fundamentally a day trading strategy. Daily charts don't make sense for ORB.
DEFAULT CONFIGURATION
ON by Default:
• All 4 ORB stages (5/15/30/60)
• Breakout Detection
• Retest Labels
• All TP levels (1/1.5/2/3)
• TP/SL Lines (Detailed mode)
• Dashboard (Bottom Left, Dark theme)
• Position Size Calculator
OFF by Default (Optional Filters):
• FVG Filter
• Pullback Filter
• Volume Filter
• Trend Filter
• HTF Bias Check
• Alerts
Recommended for Beginners:
• Leave all defaults
• Session Mode: Auto-Detect
• Signal Mode: Track Cycles
• Stop Method: ATR
• Add Volume Filter if trading stocks
Recommended for Advanced:
• Enable ORB15 + ORB30 only (disable 5 & 60)
• Enable: Volume + Trend + FVG
• Signal Mode: Track Cycles, Max 3
• Stop Method: ATR or Safer
• Enable HTF Daily bias check
## Settings Guide
The settings are organized into logical groups. Here's what each section controls:
### ORB COLORS Section
Show Edge Labels: Display "ORB 5", "ORB 15" labels at the right edge of the levels
Background: Fill the area between ORB high/low with color
Transparency: How see-through the background is (95% is nearly invisible)
Enable ORB 5/15/30/60: Turn each stage on or off individually
Colors: Assign colors to each ORB stage for easy identification
### SESSION SETTINGS Section
Session Mode: Choose trading session (Auto-Detect works for most instruments)
Custom Session Hours: Define your own hours if needed (format: HHMM-HHMM)
Auto-Detect uses the instrument's natural hours (stocks use exchange hours, crypto uses 24/7).
### BREAKOUT DETECTION Section
Enable Breakout Detection: Master switch for signals
Show Retest Labels: Display retest signals
Label Size: Visual size for all labels (Small recommended)
Enable FVG Filter: Require Fair Value Gap confirmation
Show FVG Boxes: Display the gap boxes on chart
Signal Mode: "First Only" = one signal per direction per day, "Track Cycles" = multiple signals
Max Cycles: How many breakout-retest cycles to track (6 is balanced)
Breakout Buffer: Extra distance required beyond ORB level (0.1-0.2% recommended)
Min Distance for Retest: How far price must move away before retest is valid (2% recommended)
Min Bars Outside ORB: Bars price must stay outside for committed breakout (2 is balanced)
### TARGETS & RISK Section
Enable Targets & Stop-Loss: Calculate and show trade management
TP1/TP2/TP3 checkboxes: Select which profit targets to display
Stop Method: How to calculate stop loss placement
- ATR: Based on volatility (best for most cases)
- ORB %: Fixed % of ORB range
- Swing: Recent swing high/low
- Safer: Widest of all methods
ATR Length & Multiplier: Controls ATR stop distance (14 period, 1.5x is standard)
ORB Stop %: Percentage beyond ORB for stop (20% is balanced)
Swing Bars: Lookback period for swing high/low (3 is recent)
### TP/SL LINES Section
Show TP/SL Lines: Display horizontal lines on chart
Label Format: "Short" = minimal text, "Detailed" = shows prices
Freeze Lines at EOD: Stop extending lines at session close
### DASHBOARD Section
Show Info Panel: Display the metrics dashboard
Theme: Dark or Light colors
Position: Where to place dashboard on chart
Toggle rows: Show/hide specific information rows
Calculate Position Size: Enable the position sizing calculator
Risk Mode: Risk fixed $ amount or % of account
Account Size: Your total trading capital
Risk %: Percentage to risk per trade (0.5-1% recommended)
### VOLUME FILTER Section
Enable Volume Filter: Require volume confirmation
MA Length: Average period (20 is standard)
Min Volume: Required multiplier (1.5x = 50% above average)
Strong Volume: Multiplier that bypasses other filters (2.5x)
### TREND FILTER Section
Enable Trend Filter: Require trend alignment
Trend Mode: Method to determine trend (VWAP is simple and effective)
Custom EMA Length: If using EMA mode (50 for swing, 20 for day trading)
SuperTrend settings: Period and Multiplier if using SuperTrend mode
### HIGHER TIMEFRAME Section
Check Daily Trend: Display higher timeframe bias in dashboard
Timeframe: What TF to check (D = daily, recommended)
Method: Price vs MA (stable) or Candle Direction (reactive)
MA Period: EMA length for Price vs MA method (20 is balanced)
Min Strength %: Minimum strength threshold for HTF bias to be considered
- For "Price vs MA": Minimum distance (%) from moving average
- For "Candle Direction": Minimum candle body size (%)
- 0.5% is balanced - increase for stricter filtering
- Lower values = more signals, higher values = only strong trends
### ALERTS Section
Enable Alerts: Master switch (must be ON to use any alerts)
Breakout Alerts: Notify on ORB breakouts
Retest Alerts: Notify when price retests after breakout
Failed Break Alerts: Notify on failed breakouts
Stage Complete Alerts: Notify when each ORB stage finishes forming
After enabling desired alert types, click "Create Alert" button, select this indicator, choose "Any alert() function call".
## Tips & Best Practices
### General Trading Tips
ORB works best on liquid instruments (stocks with good volume, major crypto pairs)
First hour of the session is most important - that's when ORB is forming
Breakouts WITH the trend have higher success rates - use the trend filter
Failed breakouts are common - use the "Min Bars Outside" setting to filter weak moves
Not every day produces good ORB setups - be patient and selective
### Position Sizing Best Practices
Never risk more than 1-2% of your account on a single trade
Use the built-in calculator - don't guess your position size
Update your account size monthly as it grows
Smaller accounts: use $ Amount mode for simplicity
Larger accounts: use % of Account mode for scaling
### Take Profit Strategy
Most traders use: 50% at TP1, 50% at TP2
Aggressive: Hold through TP1 for TP2 or TP3
Conservative: Full exit at TP1 (1:1 risk/reward)
After TP1 hits, consider moving stop to breakeven
TP3 rarely hits - only on strong trending days
### Filter Combinations
Maximum Quality: Volume + Trend + FVG (fewest signals, highest quality)
Balanced: Volume + Trend (good quality, reasonable frequency)
Active Trading: No filters or Volume only (many signals, lower quality)
Trending Markets: Trend filter essential (indices, crypto)
Range-Bound: Volume + FVG (avoid trend filter)
### Common Mistakes to Avoid
Chasing breakouts - wait for the bar to close, don't FOMO into wicks
Ignoring the stop loss - always use it, move it manually if needed
Over-leveraging - the calculator shows MAX shares, you can buy less
Trading every signal - quality > quantity, use filters
Not tracking results - keep a journal to see what works for YOU
## Pros and Cons
### Advantages
Complete all-in-one solution - from signal to position sizing
Multiple timeframes tracked simultaneously
Visual clarity - easy to see what's happening
Cycle tracking catches opportunities others miss
Built-in risk management eliminates guesswork
Customizable filters for different trading styles
No repainting - what you see is locked in
Works across multiple markets (stocks, forex, crypto)
### Limitations
Intraday strategy only - doesn't work on daily charts
Requires active monitoring during first 1-2 hours of session
Not suitable for after-hours or extended sessions by default
Can produce many signals in choppy markets (use filters)
Dashboard can be overwhelming for complete beginners
Performance depends on market conditions (trends vs ranges)
Requires understanding of risk management concepts
### Best For
Day traders who can watch the first 1-2 hours of market open
Traders who want systematic entry/exit rules
Those learning proper position sizing and risk management
Active traders comfortable with multiple signals per day
Anyone trading liquid instruments with clear sessions
### Not Ideal For
Swing traders holding multi-day positions
Set-and-forget / passive investors
Traders who can't watch market open
Complete beginners unfamiliar with trading concepts
Low volume / illiquid instruments
## Frequently Asked Questions
Q: Why are no signals appearing?
A: Check that you're on an intraday timeframe (5min, 15min, etc.) and that the current time is within your session hours. Also verify that "Enable Breakout Detection" is ON and at least one ORB stage is enabled. If using filters, they might be blocking signals - try disabling them temporarily.
Q: What's the best ORB stage to use?
A: ORB15 (15 minutes) is most popular and balanced. ORB5 gives faster signals but more noise. ORB30 and ORB60 are slower but more reliable. Many traders use ORB15 + ORB30 together.
Q: Should I enable all the filters?
A: Start with no filters to see all signals. If too many false signals, add Volume filter first (stocks) or Trend filter (trending markets). FVG filter is most restrictive - use for maximum quality but fewer signals.
Q: How do I know which stop loss method to use?
A: ATR works for most cases - it adapts to volatility. Use ORB% if you want predictable stop placement. Swing is for respecting chart structure. Safer gives you the most room but largest risk.
Q: Can I use this for swing trading?
A: Not really - ORB is fundamentally an intraday strategy. The ranges reset each day. For swing trading, look at weekly support/resistance or moving averages instead.
Q: Why do TP/SL lines disappear sometimes?
A: Lines freeze (stop extending) when: stop loss is hit, the last enabled take-profit is hit, or end of session arrives (if "Freeze at EOD" is enabled). This is intentional - the trade is complete.
Q: What's the difference between "First Only" and "Track Cycles"?
A: "First Only" shows one breakout UP and one DOWN per day maximum - clean but might miss opportunities. "Track Cycles" shows breakout-retest-rebreak sequences - more signals but busier chart.
Q: Is position sizing accurate for options/forex?
A: The calculator is designed for shares (stocks). For options, ignore the share count and use the risk amount. For forex, you'll need to adapt the lot size calculation manually.
Q: How much capital do I need to use this?
A: The indicator works for any account size, but practical day trading typically requires $25,000 in the US due to Pattern Day Trader rules. Adjust the "Account Size" setting to match your capital.
Q: Can I backtest this strategy?
A: This is an indicator, not a strategy script, so it doesn't have built-in backtesting. You can visually review historical signals or code a strategy script using similar logic.
Q: Why does the dashboard show different entry price than the breakout label?
A: If you're looking at an old breakout, the ORB levels may have changed when the next stage completed. The dashboard always shows the CURRENT active range and trade setup.
Q: What's a good win rate to expect?
A: ORB strategies typically see 40-60% win rate depending on market conditions and filters used. The strategy relies on positive risk/reward ratios (2:1 or better) to be profitable even with moderate win rates.
Q: Does this work on crypto?
A: Yes, but crypto trades 24/7 so you need to define what "session start" means. Use Session Mode = Custom and set your preferred daily reset time (e.g., 0000-2359 UTC).
## Credits & Transparency
### Development
This indicator was developed with the assistance of AI technology to implement complex ORB trading logic.
The strategy concept, feature specifications, and trading logic were designed by the publisher. The implementation leverages modern development tools to ensure:
Clean, efficient, and maintainable code
Comprehensive error handling and input validation
Detailed documentation and user guidance
Performance optimization
### Trading Concepts
This indicator implements several public domain trading concepts:
Opening Range Breakout (ORB): Trading strategy popularized by Toby Crabel, Mark Fisher and many more talanted traders.
Fair Value Gap (FVG): Price imbalance concept from ICT methodology
SuperTrend: ATR-based trend indicator using public formula
Risk/Reward Ratio: Standard risk management principle
All mathematical formulas and technical concepts used are in the public domain.
### Pine Script
Uses standard TradingView built-in functions:
ta.ema(), ta.atr(), ta.vwap(), ta.highest(), ta.lowest(), request.security()
No external libraries or proprietary code from other authors.
## Disclaimer
This indicator is provided for educational and informational purposes only. It is not financial advice.
Trading involves substantial risk of loss and is not suitable for every investor. Past performance shown in examples is not indicative of future results.
The indicator provides signals and calculations, but trading decisions are solely your responsibility. Always:
Test strategies on paper before using real money
Never risk more than you can afford to lose
Understand that all trading involves risk
Consider seeking advice from a licensed financial advisor
The publisher makes no guarantees regarding accuracy, profitability, or performance. Use at your own risk.
---
Version: 3.0
Pine Script Version: v6
Last Updated: October 2024
For support, questions, or suggestions, please comment below or send a private message.
---
Happy trading, and remember: consistent risk management beats perfect entry timing every time.

Futures Playbook: VWAP + OR + Cross-Asset TellsFutures Playbook: VWAP + OR + Cross-Asset Tells (with Trade Messages + Coach Panel)
This all-in-one futures trading toolkit combines Opening Range (OR) levels, VWAP, and cross-asset signals to help traders quickly read intraday structure, manage execution, and filter noise.
Core Features
• Opening Range (OR):
• Customizable OR window with High/Low and Midpoint.
• Automatic shading of the OR zone.
• VWAP & Bands:
• Built-in or session-anchored VWAP.
• Optional standard deviation bands for context.
• Cross-Asset Tells:
• Live reads on US 10Y yield, DXY, Crude, and Gold.
• Regime detection: rates risk, USD strength, energy softness, and real-rate easing.
• Confirmations:
• Volume vs. moving average filter.
• Cumulative delta with smoothing.
• ATR-based chop filter to avoid low-quality trends.
Trade Messages + Coach Panel
• Trade Messages (labels): Automatic on-chart prompts for OR completion, VWAP reclaim/loss, long/short setups, and EU close flows.
• Coach Panel (table): Real-time dashboard with regime context, directional bias, execution notes, risk reminders, and key levels (ORH, ORL, VWAP).
Alerts
• OR breakout (long/short with confirmations).
• VWAP reclaim or loss.
• 10Y yield crossing risk threshold.
Use Case
Designed for futures traders and scalpers who rely on VWAP + OR dynamics and need cross-asset confirmation before committing to trades. Great for structuring entries, managing risk, and filtering market noise throughout the session.

Opening-Range BreakoutNote: Default trading date range looks mediocre. Set date range to "Entire History" to see full effect of the strategy. 50.91% profitable trades, 1.178 profit factor, steady profits and limited drawdown. Total P&L: $154,141.18, Max Drawdown: $18,624.36. High R^2
█ Overview
The Opening-Range Breakout strategy is a mechanical, session‑based day‑trading system designed to capture the initial burst of directional momentum immediately following the market open. It defines a user‑configurable “opening range” window, measures its high and low boundaries, then places breakout stop orders at those levels once the range closes. Built‑in filters on minimum range width, reward‑to‑risk ratios, and optional reversal logic help refine entries and manage risk dynamically.
█ How It Works
Opening‑Range Formation
Between 9:30–10:15 AM ET (configurable), the script tracks the highest high and lowest low to form the day’s opening range box.
On the first bar after the range window closes, the range high (OR_high) and low (OR_low) are “locked in.”
Range‑Width Filter
To avoid false breakouts in low‑volatility mornings, the range must be at least X% of the current price (default 0.35%).
If the measured opening-range width < minimum threshold, no orders are placed that day.
Entry & Order Placement
Long: a stop‑buy order at the opening‑range high.
Short: a stop‑sell order at the opening‑range low.
Only one side can trigger (or both if reverse logic is enabled after a losing trade).
Risk Management
Once triggered, each trade uses an ATR‑style stop-loss defined as a percentage retracement of the range (default 50% of range width).
Profit target is set at a configurable Reward/Risk Ratio (default 1.1×).
Optional: Reverse on Stop‑Loss – if the initial breakout loses, immediately reverse into the opposite side on the same day.
Session Exit
Any open positions are closed at the end of the regular trading day (default 3:45 PM ET window end, with hard flat at session close).
Visual cues are provided via green (range high) and red (range low) step‑line plots directly on the chart, allowing you to see the range box and breakout triggers in real time.
█ Why It Works
Early Momentum Capture: The first 15 – 60 minutes of trading encapsulate overnight news digestion and institutional order flow, creating a well‑defined volatility “range.”
Mechanical Discipline: Clear, rule‑based entries and exits remove emotional guesswork, ensuring consistency.
Volatility Filtering: By requiring a minimum range width, the system avoids choppy, low‑range days where false breakouts are common.
Dynamic Sizing: Stops and targets scale with the opening range, adapting automatically to each day’s volatility environment.
█ How to Use
Set Your Instruments & Timeframe
-Apply to any futures contract on a 1‑ to 5‑minute chart.
-Ensure chart timezone is set to America/New_York.
Configure Inputs
-Opening‑Range Window: e.g. “0930-1015” for a 45‑minute range.
-Min. OR Width (%): e.g. 0.35 for 0.35% of current price.
-Reward/Risk Ratio: e.g. 1.1 for a modest profit target above your stop.
-Max OR Retracement %: e.g. 50 to set stop at 50% of range width.
-One Trade Per Day: toggle to limit to a single breakout.
-Reverse on Stop Loss: toggle to flip direction after a losing breakout.
Monitor the Chart
-Watch the green and red range boundaries form during the session open.
-Orders will automatically submit on the first bar after the range window closes, conditioned on your filters.
Review & Adjust
-Backtest across multiple months to validate performance on your preferred contract.
-Tweak range duration, minimum width, and R/R multiple to fit your risk tolerance and desired win‑rate vs. expectancy balance.
█ Settings Reference
Input Defaults
Opening‑Range Window - Time window to form OR (HHMM-HHMM) - 0930–1015
Regular Trading Day - Full session for EOD flat (HHMM-HHMM) - 0930–1545
Min. OR Width (%) - Minimum OR size as % of close to trigger orders - 0.35
Reward/Risk Ratio - Profit target multiple of stop‑loss distance - 1.1
Max OR Retracement (%) - % of OR width to use as stop‑loss distance - 50
One Trade Per Day - Limit to a single breakout order per day - false
Reverse on Stop Loss - Reverse direction immediately after a losing trade - true
Disclaimer
This strategy description and any accompanying code are provided for educational purposes only and do not constitute financial advice or a solicitation to trade. Futures trading involves substantial risk, including possible loss of capital. Past performance is not indicative of future results. Traders should assess their own risk tolerance and conduct thorough backtesting and forward-testing before committing real capital.

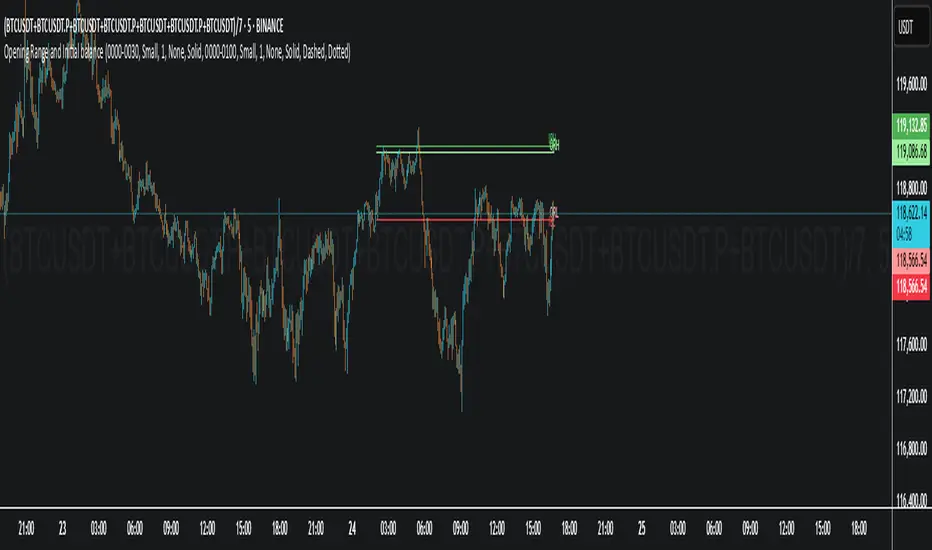
Opening Range and Initial balanceThis indicator represents Opening Range and Initial Balance levels.
Opening Range represents the high and low established during the first few minutes of the trading session — usually 5, 15 or 30 minutes.
Initial Balance represents the high and low established during the first hour of the trading session.
Open Range Breakout (ORB) with Alerts
🚀 ChartsAlgo – Open Range Breakout (ORB) with Alerts
The Open Range Breakout (ORB) Indicator by ChartsAlg is designed for intraday traders looking to capitalize on price movements after the market’s opening range. This tool is especially effective for futures (MNQ, MES) and high-volatility stocks or crypto where initial volatility sets the tone for the session.
This indicator identifies a user-defined opening range window, plots the high/low lines of that range, and visually alerts users when price breaks out above or below the range — with options to customize breakout repetitions, background fill, and alerts.
💡 What is an Open Range Breakout (ORB)?
The opening range represents the high and low established during the first few minutes of the trading session — usually 15 or 30 minutes. Many intraday strategies are based on the idea that breaking out of this initial range often signals strong momentum and trend continuation.
Traders often enter:
Long when price breaks above the range high.
Short when price breaks below the range low.
⚙️ How It Works
You define a session window (e.g., 09:30–09:45 EST).
The indicator tracks the high and low during this time.
Once the session ends, the high and low become your range breakout levels.
The indicator then:
Plots lines for visual clarity
Optionally fills background between the range
Triggers breakout signals if price crosses the levels
Provides alerts when breakouts occur
🛠️ Settings Breakdown
🔹 Session Settings
Range Session: Set your preferred window (e.g., 0930–0945). Can be premarket, first 30 mins, or any custom time.
Time zone: Use "America/New York" for EST (default) or change to "GMT+0" for international traders.
🔹 Breakout Settings
Bullish Breakout Signals: Number of allowed breakout alerts above the range.
Bearish Breakout Signals: Number of allowed breakout alerts below the range.
This prevents repeated alerts once breakout has been confirmed.
🔹 Display Settings
Show Background Fill: Fills area between high/low of the range for easier visual analysis.
Show Breakout Signals: Triangle markers plotted on the chart when breakouts happen.
Only Show Today’s Range: Keeps the chart clean by showing only the most current day’s range.
🔹 Color Settings
Range High/Low Line Colors: Choose any color for clarity.
Range Fill Color: Customize the highlight area for your chart style.
📊 Chart Features
Range High/Low Lines: Automatically plotted after range session ends.
Visual Fill Box: Optional background shading between the opening range.
Triangle Breakout Markers: Appear at the breakout candle.
Alerts: Can be used with TradingView’s alert system to notify you of breakouts in real-time.
🔔 Alerts
Two alert conditions are built in:
Bullish Breakout: Triggers when price breaks above the high of the range.
Bearish Breakout: Triggers when price breaks below the low of the range.
Example Alert Message:
📈 “Bullish Breakout above Open Range on AAPL!”
To activate:
Click “🔔 Alerts” on TradingView.
Set condition to this script.
Choose “ORB Breakout Up” or “ORB Breakout Down”.
Choose alert frequency and notification method.
⚠️ DISCLAIMER
ChartsAlgo tools are for informational and educational purposes only.
They are not financial advice or signals. Past performance does not guarantee future results. Use at your own risk and always implement solid risk management.
By using this indicator, you agree that you are solely responsible for any trades or decisions made based on the information provided.

ICT Opening Range Projections (tristanlee85)ICT Opening Range Projections
This indicator visualizes key price levels based on ICT's (Inner Circle Trader) "Opening Range" concept. This 30-minute time interval establishes price levels that the algorithm will refer to throughout the session. The indicator displays these levels, including standard deviation projections, internal subdivisions (quadrants), and the opening price.
🟪 What It Does
The Opening Range is a crucial 30-minute window where market algorithms establish significant price levels. ICT theory suggests this range forms the basis for daily price movement.
This script helps you:
Mark the high, low, and opening price of each session.
Divide the range into quadrants (premium, discount, and midpoint/Consequent Encroachment).
Project potential price targets beyond the range using configurable standard deviation multiples .
🟪 How to Use It
This tool aids in time-based technical analysis rooted in ICT's Opening Range model, helping you observe price interaction with algorithmic levels.
Example uses include:
Identifying early structural boundaries.
Observing price behavior within premium/discount zones.
Visualizing initial displacement from the range to anticipate future moves.
Comparing price reactions at projected standard deviation levels.
Aligning price action with significant times like London or NY Open.
Note: This indicator provides a visual framework; it does not offer trade signals or interpretations.
🟪 Key Information
Time Zone: New York time (ET) is required on your chart.
Sessions: Supports multiple sessions, including NY midnight, NY AM, NY PM, and three custom timeframes.
Time Interval: Supports multi-timeframe up to 15 minutes. Best used on a 1-minute chart for accuracy.
🟪 Session Options
The Opening Range interval is configurable for up to 6 sessions:
Pre-defined ICT Sessions:
NY Midnight: 12:00 AM – 12:30 AM ET
NY AM: 9:30 AM – 10:00 AM ET
NY PM: 1:30 PM – 2:00 PM ET
Custom Sessions:
Three user-defined start/end time pairs.
This example shows a custom session from 03:30 - 04:00:
🟪 Understanding the Levels
The Opening Price is the open of the first 1-minute candle within the chosen session.
At session close, the Opening Range is calculated using its High and Low . An optional swing-based mode uses swing highs/lows for range boundaries.
The range is divided into quadrants by its midpoint ( Consequent Encroachment or CE):
Upper Quadrant: CE to high (premium).
Lower Quadrant: Low to CE (discount).
These subdivisions help visualize internal range dynamics, where price often reacts during algorithmic delivery.
🟪 Working with Ranges
By default, the range is determined by the highest high and lowest low of the 30-minute session:
A range can also be determined by the highest/lowest swing points:
Quadrants outline the premium and discount of a range that price will reference:
Small ranges still follow the same algorithmic logic, but may be deemed insignificant for one's trading. These can be filtered in the settings by specifying a minimum ticks limit. In this example, the range is 42 ticks (10.5 points) but the indicator is configured for 80 ticks (20 points). We can select which levels will plot if the range is below the limit. Here, only the 00:00 opening price is plotted:
You may opt to include the range high/low, quadrants, and projections as well. This will plot a red (configurable) range bracket to indicate it is below the limit while plotting the levels:
🟪 Price Projections
Projections extend beyond the Opening Range using standard deviations, framing the market beyond the initial session and identifying potential targets. You define the standard deviation multiples (e.g., 1.0, 1.5, 2.0).
Both positive and negative extensions are displayed, symmetrically projected from the range's high and low.
The Dynamic Levels option plots only the next projection level once price crosses the previous extreme. For example, only the 0.5 STDEV level plots until price reaches it, then the 1.0 level appears, and so on. This continues up to your defined maximum projections, or indefinitely if standard deviations are set to 0.
This example shows dynamic levels for a total of 6 sessions, only 1 of which meet a configured minimum limit of 50 ticks:
Small ranges followed by significant displacement are impacted the most with the number of levels plotted. You may hide projections when configuring the minimum ticks.
A fixed standard deviation will plot levels in both directions, regardless of the price range. Here, we plot up to 3.0 which hiding projections for small ranges:
🟪 Legal Disclaimer
This indicator is provided for informational and educational purposes only. It is not financial advice, and should not be construed as a recommendation to buy or sell any financial instrument. Trading involves substantial risk, and you could lose a significant amount of money. Past performance is not indicative of future results. Always consult with a qualified financial professional before making any trading or investment decisions. The creators and distributors of this indicator assume no responsibility for your trading outcomes.

Opening Range Breakout Detector📈 Opening Range Breakout Detector (TF-Independent)
Tracks breakouts with precision. No matter the chart, no matter the timeframe.
This indicator monitors whether price breaks above or below the Opening Range across multiple key durations — 1m, 5m, 10m, 15m, 30m, 45m, and 60m — using 1-minute data under the hood, while you can work on higher timeframe charts (daily, etc.).
Highlights:
✅ Status table shows which ORs broke UP or DOWN
⏱ Control which timeframes to track
🖼 Customizable table position, size and colors
Crafted by @FunkyQuokka

[TTM] ICT Sessions & Ranges🌟 Overview 🌟
The ICT Sessions & Ranges Indicator helps traders identify key intraday price levels by marking custom session highs/lows and opening ranges.
It helps traders spot potential liquidity grabs, reversals, and breakout zones by tracking price behavior around these key areas
🌟 Session Highs & Lows – Liquidity Zones 🌟
Session highs and lows often attract price due to stop orders resting above or below them. These levels are frequently targeted during high-volatility moves.
🔹 Asia Session
- Usually ranges in low volatility.
- Highs/lows often get swept during early London.
- Price may raid these levels, then reverse.
🔹 London Session
- First major volatility of the day.
- Highs/lows often tested or swept in New York.
- Commonly forms the day’s true high or low.
🌟 Opening Range Concepts 🌟
The Opening Range is the first 15, 30, or 60 minutes of a session (e.g., New York).
The high (ORH) and low (ORL) define the market’s initial balance and key reaction levels.
🔹 Breakout Trade
- Price breaks ORH/ORL with momentum.
- Signals directional intent.
- Traders enter on the breakout, with stops inside the range.
🔹 Liquidity Raid
- Price briefly breaks ORH/ORL to trigger stops.
- Reverses after the sweep.
- Look for structure shift and entry near FVG or OB.
🌟 Customizable Settings 🌟
The indicator includes 3 configurable ranges , each with:
Start & End Time – Set any custom time window.
Display Type – Choose Box (highlight range) or Lines (mark high/low).
Color Settings – Set custom colors for boxes and lines.
🌟 Default Settings 🌟
Range 1 : 19:00–00:00 (Asia Session)
Range 2 : 01:45–05:15 (London Session)
Range 3 : 09:30–10:00 (NY Opening Range – 30m)

ORB - Futures and Stocks (Breakouts + Alerts + ORB Selector)This indicator shows the Opening Range Breakout (ORB) based on the time range you choose.
Important:
It only works for intraday trading on time frames less than 1 day (like 1-minute, 5-minute, or hourly charts).
You can use it with any stock or futures, such as US500, NAS100, or GER40.
Inputs:
ORB Range - Your preference.
Session Start
Time Zone Offset
Examples:
for EU Frankfurt, DAX (GER40):
Set your ORB range
Session Start 0900
Time Zone Offset +1
For US Stock Market and US500, NAS100:
Set your ORB range
Session Start 0930
Time Zone Offset -5
Created using ChatGPT

ORB opening range breakoutThis indicator plots the opening range high and low for a selected period of time in minutes after the market opens on an intraday chart to allow the user to visualize the high and low of the opening range for use in the Opening Range Breakout (ORB) strategy.
The Opening Range Breakout (ORB) strategy is a trading approach that involves identifying the price range within the first few minutes of a market session and then waiting for the price to break out of that range. This indicator facilitates this strategy through the use of shaded regions and/or price levels.
Features
Able to plot the high and low for any opening range above 1 min on any intraday timeframe
Fully customizable ORB region, price level, price axis, label
The inclusion of the Bollinger band along with it's Moving Average serves multiple purposes to assist the user in the opening range breakout strategy
Highlights to the user the deviation from the Moving Average due to an opening range breakout so that the user is better informed on whether to avoid entering a position, exit a position, or monitor the situation more closely
Highlights area of support or resistance formed by the Moving Average of Bollinger Band
Inform the user of the current trend direction to serve as confluence during an opening range breakout
What sets this indicator apart from others
In other ORB indicators, the opening range must be a multiple of the current chart's timeframe, restricting users on the intraday timeframes that can be used. E.g. if the user is using the 15 minutes opening range, they are restricted to use the 1, 3, 5, 15 minute(s) chart.
This indicator gives the user the flexibility to set any opening range above 1 min on any intraday timeframe. E.g. if the user is using the 15 minutes opening range, they are free to use any intraday timeframe on their chart, such as 1 hour or 2 hours chart.
How to use
Input the opening time range of interest in minutes
Check the "ORB region" checkbox to shade the ORB region
Check the "PRICE LEVEL" checkbox to draw a horizontal line of the high and low
Check the "PRICE AXIS" checkbox to plot the values on the price axis
Check the "LABEL" checkbox to draw a label of the high and low
