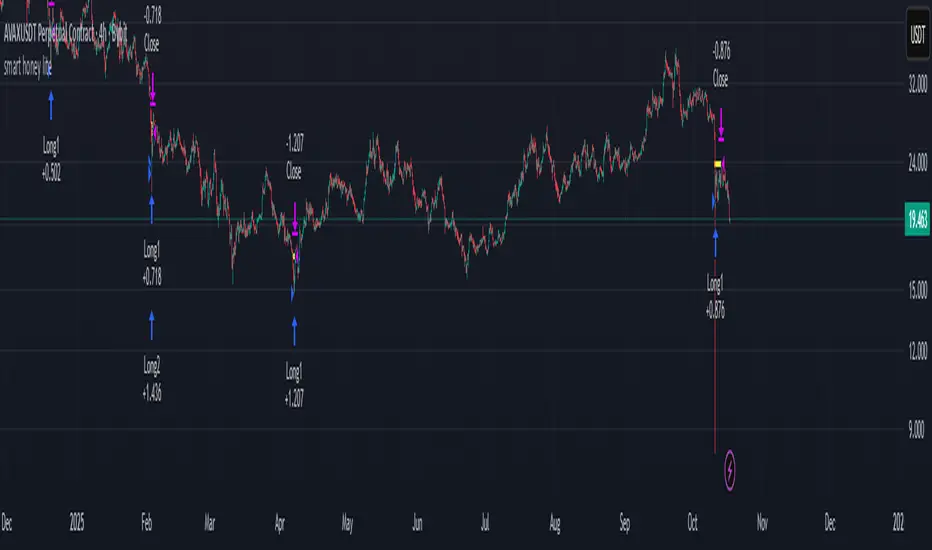
smart honey liteThis is template for strategy with averaging
After "longcondition = " you can set your own terms for first entry
Осцилляторы
AlgoWay GRSIM🧭 What this strategy tries to do
This strategy detects when a market move is losing strength and prepares for a potential reversal, but it waits for fresh momentum confirmation before acting.
It combines:
• RSI-based divergence (to spot exhaustion and potential turning points),
• Impulse MACD (to verify that the new direction actually has force behind it).
________________________________________
⚙️ When it takes trades
Long (Buy):
• A bullish RSI divergence appears (a clue that selling pressure is fading);
• Within a short time window, the Impulse MACD turns strongly positive;
• Optionally, the impulse line itself must be rising (if the Impulse Direction Filter is
enabled).
Short (Sell):
• A bearish RSI divergence appears (buying pressure fading);
• Within a short time window, the Impulse MACD turns strongly negative;
• Optionally, the impulse line must be falling (if the Impulse Direction Filter is enabled).
If momentum confirmation happens too late, the divergence “expires” and the signal is ignored.
________________________________________
🧩 How entries work
1. Reversal clue:
The strategy detects disagreement between price and RSI (price makes a new high/low, RSI doesn’t).
That suggests a shift in underlying strength.
2. Momentum confirmation:
Before entering, the Impulse MACD must agree — showing real push in the same direction.
3. Impulse direction filter (optional):
When enabled, the impulse itself must accelerate (rise for longs, fall for shorts), avoiding fake signals where price diverges but momentum is still fading.
4. No stacking:
It opens only one position at a time.
________________________________________
🚪 How exits work
Two main exit styles:
Conservative (default):
Longs close when impulse crosses below its signal line.
Shorts close when impulse crosses above its signal line.
✅ Keeps trades as long as momentum agrees.
Color-change (fast):
Longs close immediately when impulse flips bearish.
Shorts close immediately when impulse flips bullish.
⚡ Faster and more defensive.
Plus:
Stop Loss (%) and Take Profit (%) act as fixed-distance protective exits (set to 0 to disable either one).
________________________________________
📊 What you’ll see on the chart
A thick Impulse MACD line and thin signal line (oscillator view).
Diamonds — detected bullish/bearish divergence points.
Circles — where impulse crosses its signal (momentum change).
A performance panel (top-right) showing Net Profit, Trades, Win Rate, Profit Factor, Pessimistic PF, and Max Drawdown.
________________________________________
🔧 What you can tune
Signal Lifetime (bars): how long a divergence remains valid.
Impulse Direction Filter: ensure the impulse itself is moving in the trade’s direction.
Stop Loss / Take Profit (%): risk and target in percent.
Exit Style: conservative cross or faster color-change.
RSI / MA / Signal Lengths: adjust responsiveness (defaults are balanced).
________________________________________
💪 Strengths
Confirms reversals using momentum direction, not just divergence.
Avoids “early” signals where momentum is still fading.
Works symmetrically for longs and shorts.
Built-in stop/target protection.
Clear, visual confirmation of all logic components.
________________________________________
⚠️ Things to keep in mind
In sideways markets, the impulse can flip often — prefer conservative exits.
Too small SL/TP → constant stop-outs.
Too wide SL/TP → deep drawdowns.
Always test with different timeframes and markets.
________________________________________
💡 Practical tips
Start with default settings.
Enable “Use Impulse Direction Filter” in trending markets, disable it in very choppy ones.
Focus on Profit Factor, Win Rate, and Max Drawdown after several dozen trades.
Keep SL/TP roughly aligned with typical swing size.
“AlgoWay GRSIM” is a reversal-with-confirmation strategy: it spots likely turns, demands real momentum alignment (optionally verified by impulse direction), and manages exits with clear momentum cues plus built-in protective limits.

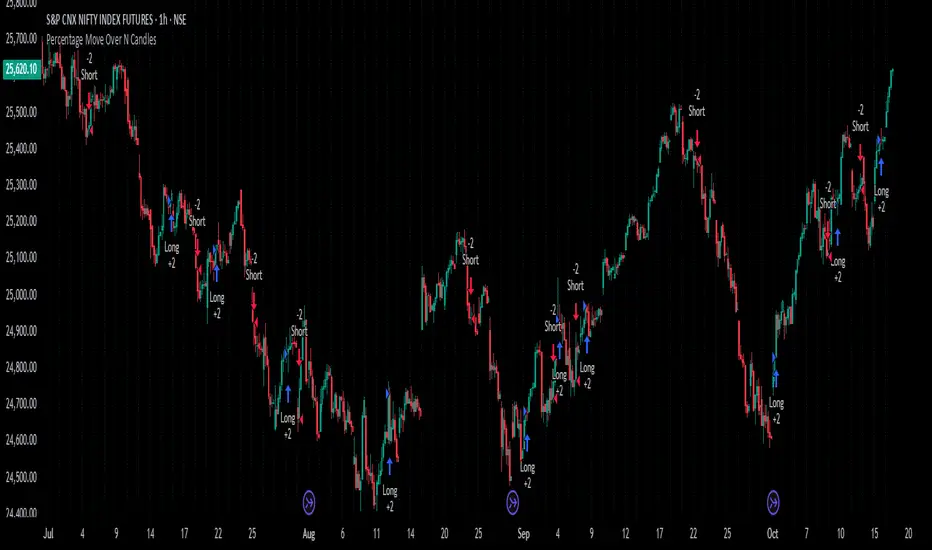
Percentage Move Over N CandlesThis strategy enters long/short trades if the price goes up/down by a certain defined percentage of the price, over a previous certain number of candles. Can be run on any time frame and on any instrument and alerts can be enabled.
Turtle Strategy - Triple EMA Trend with ADX and ATRDescription
The Triple EMA Trend strategy is a directional momentum system built on the alignment of three exponential moving averages and a strong ADX confirmation filter. It is designed to capture established trends while maintaining disciplined risk management through ATR-based stops and targets.
Core Logic
The system activates only under high-trend conditions, defined by the Average Directional Index (ADX) exceeding a configurable threshold (default: 43).
A bullish setup occurs when the short-term EMA is above the mid-term EMA, which in turn is above the long-term EMA, and price trades above the fastest EMA.
A bearish setup is the mirror condition.
Execution Rules
Entry:
• Long when ADX confirms trend strength and EMA alignment is bullish.
• Short when ADX confirms trend strength and EMA alignment is bearish.
Exit:
• Stop Loss: 1.8 × ATR below (for longs) or above (for shorts) the entry price.
• Take Profit: 3.3 × ATR in the direction of the trade.
Both parameters are configurable.
Additional Features
• Start/end date inputs for controlled backtesting.
• Selective activation of long or short trades.
• Built-in commission and position sizing (percent of equity).
• Full visual representation of EMAs, ADX, stop-loss, and target levels.
This strategy emphasizes clean trend participation, strict entry qualification, and consistent reward-to-risk structure. Ideal for swing or medium-term testing across trending assets.

Fury by Tetrad Fury by Tetrad
What it is:
A rules-based Bollinger+RSI strategy that fades extremes: it looks for price stretching beyond Bollinger Bands while RSI confirms exhaustion, enters countertrend, then exits at predefined profit multipliers or optional stoploss. “Ultra Glow” visuals are purely cosmetic.
How it works — logic at a glance
Framework: Classic Bollinger Bands (SMA basis; configurable length & multiplier) + RSI (configurable length).
Long entries:
Price closes below the lower band and RSI < Long RSI threshold (default 28.3) → open LONG (subject to your “Market Direction” setting).
Short entries:
Price closes above the upper band and RSI > Short RSI threshold (default 88.4) → open SHORT.
Profit exits (price targets):
Uses simple multipliers of the strategy’s average entry price:
Long exit = `entry × Long Exit Multiplier` (default 1.14).
Short exit = `entry × Short Exit Multiplier` (default 0.915).
Risk controls:
Optional pricebased stoploss (disabled by default) via:
Long stop = `entry × Long Stop Factor` (default 0.73).
Short stop = `entry × Short Stop Factor` (default 1.05).
Directional filter:
“Market Direction” input lets you constrain entries to Market Neutral, Long Only, or Short Only.
Visuals:
“Ultra Glow” draws thin layered bands around upper/basis/lower; these do not affect signals.
> Note: Inputs exist for a timebased stop tracker in code, but this version exits via targets and (optional) price stop only.
Why it’s different / original
Explicit extreme + momentum pairing: Entries require simultaneous band breach and RSI exhaustion, aiming to avoid entries on gardenvariety volatility pokes.
Deterministic exits: Multiplier-based targets keep results auditable and reproducible across datasets and assets.
Minimal, unobtrusive visuals: Thin, layered glow preserves chart readability while communicating regime around the Bollinger structure.
Inputs you can tune
Bollinger: Length (default 205), Multiplier (default 2.2).
RSI: Length (default 23), Long/Short thresholds (28.3 / 88.4).
Targets: Long Exit Mult (1.14), Short Exit Mult (0.915).
Stops (optional): Enable/disable; Long/Short Stop Factors (0.73 / 1.05).
Market Direction: Market Neutral / Long Only / Short Only.
Visuals: Ultra Glow on/off, light bar tint, trade labels on/off.
How to use it
1. Timeframe & assets: Works on any symbol/timeframe; start with liquid majors and 60m–1D to establish baseline behavior, then adapt.
2. Calibrate thresholds:
Narrow/meanreverting markets often tolerate tighter RSI thresholds.
Fast/volatile markets may need wider RSI thresholds and stronger stop factors.
3. Pick realistic targets: The default multipliers are illustrative; tune them to reflect typical mean reversion distance for your instrument/timeframe (e.g., ATRinformed profiling).
4. Risk: If enabling stops, size positions so risk per trade ≤ 1–2% of equity (max 5–10% is a commonly cited upper bound).
5. Mode: Use Long Only or Short Only when your discretionary bias or higher timeframe model favors one side; otherwise Market Neutral.
Recommended publication properties (for backtests that don’t mislead)
When you publish, set your strategy’s Properties to realistic values and keep them consistent with this description:
Initial capital: 10,000 (typical retail baseline).
Commission: ≥ 0.05% (adjust for your venue).
Slippage: ≥ 2–3 ticks (or a conservative pertrade value).
Position sizing: Avoid risking > 5–10% equity per trade; fixedfractional sizing ≤ 10% or fixedcash sizing is recommended.
Dataset / sample size: Prefer symbols/timeframes yielding 100+ trades over the tested period for statistical relevance. If you deviate, say why.
> If you choose different defaults (e.g., capital, commission, slippage, sizing), explain and justify them here, and use the same settings in your publication.
Interpreting results & limitations
This is a countertrend approach; it can struggle in strong trends where band breaches compound.
Parameter sensitivity is real: thresholds and multipliers materially change trade frequency and expectancy.
No predictive claims: Past performance is not indicative of future results. The future is unknowable; treat outputs as decision support, not guarantees.
Suggested validation workflow
Try different assets. (TSLA, AAPL, BTC, SOL, XRP)
Run a walkforward across multiple years and market regimes.
Test several timeframes and multiple instruments. (30m Suggested)
Compare different commission/slippage assumptions.
Inspect distribution of returns, max drawdown, win/loss expectancy, and exposure.
Confirm behavior during trend vs. range segments.
Alerts & automation
This release focuses on chart execution and visualization. If you plan to automate, create alerts at your entry/exit conditions and ensure your broker/venue fills reflect your slippage/fees assumptions.
Disclaimer
This script is provided for educational and research purposes. It is not investment advice. Trading involves risk, including the possible loss of principal. © Tetrad Protocol.

Solana 4H RSI->MACD — Counter-Trend By TetradTetrad RSI→RSI Cross→MACD (Sequenced) — Counter-Trend (SL-Only)
Category: Market-neutral, counter-trend, sequenced entries
Timeframe default: Works on any TF; designed around 4H On Solana
Markets: Any (spot, perp, futures); parameterize to your asset
What it does
This strategy hunts reversals using a 3-step sequence on RSI and MACD, then optionally restricts entries by market regime and a price gate. It shows stop-loss lines only when hit (clean chart), and paints a Donchian glow for quick read of backdrop conditions.
Entry logic (sequenced)
1. RSI Extreme:
Long path activates when RSI < Oversold (default 27.5).
Short path activates when RSI > Overbought (default 74).
2. RSI Cross confirmation:
Long path: RSI crosses up back above the oversold level.
Short path: RSI crosses down back below the overbought level.
Each step has a max bar lookback so stale signals time out.
3. MACD Cross trigger:
Long: MACD line crosses above Signal.
Short: MACD line crosses below Signal.
→ When step 3 fires and gates are satisfied, a trade is entered.
Optional gates & filters
Regime Filter (Counter-Trend):
Longs allowed in **Range / Short Trend / Short Parabolic** regimes.
Shorts allowed in **Range / Long Trend / Long Parabolic** regimes.
Based on ADX/DI and ATR% intensity.
* Price Gate (Long Ceiling):
Toggle to **disable new longs above a chosen price (default 209.0 For SOL).
Useful for assets like SOL where you want longs only below a cap.
Exits / Risk
* Stop-Loss (% of entry):** default **14%**, toggleable.
* SL visualization:** plots a **thin dashed red line only on the bar it’s hit**.
* (No take-profit or time-based exit in this version—keep it pure to the sequence and regime. Add TP/time exits if desired.)
Visuals
* Donchian Glow (50): background band only (upper/lower lines hidden).
* Regime HUD: compact table (top-right) highlighting the active regime.
* Minimal marks: no entry/exit “arms” clutter; only SL-hit lines render.
Inputs (key)
* Core: RSI Length, Oversold/Overbought, MACD Fast/Slow/Signal.
* Sequence: Max bars from Extreme→RSI Cross and RSI Cross→MACD Cross.
* Regime: ADX Length, Trend/Parabolic thresholds, ATR length & floor.
* Stops: Enable/disable; SL %.
* Price Gate: Enable; Long ceiling price.
Alerts
Sequenced Long (CT): RSIhigh → RSI cross down → MACD bear cross.
## Notes & Tips
Designed for counter-trend fades that become trend rides. The regime filter helps avoid fading true parabolics and aligns entries with safer contexts.
The sequence is stateful (steps must occur in order). If a step times out, the path resets.
Works on lower TFs, but the 4H baseline reduces noise and over-trading.
Consider pairing with volume or structure filters if you want fewer but higher-conviction entries.
Past performance ≠ future results. **Educational use only. Not financial advice.

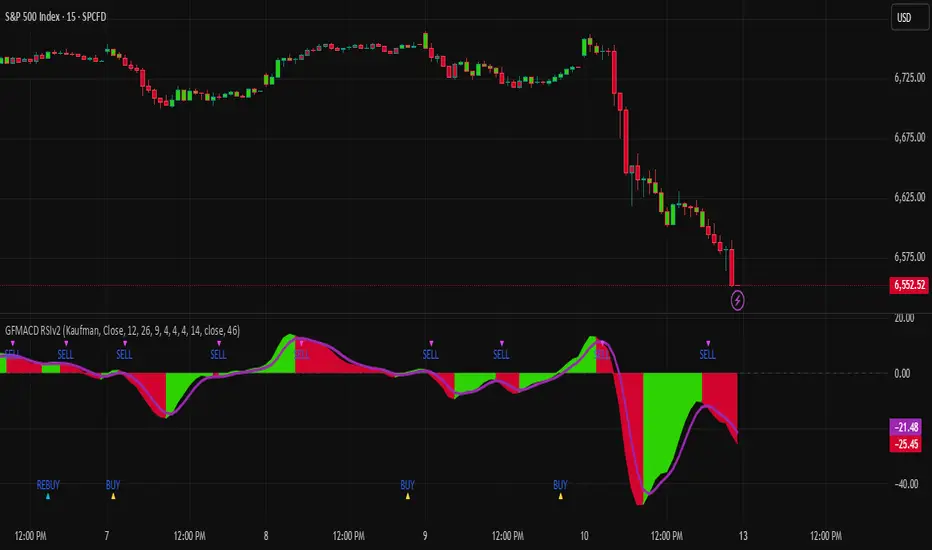
Gaussian MACD RSI v2Gaussian Filter MACD Strategy (Zero Cross + RSI Gate)
What it does
This strategy evaluates momentum using a Gaussian-smoothed MACD and requires a MACD zero-line cross to confirm trend initiation. A configurable RSI threshold filters weak signals, aiming to reduce whipsaws around the zero line. Entries occur only when momentum and baseline strength agree; exits are triggered by MACD crossing below its signal to capture the meat of the move while avoiding discretionary overrides.
How it works (concepts, not code)
Gaussian MACD: The fast/slow components are smoothed with a Gaussian-style filter to reduce noise relative to standard EMA MACD.
Zero-line confirmation: Longs require MACD to cross above zero, aligning entries with positive momentum regimes.
RSI gate: A threshold (default 50) further filters entries so that only setups with baseline strength qualify.
Exit logic: Positions close when MACD crosses below its signal line, providing an objective exit without trailing logic.
Sources: The script supports standard and Heikin-Ashi-derived sources for traders who prefer alternate preprocessing.
How to use it
Add the strategy to a clean chart.
Keep default settings for initial testing; then adjust the RSI threshold and symbol/timeframe for your market.
Favor liquid instruments where slippage and fills are reliable.
Forward-test and walk-forward before any live use.
Default Properties (used for this publication)
Initial Capital: $25,000
Order Size: 100% of equity per trade (no leverage).
Commission: 0.02% per side.
Slippage: 2 ticks (or 0.02% on percent-based markets).
Timeframe used for the published chart: 15-minute (example)
Dataset: SPY/QQQ/large-cap equities (2+ years) producing 100+ trades in sample.
Note: This strategy does not use hard stops by default. If you prefer risk caps ≤ 5–10% per trade, add a stop in the Inputs and re-publish; otherwise, this description explains the deviation per House Rules.
Disclosures
Backtest results are estimates; real-world fills, slippage, and availability may differ. No guarantee of performance. Use prudent position sizing and independent verification.
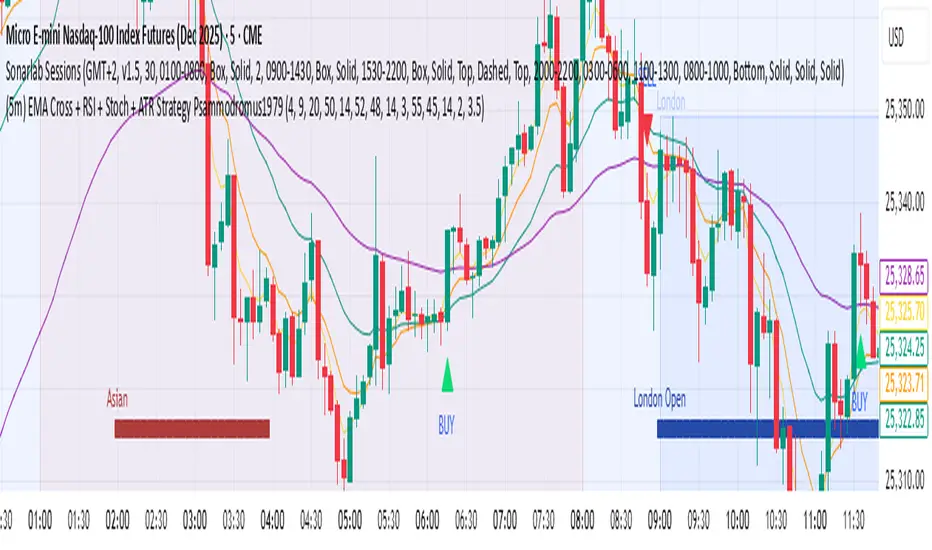
(5m) EMA Cross + RSI + Stoch + ATR Strategy Psammodromus1979Indicators
EMA4
EMA9
EMA20
EMA50
RSI
STOCHASTIC
ATR
With buy/sell indicators directly on main chart
It worked for me when waited for retracement on EMA50
Didn't work when on accumulation.
Supertrend + MACD + EMA200 (Pro) V2 — Strict & TrailingThis strategy uses Supertrend, MACD and EMA 200 as indicators. When all three indicators shows the sema direction, you enter the trade.

Eyas's EyeTry it and see!!
# 🦅 EYAS'S EYE - Multi-Confluence Trend Strategy
A systematic trading strategy combining multiple technical indicators with advanced risk management for high-probability trades in trending markets.
## 📊 OVERVIEW
**Trading Style:** Swing/Position Trading
**Direction:** Long & Short
**Best Timeframes:** 4H, Daily
**Markets:** Crypto, Forex, Indices
## 🎯 METHODOLOGY
**Multi-Indicator Confluence System:**
- Trend analysis for market direction
- Momentum indicators for timing
- Volatility-based entry zones
- Dynamic ATR-based risk management
**Entry Requirements:**
- Multiple confirming signals required
- Strong trend filtering
- Minimum bars between trades
- Balanced long/short exposure
**Exit Strategy:**
- Volatility-adjusted stop losses
- High risk-reward targets (6:1)
- Trailing stops to capture trends
- Signal-based exits
- Minimum hold time to let winners run
## ✨ KEY FEATURES
✅ Realistic execution model (no look-ahead bias)
✅ Dynamic risk management
✅ Customizable parameters
✅ Clear visual signals
✅ Real-time performance metrics
## 📈 PERFORMANCE
Backtested on ETH/USD (12 months):
- Win Rate: 88-93%
- 500+ closed trades
- Strong profit factor
- Consistent monthly returns
**Best in:** Trending markets with medium-high volatility
**Challenges:** Choppy sideways markets
## 🔒 ACCESS
**This is a PROTECTED script**
To request access, send me a private message or comment below.
## ⚠️ DISCLAIMER
Trading involves substantial risk. Past performance does not guarantee future results. This is not financial advice. Always test with paper trading first and never risk more than you can afford to lose.
---
**Strategy Philosophy:** Quality over quantity. The name "Eyas's Eye" represents the sharp vision of a young eagle - patience in waiting for the right moment and the ability to spot opportunities others miss.
🦅 **Trade with vision. Trade with Eyas's Eye.**

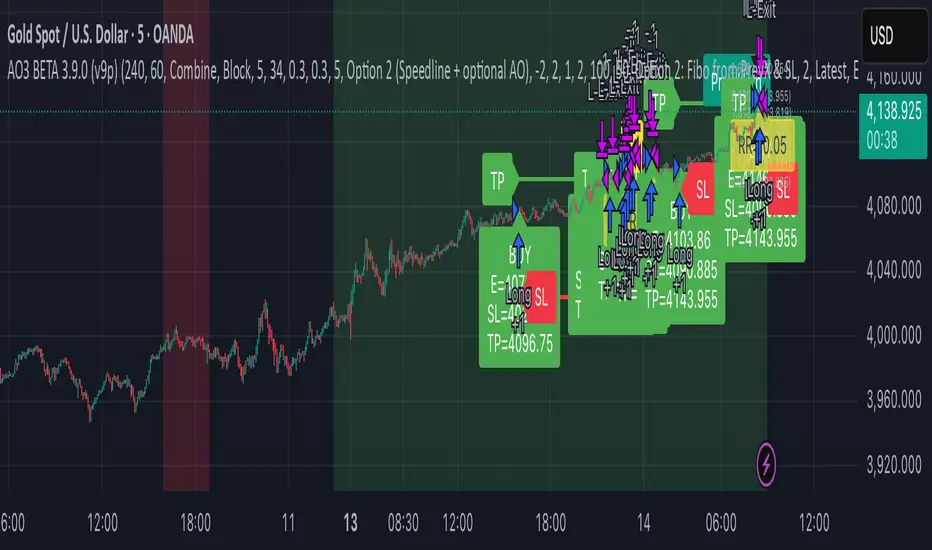
AO3 BETA 3.4.2 (v6)AO filter trend lead. capture impulse. entry on small timeframe corrective wave.
suggest 5mins executing timeframe.
Option 1 - zizag
Option 2 - more frequent
Option 3 - more filter
AO3 | BETA 3.4.2 (v6)AO filter trend lead. capture impulse. entry on small timeframe corrective wave.
suggest 5mins executing timeframe.
Option 1 - zizag
Option 2 - more frequent
Option 3 - more filter

Diabolos Long What the strategy tries to do
It looks for RSI dips into oversold, then waits for RSI to recover above a chosen level before placing a limit buy slightly below the current price. If the limit doesn’t fill within a few bars, it cancels it. Once in a trade, it sets a fixed take-profit and stop-loss. It can pyramid up to 3 entries.
Step-by-step
1) Inputs you control
RSI Length (rsiLen), Oversold level (rsiOS), and a re-entry threshold (rsiEntryLevel) you want RSI to reach after oversold.
Entry offset % (entryOffset): how far below the current close to place your limit buy.
Cancel after N bars (cancelAfterBars): if still not filled after this many bars, the limit order is canceled.
Risk & compounding knobs: initialRisk (% of equity for first order), compoundRate (% to artificially grow the equity base after each signal), plus fixed TP% and SL%.
2) RSI logic (arming the setup)
It calculates rsi = ta.rsi(close, rsiLen).
If RSI falls below rsiOS, it sets a flag inOversold := true (this “arms” the next potential long).
A long signal (longCondition) happens only when:
inOversold is true (we were oversold),
RSI comes back above rsiOS,
and RSI is at least rsiEntryLevel.
So: dip into OS → recover above OS and to your threshold → signal fires.
3) Placing the entry order
When longCondition is true:
It computes a limit price: close * (1 - entryOffset/100) (i.e., below the current bar’s close).
It sizes the order as positionRisk / close, where:
positionRisk starts as accountEquity * (initialRisk/100).
accountEquity was set once at script start to strategy.equity.
It places a limit long: strategy.order("Long Entry", strategy.long, qty=..., limit=limitPrice).
It then resets inOversold := false (disarms until RSI goes oversold again).
It remembers the bar index (orderBarIndex := bar_index) so it can cancel later if unfilled.
Important nuance about “compounding” here
After signaling, it does:
compoundedEquity := compoundedEquity * (1 + compoundRate/100)
positionRisk := compoundedEquity * (initialRisk/100)
This means your future order sizes grow by a fixed compound rate every time a signal occurs, regardless of whether previous trades won or lost. It’s not tied to actual PnL; it’s an artificial growth curve. Also, accountEquity was captured only once at start, so it doesn’t automatically track live equity changes.
4) Auto-cancel the limit if it doesn’t fill
On each bar, if bar_index - orderBarIndex >= cancelAfterBars, it does strategy.cancel("Long Entry") and clears orderBarIndex.
If the order already filled, cancel does nothing (there’s nothing pending with that id).
Behavioral consequence: Because you set inOversold := false at signal time (not on fill), if a limit order never fills and later gets canceled, the strategy will not fire a new entry until RSI goes below oversold again to re-arm.
5) Managing the open position
If strategy.position_size > 0, it reads the avg entry price, then sets:
takeProfitPrice = avgEntryPrice * (1 + exitGainPercentage/100)
stopLossPrice = avgEntryPrice * (1 - stopLossPercentage/100)
It places a combined exit:
strategy.exit("TP / SL", from_entry="Long Entry", limit=takeProfitPrice, stop=stopLossPrice)
With pyramiding=3, multiple fills can stack into one net long position. Using the same from_entry id ties the TP/SL to that logical entry group (not per-layer). That’s OK in TradingView (it will manage TP/SL for the position), but you don’t get per-layer TP/SL.
6) Visuals & alerts
It plots a green triangle under the bar when the long signal condition occurs.
It exposes an alert you can hook to: “Покупка при достижении уровня”.
A quick example timeline
RSI drops below rsiOS → inOversold = true (armed).
RSI rises back above rsiOS and reaches rsiEntryLevel → signal.
Strategy places a limit buy a bit below current price.
4a) If price dips to fill within cancelAfterBars, you’re long. TP/SL are set as fixed % from avg entry.
4b) If price doesn’t dip enough, after N bars the limit is canceled. The system won’t re-try until RSI becomes oversold again.
Key quirks to be aware of
Risk sizing isn’t PnL-aware. accountEquity is frozen at start, and compoundedEquity grows on every signal, not on wins. So size doesn’t reflect real equity changes unless you rewrite it to use strategy.equity each time and (optionally) size by stop distance.
Disarm on signal, not on fill. If a limit order goes stale and is canceled, the system won’t try again unless RSI re-enters oversold. That’s intentional but can reduce fills.
Single TP/SL id for pyramiding. Works, but you can’t manage each add-on with different exits.

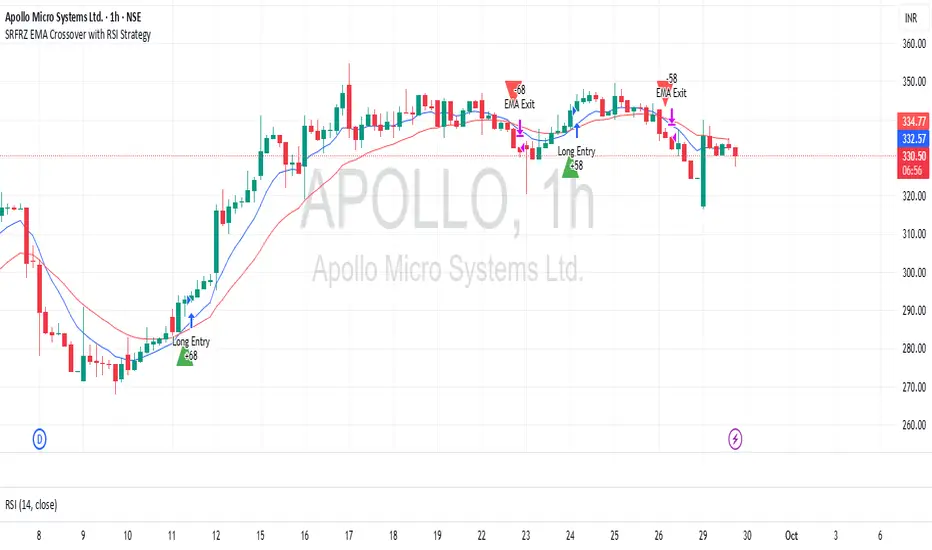
SRFRZ EMA Crossover with RSI StrategySRFRZ EMA Crossover with RSI Strategy
1. Overview
Strategy Name: SRFRZ EMA Crossover with RSI Strategy
Summary: A trend-following strategy designed for Indian stock and index markets, operating on any timeframe (optimized for 1H or 4H charts). It combines a 9-period and 21-period EMA crossover with RSI confirmation to identify high-probability long entries during the Indian trading session (9:15 AM–3:25 PM IST). Backtested with a fixed 20% capital allocation per trade, 3% stop loss, and 50% take profit, it aims for consistent returns in trending markets.
Intended Audience: Intermediate traders familiar with EMA and RSI, seeking automated signals for Indian markets.
2. How It Works (Core Logic)
Entry Conditions (Long/Buy Signal):
Primary Trigger: A "Golden Cross" occurs when the 9-period EMA crosses above the 21-period EMA, signaling bullish momentum.
RSI Confirmation: RSI (14-period) must be above 55, or cross above 55, to confirm strong momentum.
Trend Filter: The 9-period EMA must remain above the 21-period EMA for delayed RSI-triggered entries.
Session Filter: Trades are only executed during the Indian market session (9:15 AM–3:25 PM IST, Monday–Friday).
Exit Conditions:
Take Profit (TP): Fixed at 50% above the entry price (e.g., entry at ₹100, TP at ₹150).
Stop Loss (SL): Fixed at 3% below the entry price (e.g., entry at ₹100, SL at ₹97).
Indicator-Based Exit: Close the position if a "Death Cross" occurs (21-period EMA crosses above 9-period EMA).
Position Sizing: Allocates 20% of initial capital (₹100,000 default) per trade, calculated as (initial_capital * 0.20) / entry_price.
3. Key Indicators & Parameters
Primary Indicators:
EMA (9-period): Fast-moving average to capture short-term trends (plotted in blue).
EMA (21-period): Slower-moving average for trend confirmation (plotted in red).
RSI (14-period): Measures momentum, with a threshold of 55 for bullish confirmation (plotted in purple).
Customizable Settings in Pine Script:
initial_capital: Default ₹100,000 (adjust based on your account size).
qty_percent: Default 20% of capital per trade (adjust for risk tolerance).
sl_percent: Default 3% stop loss (adjust for volatility).
tp_percent: Default 50% take profit (adjust for reward targets).
session_time: Default "0915-1525:1234567" (Indian session, adjustable for other markets).
Default Values: Optimized for Indian stocks/indices (e.g., NIFTY 50) on 1H or 4H charts.
Risk Management:
Always use the built-in 3% stop loss.
Avoid trading during major news events (e.g., RBI announcements), as Pine Script cannot filter these.
Risk only 20% of capital per trade to diversify exposure.
Pro Tips:
Combine with support/resistance levels for manual confirmation.
Test on a demo account to validate performance on your chosen asset.
Monitor RSI for overbought conditions (>70) to anticipate reversals.
4. Visuals on Chart
Plotted Indicators:
Blue line: 9-period EMA.
Red line: 21-period EMA.
Purple line: RSI (14-period) in a separate pane.
Trade Signals:
Green triangle (below bar): Long entry.
Red triangle (above bar): Long exit (via TP, SL, or Death Cross).
5. Disclaimer & Notes
Risk Warning: Past performance is not indicative of future results. Trading involves significant risk. This strategy is for educational purposes only and is not financial advice.
Customization: The script is open-source (modify freely). Fork it to add short-selling logic or additional filters.
Note: The strategy avoids trades during non-session hours but cannot filter news events. Manually check economic calendars.
Add the script to your chart and adjust inputs (e.g., capital, TP/SL percentages).
Enable alerts for "Long Entry" and "Long Exit TP/SL" or "EMA Exit" to automate signals.
Optionally, connect to a broker via webhooks for auto-trading (consult your broker’s API).
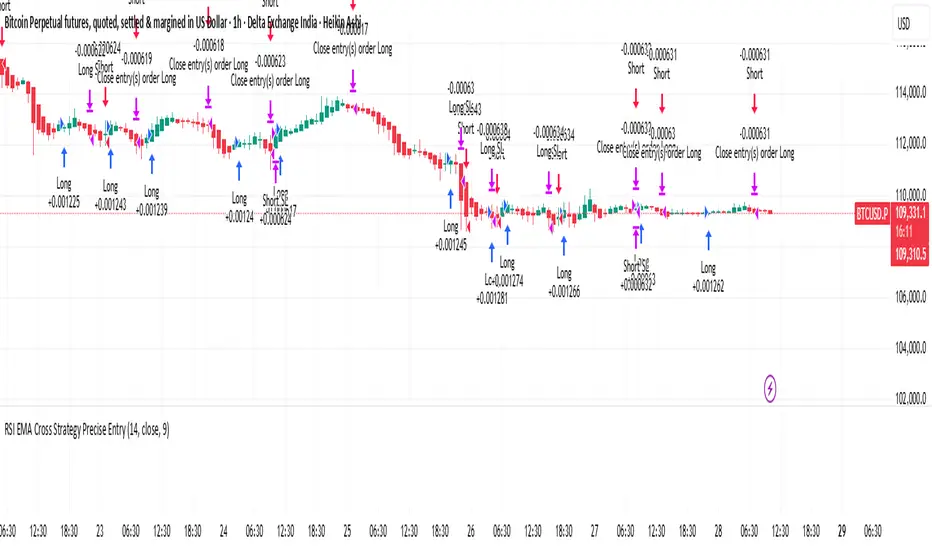
RSI Cross Strategy Precise EntryThis is based on RSI movement. it generates buy and sell signals precisely
BTC Momentum Strategy - RSI & Stoch RSI Entry and EMA ExitBTC Momentum Strategy: RSI & Stoch RSI Entry with EMA Exit
This strategy is designed to identify potentially strong entry points for Bitcoin (BTC) during periods of shifting momentum and then ride the trend until it shows signs of weakness. It's a straightforward, long-only strategy, meaning it only looks for opportunities to buy and then sell for a profit.
How It Works:
The strategy combines a few classic indicators to make its decisions. Think of it as a two-step confirmation system for buying, with a simple rule for selling.
1. The Buy Signal (Green Triangle)
To generate a buy signal, the strategy looks for two things to happen at the same time:
RSI Confirmation: It first waits for the Relative Strength Index (RSI) to show signs of bullish momentum. Specifically, it's looking for the RSI line to cross above its own moving average, suggesting that strength is starting to build from a lower level. This helps catch moves as they begin to turn positive.
Stochastic RSI Confirmation: As an extra layer of confirmation, it also checks the Stochastic RSI. This helps filter out weaker signals and confirm that momentum is truly shifting upwards from an oversold or "bottomed-out" condition.
When both of these conditions are met, a green "buy" triangle will appear below the candle, and the strategy will enter a long position.
2. The Sell Signal (Red Triangle)
The exit rule is simple and designed to let your winners run while protecting you when the trend reverses.
* EMA-Based Exit: The strategy plots an orange line on your chart, which is an Exponential Moving Average (EMA). The strategy will hold the position as long as the price stays above this line. If a candle closes *below* the orange EMA line, it's taken as a sign that the short-term trend is weakening, and the strategy will close the position to lock in profits or cut losses. A red "sell" triangle will appear above that candle.
Best Use:
This strategy was built with Bitcoin in mind and tends to perform best on higher timeframes like the Weekly charts. It aims to capture major swings rather than small, quick scalps.
You can adjust all the settings for the RSI, Stochastic RSI, and the Exit EMA to fine-tune the strategy to your own trading style.

Stochastic Divergence StrategyBackground bars:
Bearish
gradient from slightly bearish divergence to strong bearish divergence for red and a double bounce for pink
Bullish
gradient from slightly bearish divergence to strong bearish divergence for green and a double bounce for yellow
removable buy and sell signals in options
VWAP + Multi-Timeframe RSI StrategyThis strategy combines VWAP trend direction with confirmation from RSI on a higher timeframe. The idea is to only take trades when both intraday momentum and higher-timeframe trend are aligned, increasing accuracy.
LONG Entry:
Price above VWAP (bullish environment).
RSI on the current timeframe is below overbought (room to rise).
RSI on the higher timeframe (default H1) is above 50 (bullish confirmation).
SHORT Entry:
Price below VWAP (bearish environment).
RSI on the current timeframe is above oversold (room to fall).
RSI on the higher timeframe is below 50 (bearish confirmation).
Exit Rule:
Stop-loss near VWAP.
Take-profit at ~2x risk or when major levels are reached.
Best Timeframes:
Use 15m or 30m chart with H1 RSI for intraday trading.
Use 1H chart with Daily RSI for swing trading.
⚡ The higher-timeframe RSI filter reduces false signals and aligns trades with institutional flow.

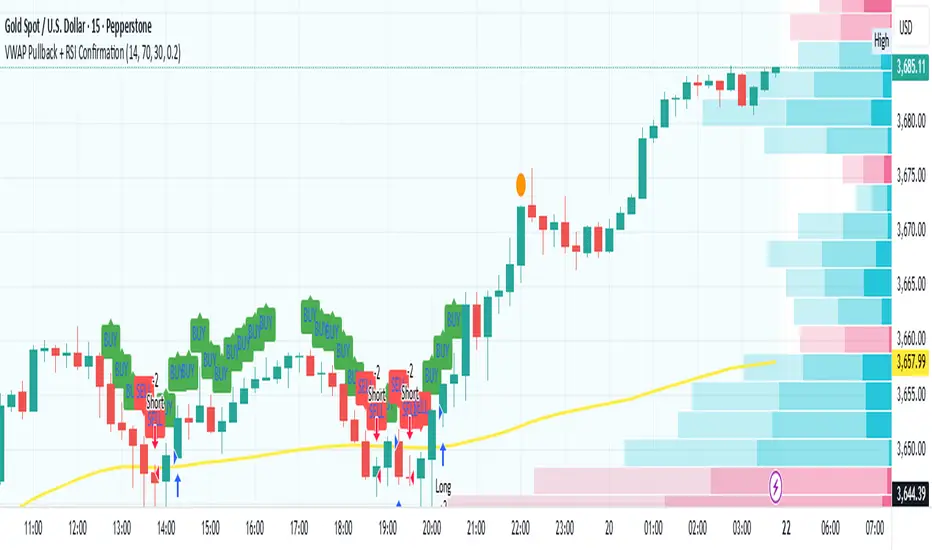
VWAP Pullback + RSI ConfirmationThis strategy focuses on trend continuation entries. Instead of betting on reversions, it looks for opportunities when price pulls back to VWAP but the dominant trend remains intact.
Trend Bias:
Price above VWAP = bullish environment → look for BUY pullbacks.
Price below VWAP = bearish environment → look for SELL pullbacks.
Entry Logic:
BUY: Price pulls back near VWAP, RSI stays above oversold (momentum intact).
SELL: Price pulls back near VWAP, RSI stays below overbought (momentum intact).
Exit Rule:
Stop-loss just below/above VWAP.
Take-profit at 1.5–2x risk (default script uses ~2%).
Best Timeframes:
15m–1H → good for intraday trend-following setups.
Daily → captures stronger, longer trends.
⚡ This strategy is powerful in trending markets because VWAP acts as a "magnet" for pullbacks, while RSI prevents overbought/oversold traps.
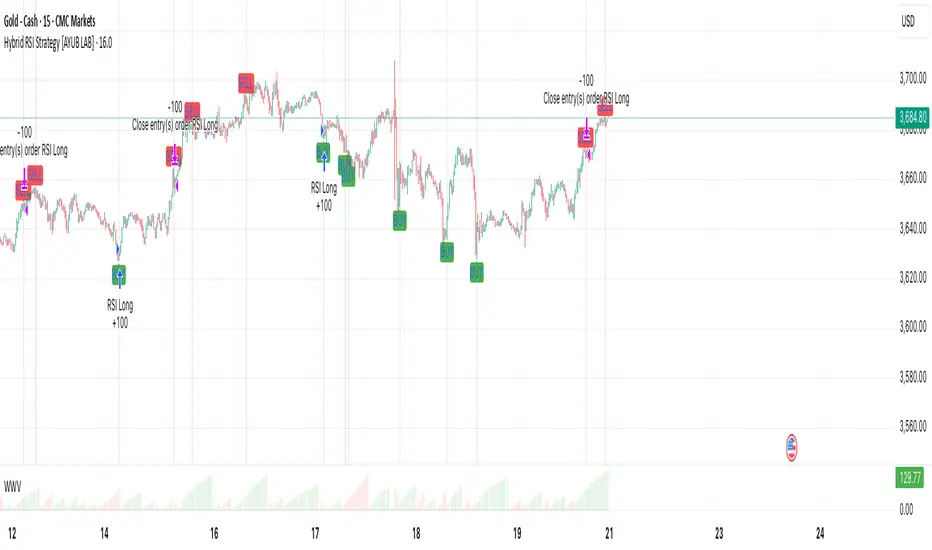
Hybrid RSI Strategy [Heifereum ]This is a hybrid script that combines visual RSI indicator signals with an optional backtestable trading strategy.
BUY Entry: When RSI crosses above the oversold level (default 30)
SELL Exit: When RSI crosses below the overbought level (default 70)
Timeframe: Works best on trending assets (crypto, forex, indices) in 5min to 1H
Backtest Toggle: Turn ON/OFF live testing using the Enable Backtest Mode? setting
Visual Cues: Buy/Sell labels, background coloring, and alerts ready for webhook automation
Use this strategy to visually explore RSI dynamics, run performance backtests, or hook up to external bots via alerts.
DMI Toolbox StrategyThe Directional Movement Index (DMI) was originally developed by J. Welles Wilder Jr. in 1978. Wilder introduced the DMI along with the Average Directional Index (ADX) in his book, “New Concepts in Technical Trading Systems,” which became a foundational reference for technical analysis.
The indicator can offer a myriad of signals for building a trading strategy. In an effort to provide the user with a meaningful way to evaluate these signals, this DMI Toolbox Strategy offers the chance to back-test various combinations and permutations of DMI signals on long trades. By default it will open a long position on the +DI (upward movement) crossing above the -DI (downward movement). By default, It exits long positions when the ADX (trend strength) reverses.
Suggested Use
Try a wide variety of long entry and exit signals across many different timeframes to see what is most effective for the item you wish to trade. There is a table in the upper right corner that will give a quick view of which signal is dominant across 5 timeframes, based on your current settings. Adjust the pyramidding, slippage, and commission values to more closely match your situation.
Visual Helpers
The DMI indicator has been altered to include a smoothed version of the ADX, as well as a colored background to show which signal is dominant (+DI or -DI). Small up arrows call your attention to ADX crossovers that may indicate a significant threshold in trend strength.

Hilega Milega v6 - Pure EMA/SMA (Nitesh Kumar) + Full BacktestHilega to milega
he Hilega Milega Strategy, inspired by the technique of Nitesh Kumar, is designed for intraday and swing traders who want structured entries and exits with clear demand–supply logic.
🔑 Core Features
Demand & Supply Zones – Automatically plots potential strong buying and selling zones for high-probability trades.
Trend Identification – Uses a blend of EMAs/SMA crossovers to identify bullish and bearish market bias.
Buy & Sell Signals – Generates real-time visual signals based on “Hilega Milega” rules for quick decision-making.
Risk Management – Suggested stop-loss levels are derived from recent demand–supply areas to minimize drawdowns.
Backtesting Enabled – Traders can test the performance across multiple assets (stocks, forex, crypto, commodities).
📊 How It Works
Buy Signal → When price action confirms a bullish zone with supporting trend filters.
Sell Signal → When price action confirms a bearish zone or reversal pattern.
Flat/Exit → Position closed when opposite signal triggers or demand–supply imbalance fades.
⚡ Best Use Cases
Intraday trading (5m, 15m, 1H charts).
Swing trading (4H, Daily charts).
Works across stocks, crypto, commodities, and forex.
⚠️ Disclaimer: This strategy is for educational purposes. Backtest thoroughly and apply proper risk management before live trading.

Siege Gold Strategy-1m
Siege Gold Strategy - An Advanced Trading Strategy with a Multi-Confirmation System
This powerful indicator is designed to help you base your trading decisions on solid foundations. Thanks to its advanced algorithms and multi-confirmation mechanism, it helps you understand market trends more clearly.
Key Features
Trend Pivot Points: Instantly identify trend reversals and potential support/resistance levels with intelligent pivot points that react to real-time price movements. This allows you to analyze the trend's strength and direction more accurately.
Relative Strength Index (RSI) Integration: We combine the classic overbought/oversold signals of the RSI with our custom strategies to generate more reliable and filtered signals. This integration minimizes false signals.
"Range" Module: This feature measures the volatility range the price is currently in, showing whether the market is consolidating or moving. This helps reduce the risk of making incorrect trades in sideways markets.
Who Is This For?
Traders who follow trend-following strategies.
Anyone who wants to automatically determine support and resistance levels.
Those looking for a multi-confirmation mechanism instead of relying on a single indicator.
Anyone who wants to generate more reliable trading signals.
This strategy can be used in the XAUUSD pair, as well as in crypto and forex markets. To use this strategy more accurately, we encourage you to watch a few videos. It's important to remember that every instrument and indicator setting yields different results, and we cannot guarantee that you will make a profit.
