Multi Timeframe Stochastic RSI ScreenerThis script is also a Stochastic RSI Screener, but it allows users to choose one specific symbol and three timeframes of that symbol to monitor at once.
Overbought

RSI TREND FILTERRSI TREND Filter on Chart
RSI scaled to fit on chart instead of oscillator, Trend Analysis is easy and Hidden Divergence is revealed using this indicator. This indicator is an aim to reduce confusing RSI Situations. The Oversold and Overbought lines help to determine the price conditions so its easy to avoid Traps.
Oversold and Overbought conditions are marked on Chart to make it useful to confirm a Buy or Sell Signals.
RSI 50 level is plotted with reference to EMA50 and Oversold and Overbought Conditions are calculated accordingly.
Uptrend: RSI Cloud / Candles above RSI 50 Level
Down Trend: RSI Cloud / Candles below RSI 50 Level
Sideways : Candles in the Gray Area above and below RSI 50 Level
Default RSI (14) : is the Candlestick pattern itself
Disclaimer: Use Solely at your own Risk.

Fair value bands / Flowly Indicators— Overview
Fair value bands, like other band tools, depict dynamic points in price where price behaviour is normal or abnormal, i.e. trading at/around mean (price at fair value) or deviating from mean (price outside fair value). Unlike constantly readjusting standard deviation based bands, fair value bands are designed to be smooth and constant, based on typical historical deviations. The script calculates pivots that take place above/below fair value basis and forms median deviation bands based on this information. These points are then multiplied up to 3, representing more extreme deviations.
By default, the script uses OHLC4 and SMA 20 as basis for the bands. Users can form their preferred fair value basis using following options:
Price source
- Standard OHLC values
- HL2 (High + low / 2)
- OHLC4 (Open + high + low + close / 4)
- HLC3 (High + low + close / 3)
- HLCC4 (High + low + close + close / 4)
Smoothing
- SMA
- EMA
- HMA
- RMA
- WMA
- VWMA
- Median
Once fair value basis is established, some additional customization options can be employed:
Trend mode
Direction based
Cross based
Trend modes affect fair value basis color that indicates trend direction. Direction based trend considers only the direction of the defined fair value basis, i.e. pointing up is considered an uptrend, vice versa for downtrend. Cross based trends activate when selected source (same options as price source) crosses fair value basis. These sources can be set individually for uptrend/downtrend cross conditions. By default, the script uses cross based trend mode with low and high as sources.
Cross based (downtrend not triggered) vs. direction based (downtrend triggered):
Threshold band
Threshold band is calculated using typical deviations when price is trading at fair value basis. In other words, a little bit of "wiggle room" is added around the mean based on expected deviation. This feature is useful for cross based trends, as it allows filtering insignificant crosses that are more likely just noise. By default, threshold band is calculated based on 1x median deviation from mean. Users can increase/decrease threshold band width via input menu for more/less noise filtering, e.g. 2x threshold band width would require price to cross wiggle room that is 2x wider than typical, 0x erases threshold band altogether.
Deviation bands
Width of deviation bands by default is based on 1x median deviations and can be increased/decreased in a similar manner to threshold bands.
Each combination of customization options produces varying behaviour in the bands. To measure the behaviour and finding fairest representation of fair and unfair value, some data is gathered.
— Fair value metrics
Space between each band is considered a lot, named +3, +2, +1, -1, -2, -3. For each lot, time spent and volume relative to volume moving average (SMA 20) is recorded each time price is trading in a given lot:
Depending on the asset, timeframe and chosen fair value basis, shape of the distributions vary. However, practically always time is distributed in a normal bell curve shape, being highest at lots +1 to -1, gradually decreasing the further price is from the mean. This is hardly surprising, but it allows accurately determining dynamic areas of normal and abnormal price behaviour (i.e. low risk area between +1 and -1, high risk area between +-2 to +-3). Volume on the other hand is typically distributed the other way around, being lowest at lots +1 to -1 and highest at +-2 to +-3. When time and volume are distributed like so, we can conclude that 1) price being outside fair value is a rare event and 2) the more price is outside fair value, the more anomaly behaviour in volume we tend to find.
Viewing metric calculations
Metric calculation highlights can be enabled from the input menu, resulting in a lot based coloring and visibility of each lot counter (time, cumulative relative volume and average relative volume) in data window:
— Alerts
Available alerts are the following:
Individual
- High crossing deviation band (bands +1 to +3 )
- Low crossing deviation band (bands -1 to -3 )
- Low at threshold band in an uptrend
- High at threshold band in a downtrend
- New uptrend
- New downtrend
Grouped
- New uptrend or downtrend
- Deviation band cross (+1 or -1)
- Deviation band cross (+2 or -2)
- Deviation band cross (+3 or -3)
— Practical guide
Example #1 : Risk on/risk off trend following
Ideal trend stays inside fair value and provides sufficient cool offs between the moves. When this is the case, fair value bands can be used for sensible entry/exit levels within the trend.
Example #2 : Mean reversions
When price shows exuberance into an extreme deviation, followed by a stall and signs of exhaustion (wicks), an opportunity for mean reversion emerges. The higher the deviation, the more volatility in the move, the more signalling of exhaustion, the better.
Example #3 : Tweaking bands for desired behaviour
The faster the length of fair value basis, the more momentum price needs to hit extreme deviation levels, as bands too are moving faster alongside price. Decreasing fair value basis length typically leads to more quick and aggressive deviations and less steady trends outside fair value.

ROC (Rate of Change) Refurbished▮ Introduction
The Rate of Change indicator (ROC) is a momentum oscillator.
It was first introduced in the early 1970s by the American technical analyst Welles Wilder.
It calculates the percentage change in price between periods.
ROC takes the current price and compares it to a price 'n' periods (user defined) ago.
The calculated value is then plotted and fluctuates above and below a Zero Line.
A technical analyst may use ROC for:
- trend identification;
- identifying overbought and oversold conditions.
Even though ROC is an oscillator, it is not bounded to a set range.
The reason for this is that there is no limit to how far a security can advance in price but of course there is a limit to how far it can decline.
If price goes to $0, then it obviously will not decline any further.
Because of this, ROC can sometimes appear to be unbalanced.
(TradingView)
▮ Improvements
The following features were added:
1. Eight moving averages for the indicator;
2. Dynamic Zones;
3. Rules for coloring bars/candles.
▮ Motivation
Averages have been added to improve trend identification.
For finer tuning, you can choose the type of averages.
You can hide them if you don't need them.
The Dynamic Zones has been added to make it easier to identify overbought/oversold regions.
Unlike other oscillators like the RSI for example, the ROC does not have a predetermined range of oscillations.
Therefore, a fixed line that defines an overbought/oversold range becomes unfeasible.
It is in this matter that the Dynamic Zone helps.
It dynamically adjusts as the indicator oscillates.
▮ About Dynamic Zones
'Most indicators use a fixed zone for buy and sell signals.
Here's a concept based on zones that are responsive to the past levels of the indicator.'
The concept of Dynamic Zones was described by Leo Zamansky (Ph.D.) and David Stendahl, in the magazine of Stocks & Commodities V15:7 (306-310).
Basically, a statistical calculation is made to define the extreme levels, delimiting a possible overbought/oversold region.
Given user-defined probabilities, the percentile is calculated using the method of Nearest Rank.
It is calculated by taking the difference between the data point and the number of data points below it, then dividing by the total number of data points in the set.
The result is expressed as a percentage.
This provides a measure of how a particular value compares to other values in a data set, identifying outliers or values that are significantly higher or lower than the rest of the data.
▮ Thanks and Credits
- TradingView: for ROC and Moving Averages
- allanster: for Dynamic Zones

RSI Overbought/Oversold + Divergence IndicatorDESCRIPTION:
This script combines the Relative Strength Index ( RSI ), Moving Average and Divergence indicator to make a better decision when to enter or exit a trade.
- The Moving Average line (MA) has been made hidden by default but enhanced with an RSIMA cloud.
- When the RSI is above the selected MA it turns into green and when the RSI is below the select MA it turns into red.
- When the RSI is moving into the Overbought or Oversold area, some highlighted areas will appear.
- When some divergences or hidden divergences are detected an extra indication will be highlighted.
- When the divergence appear in the Overbought or Oversold area the more weight it give to make a decision.
- The same color pallet has been used as the default candlestick colors so it looks familiar.
HOW TO USE:
The prerequisite is that we have some knowledge about the Elliot Wave Theory, the Fibonacci Retracement and the Fibonacci Extension tools.
Wave 1
(1) When we receive some buy signals we wait until we receive some extra indications.
(2) On the RSI Overbought/Oversold + Divergence Indicator we can see a Bullish Divergence and our RSI is changing from red to green ( RSI is higher then the MA).
(3) If we are getting here into the trade then we need to use a stop loss. We put our stop loss 1 a 2 pips just below the lowest wick. We also invest maximum 50% of the total amount we want to invest.
Wave 2
(4) Now we wait until we see a clear reversal and here we starting to use the Fibonacci Retracement tool. We draw a line from the lowest point of wave(1) till the highest point of wave (1). When we are retraced till the 0.618 fib also called the golden ratio we check again the RSI Overbought/Oversold + Divergence Indicator. When we see a reversal we do our second buy. We set again a stop loss just below the lowest wick (this is the yellow line on the chart). We also move the stop loss we have set in step (3) to this level.
Wave 3
(5) To identify how far the uptrend can go we need to use the Fibonacci Extension tool. We draw a line from the lowest point of wave(1) till the highest point of wave (1) and draw it back to the lowest point of wave (2). Wave (3) is most of the time the longest wave and can go till it has reached the 1.618 or 2.618 fib. On the 1.618 we can take some profit. If we don't want to sell we move our stop loss to the 1 fib line (yellow line on the chart).
(6) We wait until we see a clear reversal on the Overbought/Oversold + Divergence Indicator and sell 33% to 50% of our investment.
Wave 4
(7) Now we wait again until we see a clear reversal and here we starting to use the Fibonacci Retracement tool. We draw a line from the lowest point of wave(2) till the highest point of wave (3). When we are retraced till the 0.618 fib also called the golden ratio we check again the RSI Overbought/Oversold + Divergence Indicator. When we see a reversal we buy again. We set again a stop loss just below the lowest wick (this is the yellow line on the chart).
(8) If we bought at the first reversal ours stop los was triggered (9) and we got out of the trade.
(9) If we did not bought at step (7) because our candle did not hit the 0.618 fib or we got stopped out of the trade we buy again at the reversal.
Wave 5
(10) To identify how far the uptrend can go we need to use the Fibonacci Extension tool. We draw a line from the lowest point of wave(2) till the highest point of wave (3) and draw it back to the lowest point of wave (4). Most of the time wave 5 goes up till it has reached the 1 fib. And that is the point where we got out of the trade with all of our investment. In this trade we got out of the trade a bit earlier. We received the sell signals and got a reversal on the Overbought/Oversold + Divergence Indicator.
We are hoping you learned something so you can make better decisions when to get into or out of a trade.
If you have any question just drop it into the comments below.
FEATURES:
• You can show/hide the RSI .
• You can show/hide the MA.
• You can show/hide the lRSIMA cloud.
• You can show/hide the Stoch RSI cloud.
• You can show/hide and adjust the Overbought and Oversold zones.
• You can show/hide and adjust the Overbought Extended and Oversold Extended zones.
• You can show/hide the Overbought and Oversold highlighted zones.
• Etc...
HOW TO GET ACCESS TO THE SCRIPT:
• Favorite the script and add it to your chart.
REMARKS:
• This advice is NOT financial advice.
• We do not provide personal investment advice and we are not a qualified licensed investment advisor.
• All information found here, including any ideas, opinions, views, predictions, forecasts, commentaries, suggestions, or stock picks, expressed or implied herein, are for informational, entertainment or educational purposes only and should not be construed as personal investment advice.
• We will not and cannot be held liable for any actions you take as a result of anything you read here.
• We only provide this information to help you make a better decision.
• While the information provided is believed to be accurate, it may include errors or inaccuracies.
Good Luck and have fun,
The CryptoSignalScanner Team

RSI Multi Length With Divergence Alert [Skiploss]This is a modified indicator base code from RSI Multi Length and we will add some of functions by finding a classic/hidden divergence and alert.
The indicator returns information over RSI using multiple periods and calculates the percentage of overbought and oversold by overbought divided by oversold.
To find the divergence and hidden divergence we use base code from platform (Divergence Indicator) but change the input from normal to the average (RSI Multi Length).
RSI Settings
Maximum Length is maximum period.
Minimum Length is minimum period.
Overbought Level is value of the overbought level .
Oversold Level is value of the oversold level.
Source is input source of the indicator.
Divergence Settings
Pivot Right is value look back to the right side.
Pivot Left is value look back to the left side.
Max Range is maximum range value.
Min Range is minimum range value.
Alert Settings
It will be part of display of Divergence and Hidden Divergence.
Style Settings
Color of overbought/oversold/Bullish/Bearish which you can change as you wish.

Stoch RSI 15 min - multi time frame tableABOUT THIS INDICATOR
This indicator calculates the Stochastic RSI for the time frames 15 min, 30 min, 1h, 4h, and 12h. However, the 15 min time frame should always be the default time frame for your chart.
IMPORTANT
* NOTE! It's extremely important that the chosen time frame for your chart is 15 min. Otherwise the Stochastic RSI for the longer time frames won’t be correctly calculated.
* Stochastic RSI will be calculated and displayed in a table for the time frames: 15 min, 30 min, 1h, 4h, 12h.
* All time frames are based on closed bars except the "15minR" that are realtime updated values calculated on a 15 min time frame.
ABOUT STOCHASTIC RSI
The Stochastic RSI (StochRSI) is a momentum indicator that ranges between 0 and 100. A Stochastic RSI value above 80 is considered overbought and below 20 is considered oversold.
By using different time frames you can get a better idea of what direction the trade could take in a "longer" perspective.
SETTINGS
1.) Length RSI = 14 (default period)
2.) Smoothing parameter of Stochastic RSI (Length Moving Average = 3) . Moving average of stochastic RSI
* By default the displayed Stochastic RSI values are smoothed values of the actual Stochastic RSI. The smoothnes is formed by a calculated moving average of with the length of 3 by default.
If you want Stochastic RSI with a sharper signal (higher risk for "false alarms" being more sensitive) change the Length Moving Average to = 1 (no smoothness at all)
You can see the selected "Length RSI" and "Length Moving Average" on top of the Stochastic RSI table.
Next version of this script will be updated with more a more flexible solution for different time frames.
* NOTE, Tradingview comes with a inbuilt Stochastic RSI. See the the chart below. The blue line in the Stochastic-RSI chart represents (K value = 3) the same value as the script calculate/display in the table.

Adaptive Fisherized CMOIntroduction
Heyo, here is another no-repaint adaptive fisherized indicator.
I added Inverse Fisher Transform, Ehlers dominant cycle analysis and smoothing to the Chande Momentum Oscillator (CMO).
Usage
The CMO is a momentum oscillator which shows the usual movement of an asset.
I recommend to use it from a lower timeframe with a higher timeframe set.
Signals
(Signal mode will come soon.)
Zero Line
CMO crosses above zero line => enter long
CMO cross below zero line => ente short
Overbought/Oversold
CMO crosses above bottom band => enter long
CMO crosses under top band => enter short
MA (Maybe this signals will vary. Then, check update notes.)
CMO crosses above MA => enter long
CMO crosses below MA => enter short
Enjoy and share your experience with it!
More to read: CMO Explanationsp

Colorful Channelwhat is "Colorful Channel"?
it is a overbought - oversold indicator.
what it does?
It fills the area between the upper band of the channel and the price line with green, the area between the lower band of the channel and the price line with red color and applies a transparency to these colors according to the distance of the price from the channel lines. thus allowing users to get an idea of ??the current value of the price.
how it does it?
subtracts the percentage of the price from the lower channel from the transparency ratio of the red color, and the percentage of the price from the upper band from the transparency ratio of the green color. thus, a different transparency value is obtained for each percentile. In addition, the transparency rate can be changed with a multiplier determined by the users.
how to use it?
In the "lenght" section, you select the number of bars that the indicator will base backwards on. For example, if length=100, the indicator determines the upper and lower bands according to the distances from the highest and lowest values ??within 100 bar. so the length part works like donchian channels.
You can change the transparency ratio of the colors in the "transp" section.
1 saat transp
yan trend
4 saat

Stochastic Vix Fix SVIX (Tartigradia)The Stochastic Vix or Stochastic VixFix (SVIX), just like the Williams VixFix, is a realized volatility indicator, and can help in finding market bottoms as well as tops without requiring bollinger bands or any other construct, as the SVIX is bounded between 0-100 which allows for an objective thresholding regardless of the past.
Mathematically, SVIX is the complement of the original Stochastic Oscillator, with such a simple transform reproducing Williams' VixFix and the VIX index signals of high volatility and hence of market bottoms quite accurately but within a bounded 0-100 range. Having a predefined range allows to find markets bottoms without needing to compare to past prices using a bollinger band (Chris Moody on TradingView) nor a moving average (Hesta 2015), as a simple threshold condition (by default above 80) is sufficient to reliably signal interesting entry points at bottoming prices.
Having a predefined range allows to find markets bottoms without needing to compare to past prices using a bollinger band (Chris Moody on TradingView) nor a moving average (Hesta 2015), as a simple threshold condition (by default above 80) is sufficient to reliably signal interesting entry points at bottoming prices.
Indeed, as Williams describes in his paper, markets tend to find the lowest prices during times of highest volatility, which usually accompany times of highest fear.
Although the VixFix originally only indicates market bottoms, the Stochastic VixFix can also indicate good times to exit, when SVIX is at a low value (default: below 20), but just like the original VixFix and VIX index, exit signals are as usual much less reliable than long entries signals, because: 1) mature markets such as SP500 tend to increase over the long term, 2) when market fall, retail traders panic and hence volatility skyrockets and bottom is more reliably signalled, but at market tops, no one is panicking, price action only loses momentum because of liquidity drying up.
Compared to Hesta 2015 strategy of using a moving average over Williams' VixFix to generate entry signals, SVIX generates much fewer false positives during ranging markets, which drastically reduce Hesta 2015 strategy profitability as this incurs quite a lot of losses.
This indicator goes further than the original SVIX, by restoring the smoothed D and second-level smoothed D2 oscillators from the original Stochastic Oscillator, and use a 14-period ZLMA instead of the original 20-period SMA, to generate smoother yet responsive signals compared to using just the raw SVIX (by default, this is disabled, as the original raw SVIX is used to produce more entry signals).
Usage:
Set the timescale to daily or weekly preferably, to reduce false positives.
When the background is highlighted in green or when the highlight disappears, it is usually a good time to enter a long position.
Red background highlighting can be enabled to signal good exit zones, but these generate a lot of false positives.
To further reduce false positives, the SVIX_MA can be used to generate signals instead of the raw SVIX.
For more information on Williams' Vix Fix, which is a strategy published under public domain:
The VIX Fix, Larry Williams, Active Trader magazine, December 2007, web.archive.org
Fixing the VIX: An Indicator to Beat Fear, Amber Hestla-Barnhart, Journal of Technical Analysis, March 13, 2015, ssrn.com
For more information on the Stochastic Vix Fix (SVIX), published under Creative Commons:
Replicating the CBOE VIX using a synthetic volatility index trading algorithm, Dayne Cary and Gary van Vuuren, Cogent Economics & Finance, Volume 7, 2019, Issue 1, doi.org
Note: strangely, in the paper, the authors failed to mention that the SVIX is the complement of the original Stochastic Oscillator, instead reproducing just the original equation. The correct equation for the SVIX was retroengineered by comparing charts they published in the paper with charts generated by this pinescript indicator.
For a more complete indicator, see:

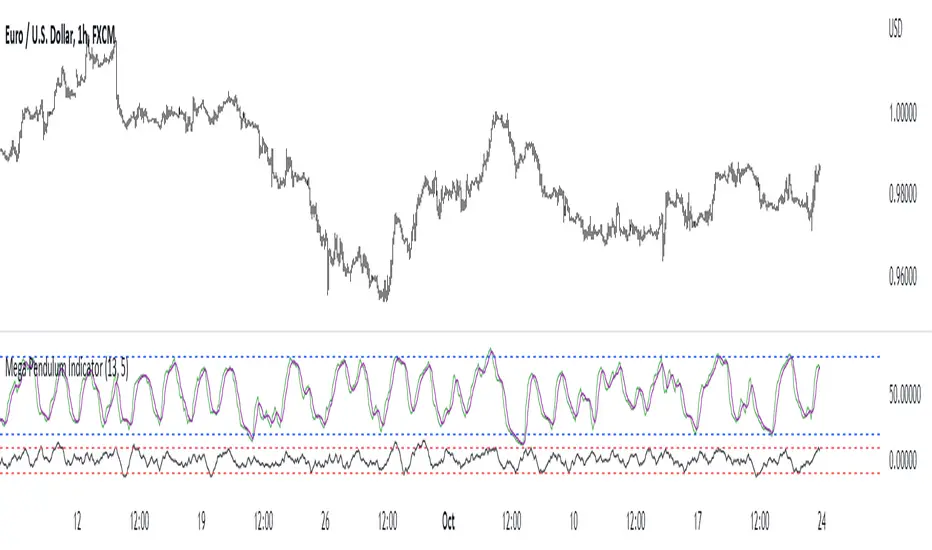
Mega Pendulum IndicatorThe MPI (Mega Pendulum Indicator) is a fusion between the Pendulum Indicator and the Swing Indicator and is used with specific trading rules.
The MPI is a semi-bounded oscillator comprised of two lines. The first bounded line is the Pendulum Indicator which oscillates between 0 and 100 but generally oscillates between 20 and 80. The second semi-bounded line is the Swing Indicator which generally oscillates between -10 and 10.
The conditions for trading the Mega Pendulum Indicator are as follows:
* Buy: Whenever the Pendulum indicator crosses over its signal line (a 5-period moving average) and at the same time, the Swing Indicator must cross over -10 after having been below it.
* Sell: Whenever the Pendulum indicator crosses below its signal line (a 5-period moving average) and at the same time, the Swing Indicator must cross under -10 after having been above it.
Linear Average PriceWhat is "Linear Average Price"?
"Linear Average Price" is both a trend and an overbought oversold indicator .
What it does?
it creates a trendline and trading zones.
How it does it?
To create the trend line, it averages the difference between each data and chooses it as the slope of the line it creates. then it positions this line so that it passes right through the middle of the data at hand. It uses standard deviation to create trading zones.
How to use it?
It can be used both to have an idea about the trend direction and to determine buy-sell zones. You can choose how many candles the indicator will calculate from the "lenght" section. The "range" part is the coefficient of the standard deviation and can be used to expand or collapse zones.

CFH | RSI-SRSI tableShows RSI and SRSI values on multiple timeframes, highlights oversold and overbought
Timeframes and colors are customizable
/V1llager/

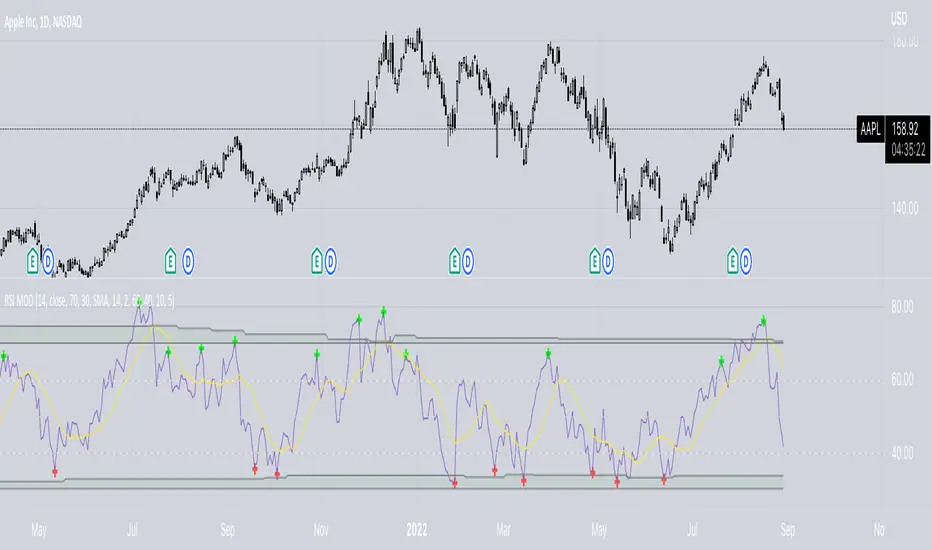
RSI ModifiedThe RSI is an excellent indicator for determining when equities are overbought/oversold. Though I believe there is a shortcoming in using the 70/30 levels since they are static and do not adjust for when an equity is trending. It stands to reason that in a downtrend, the overbought might be less than 70 and the oversold less than 30—Vice versa for a bull trend. Using the built-in function of pivots, I have attempted to create overbought/oversold lines that adjust with the trend. Leaving the 70/30 lines on the indicator also helps visualize the equity trend. All pivot settings are adjustable in the input menu. The pivot limits serve as a filter for recording pivot points. For example, with an upper pivot limit of 60, only pivots greater than 60 will be recorded into the array used to determine overbought. The crosses represent which values are used to determine overbought/oversold and do not provide timely indications.
MACD ModifiedIn an attempt to improve the MACD for trading, I have added an alternative way to calculate the MACD Line and Overbought/Oversold (OB/OS) lines to filter signals.
The alternate calculation I named "Modified" and put the option to select it under "MACD Calculation" in the input menu. Traditionally the MACD is calculated as fastEMA - slowEMA, for "Modified" I changed the calculation to ((fastEMA - slowEMA) / slowEMA * 100). The goal of this change is to view the difference in MA as a percent of the slow. The hope is that this will compensate for securities that have had major gains or losses in their history.
For the OB/OS lines, I coded in three different ways to calculate them. Users can select which method they prefer in the input menu. The first is through pivot points. The script records the pivot points into an array and takes the average of the array. There are two arrays, one for the OB line and one for the OS line. I also added filters so it will only record pivots above/below a specific value. The crosses on the indicator are for debugging purposes only. They mark the pivots that were recorded into the arrays. The crosses are offset by the pivot strength and do not provide timely indications. All inputs are adjustable for the pivots in the "Pivots" section of the input menu. The second method for the OB/OS lines I added is Bollinger Bands. The user can choose to put it around the Signal or MACD line. The final method added is simply using the previous high/low pivot of the MACD line.

ALMA/EMA/SRSI Strategy + IndicatorBack with another great high hit rate strategy!!
Disclaimer* This strategy was sampled using source code written by @ClassicScott , as referred to in the script, there is a clear line where the source code was scripted by myself.
This Strategy consists of three key factors, the ALMA, EMA crossover, and a Stochastic Rsi
ALMA: The Alma is the step line shown, turning green and red at select times. This average value gives general oversight of the macro movement of price action. and this particular one was coded by Mr.ClassicScott.
EMA crossover: At the input screen you are given an option of the fast and slow ema's. The default is solely for the hit rate and correlation to the Alma of this strategy. The arrows you see depicted on the chart are the crossover events happening.
Stochastic Rsi: The Stochastic Rsi is a stochastic value, using data sampled from the rsi. The use of this indicator in my strategy is to prevent entries when too overbought and oversold, as well as closures and vice versa, to prevent holding bags either way.
Fixed % TP: In the input screen you are given a take profit and stop loss percentage, for good R/R the hit rate will take a notch down, but with no R/R it will be near perfect.
How to use this:
Add it to your chart to get the strategy inputs. (The strategy is really only useful on a 15min TF. However the indicator within it can be used on anything at anytime!)
Watch the yellow and aqua moving averages, these are your ema's and crossover's will trigger signals based on your integer inputs.
Find Correlation between other leading indicators, as well as crossover's down/up and a red/green alma.
DO NOT use the arrows as buy/sell signals. These are simply to show ema's are crossing under or over. Momentum indicator's paired with this can be useful to determine if it could be a buy signal or sell signal.
Cheat Code's Notes:
Almost at 1000 boosts!!! I appreciate the support from everyone and I will keep trying my best to deliver quality strategies for the people.
-Cheat Code
BYBIT:BTCUSDT

Triple RSI strategyThis strategy is commonly used both in forex and stock markets for reversal trading. when the rsi line reaches and crosses simultaneously at 3 rsi setups i.e at 7, 14, and 21, a signal is generated.
This strategy works best in 1-hour timeframe. It provides over 60 to 80 percent accuracy in 1-hour timeframe.
In the stock market, this strategy provides an excellent entry point, if one is seeking small profits.
One can expect to make around 10 to 50 pips in the forex market easily. However, I advise seeking support from price action from the lower timeframe in the forex market.
I hope you like it.
Follow for more strategies and scripts like this.

Rsi/W%R/Stoch/Mfi: HTF overlay mini-plotsOverlay mini-plots for various indicators. Shows current timeframe; and option to plot 2x higher timeframes (i.e. 15min and 60min on the 5min chart above).
The idea is to de-clutter chart when you just want real-time snippets for an indicator.
Useful for gauging overbought/oversold, across timeframes, at a glance.
~~Indicators~~
~RSI: Relative strength index
~W%R: Williams percent range
~Stochastic
~MFI: Money flow index
~~Inputs~~
~indicator length (NB default is set to 12, NOT the standard 14)
~choose 2x HTFs, show/hide HTF plots
~choose number of bars to show (current timeframe only; HTF plots show only 6 bars)
~horizontal position: offset (bars); shift plots right or left. Can be negative
~vertical position: top/middle/bottom
~other formatting options (color, line thickness, show/hide labels, 70/30 lines, 80/20 lines)
~~tips~~
~should be relatively easy to add further indicators, so long as they are 0-100 based; by editing lines 9 and 11
~change the vertical compression of the plots by playing around with the numbers (+100, -400, etc) in lines 24 and 25

SMAs DistancesThis indicator shows 5 configurable SMAs. It also shows a table with the distance of each one with respect to the last closing price. It also shows if the RSI is in the overbought or oversold zone. You can add alerts if you wish.
SMAs by Default 8, 20, 50, 100 and 200

Williams % Range overlay mini plotPlots Williams Percent Range over bought/oversold indicator as a small overlay in top right corner.
De-clutter chart when all you're interested in is the real-time W%R to 'give permission' to enter a trade.
i.e. to remove the Williams %R lower pane from the above chart completely.
~~User Inputs~~
~W%R length
~Number of bars to show (default is last 6 bars)
~Plot offset (horizontal position of the plot; can be negative)
~Line color and thickness
~Show/hide plot title
~~tips~~
~in line 26, edit the multiplier (3*), to compress/expand the vertical size of the plot

Extreme Bars"Extreme Bars" is a simple but useful indicator that marks overbought and oversold candles. This indicator paints candles that fall far above the average red, and the candles that rise above the average green. Of course, they can change these colors if they want. "Extreme Bars" can be interpreted in many different ways. The starting points of colored candles can often be good support or resistance. In addition, it would be wise to close the positions opposite the colored candles and to maintain the positions compatible with the colored candles. It is also possible that the gaps formed by the colored candles will be closed in the future. The sensitivity of the indicator can be changed in the settings section.

Dragon Double RSI Overbought-Oversold With LabelThis indicator consist of tow RSI length that user can customize it. like length, overbought, oversold. like length, overbought, oversold. also it has one moving average where the user can select from different types of moving averages, price sources, lookback periods and resolutions

EMCHO Stochastic RangeCustom Stochastic Oscillator with range plot. Can be used to better identify overbought/oversold conditions within a single bar. In addition to the default Stochastic:
%K line smoothing algorithm selection;
%D line smoothing algorithm selection;
%K line high/low plotting;
%K line high/low calculation factor (in bars, default 1).
