Mean Reversion Channel - (fareid's MRI Variant)Description :
Mean Reversion Channel objective, based on Mean Reversion theory ( everything has a tendency to revert back to its mean), is to help visualizing:
Inner Channel -> Dynamic Support and Resistance
Outer Channel -> Overbought/Oversold Zone which may signal consolidation phase or potential reversal due to unsustainable move
Details on some of the filtering type used for mean calculation can be read in Ehlers Technical Papers: "Swiss Army Knife Indicator" and/or his book "Cybernetics Analysis for Stock and Futures"
Disclaimer:
These study scripts was built only to test/visualize an idea to see its viability and if it can be used to optimize existing strategy.
Any ideas to further improve this indicator are welcome :)
Overbought

Triple RSIThis idea behind this indicator was to show an un cluttered view of the RSI on 3 different timeframes. The RSI for the current chart highlights Lime/Red when it crosses the Overbought and Oversold levels, which are editable in the Inputs tab. RSI 2 defaults to the 1h timeframe and prints a lime dot at the top of the indicator when it's above the 50 level and a Red Dot at the bottom of the indicator when it's below the 50 level. It can also be viewed as a plot line that changes color when it's above or below the 50 level. RSI 3 defaults to the 4h timeframe and prints a blue square at the top of the indicator when it's above the 50 level and an orange square at the bottom of the indicator when it's below the 50 level. It also can be viewed as a plot line that changes color when it's above or below the 50 level.
I've added the indicator multiple times to show a few of the different viewing options, with the default settings at the very bottom.

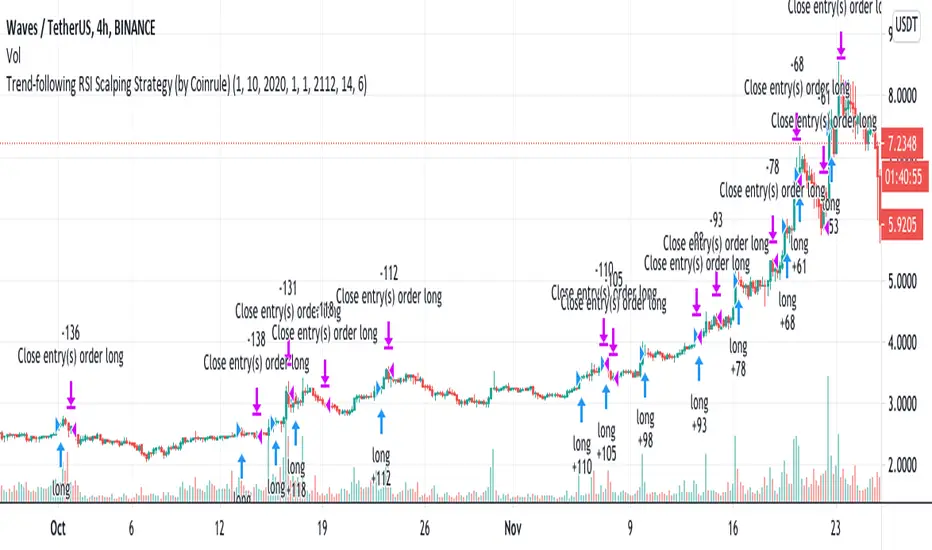
Trend-following RSI Strategy According to classical technical analysis, an RSI above 70 should signal overbought conditions and, thus, a sell-signal. Cryptocurrencies represent a whole new asset class, and they reshape the classical concepts of technical analysis. FOMO-buying can be very powerful, and coins can remain in overbought conditions enough to provide excellent opportunities for scalping trades on the upside.
Building a trend-following trading strategy based on the RSI, which is generally considered a contrarian indicator, may sound counter-intuitive. Over 200 backtests prove that this is a very interesting long-term setup.
The setup is optimized on a 4-hours time frame and trading cryptocurrencies versus USD or stable coins.
The strategy tries to catch coins on sustained uptrends to take advantage of further upside.
The strategy's buy-signal triggers when a coin has an RSI above 70 on a 4-hours time frame.
The strategy sells the coin if a profit of 6% is achieved. Alternatively, it closes the position if the RSI drops below 55, indicating a possible weakening of the trend.
The strategy assumes each order to trade 30% of the available capital. A trading fee of 0.1% is taken into account. The fee is aligned to the base fee applied on Binance, which is the largest cryptocurrency exchange.
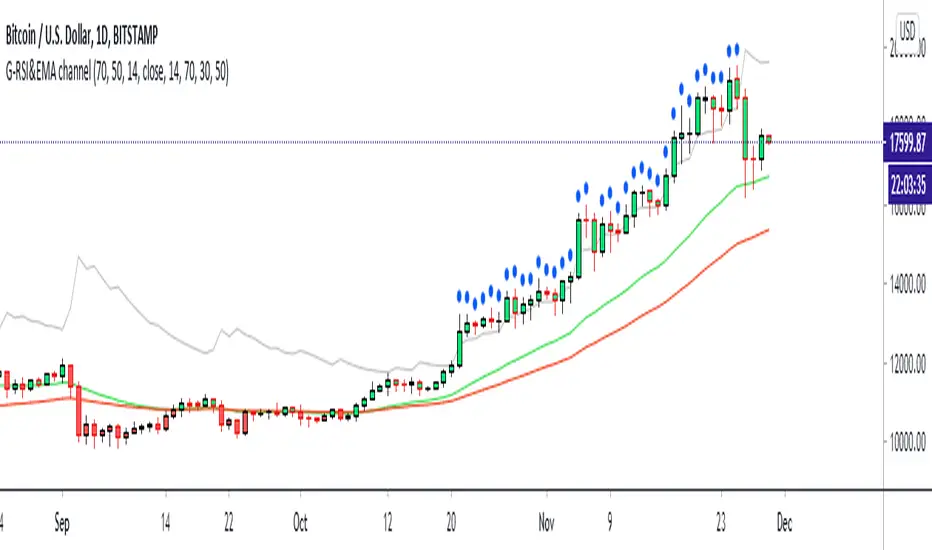
G-RSI&EMA channel v.1This my 2nd indicator : It's just a Strenghtening of trend channal
If price can come up on the green line it's mean price is side way or maybe bullish
and if price can come up on RSI (14)50 and EMA50 it have problaby to bullish trend
If the price have blue ball it's mean crazy strong bullish trend
If the price have red ball it's mean crazy strong bearish trend
you can use my 1st script together : 1st is " G-Bollingerbands Volatility breakout "
My 1st script detect the price begin to have volatility
My 2nd scrit detect the trend
Goodluck :D
PS: My 2nd script develop from someone in tradingview RSI script i'm sorry I can't remember but thank you very much.
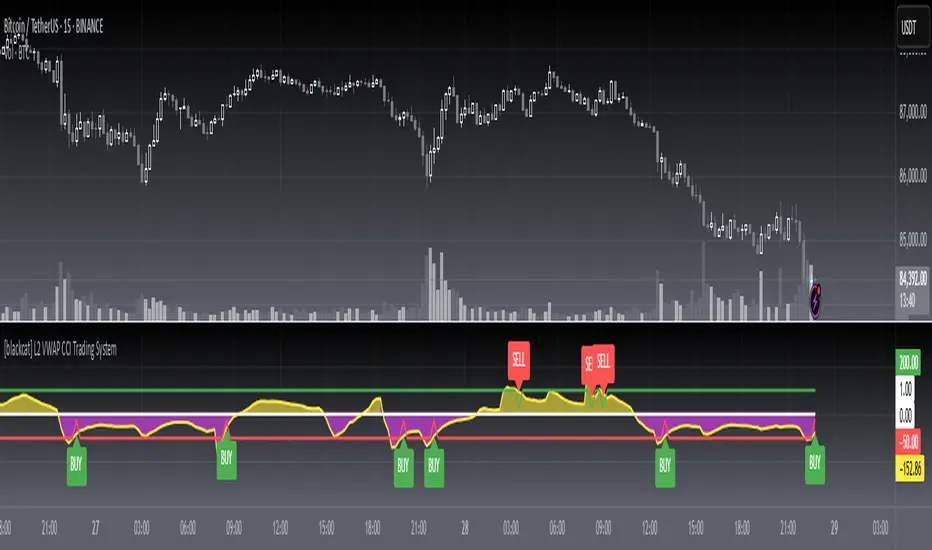
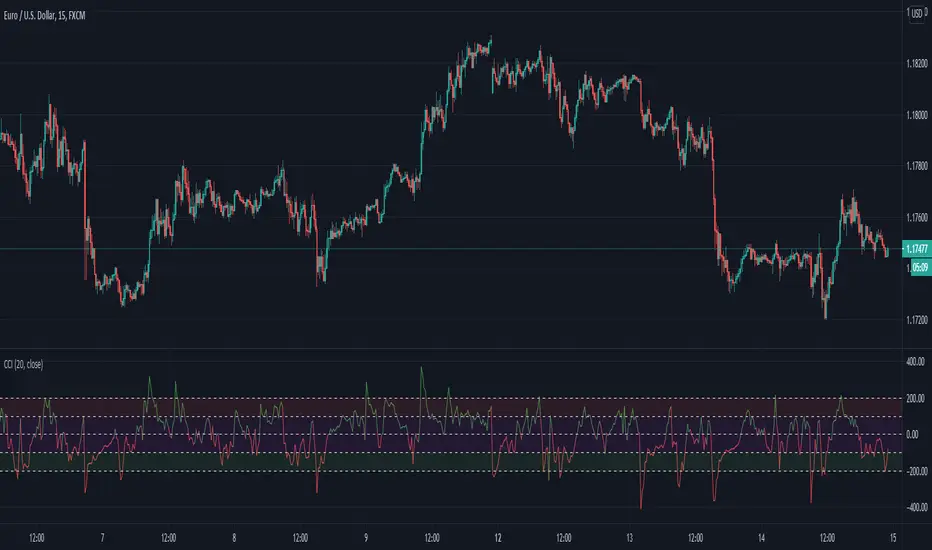
[blackcat] L2 VWAP CCI Trading SystemLevel: 2
Background
Volume-Weighted Average Price (VWAP) is a trading benchmark used by traders that indicates the average price that a security has traded for throughout the day based on volume and price. This is important as it gives traders insight into the trend and value of a security.
The Commodity Channel Index (CCI) indicator was created to identify bullish and bearish market cycles, as well as to define market turning points and the strongest and weakest market periods. CCI was developed for commodities and quickly found application in other markets, including forex.
Function
blackcat L2 VWAP CCI Trading System is an innovative indicator that combines vwap and cci indicator together. Not only long and short entries can be disclosed, but also the overbought and oversold zones are clearly observed.
Key Signal
cci ---> vwap cci indicator output
long --> long entry condition
short --> short entry condition
backtest --> indicator backtest scheme "NLX-L3 Backtest" required input source for strategy backtest
longentry --> visual long entry
shortentry --> visual short entry
Pros and Cons
Pros:
1. exact long and short entries are produced by overbought and oversold conditions
2. support "NLX-L3 Backtest" framework
Cons:
1. noise may be produced under extreme market condition
2. due to this is un-optimized version, time frame and trading pairs need to be selected
Remarks
Courtesy of @nilux "NLX-L3 Backtest" easy backtest framework for dummies.
Step by step backtest guide with "NLX-L3 Backtest" framework:
STEP1: Add this indicator into your chart
STEP2: Add "NLX-L3 Backtest" into your chart
STEP3: Click "Settings" gear icon of "NLX-L3 Backtest" to select "Select L2 Indicator" in the 1st line as "blackcat L2 VWAP CCI Trading System: backtest"
STEP4: Configure your backtest other settings under "NLX-L3 Backtest" framework
STEP5: Click "OK" and view the results in "Strategy Tester" tab
Readme
In real life, I am a prolific inventor. I have successfully applied for more than 60 international and regional patents in the past 12 years. But in the past two years or so, I have tried to transfer my creativity to the development of trading strategies. Tradingview is the ideal platform for me. I am selecting and contributing some of the hundreds of scripts to publish in Tradingview community. Welcome everyone to interact with me to discuss these interesting pine scripts.
The scripts posted are categorized into 5 levels according to my efforts or manhours put into these works.
Level 1 : interesting script snippets or distinctive improvement from classic indicators or strategy. Level 1 scripts can usually appear in more complex indicators as a function module or element.
Level 2 : composite indicator/strategy. By selecting or combining several independent or dependent functions or sub indicators in proper way, the composite script exhibits a resonance phenomenon which can filter out noise or fake trading signal to enhance trading confidence level.
Level 3 : comprehensive indicator/strategy. They are simple trading systems based on my strategies. They are commonly containing several or all of entry signal, close signal, stop loss, take profit, re-entry, risk management, and position sizing techniques. Even some interesting fundamental and mass psychological aspects are incorporated.
Level 4 : script snippets or functions that do not disclose source code. Interesting element that can reveal market laws and work as raw material for indicators and strategies. If you find Level 1~2 scripts are helpful, Level 4 is a private version that took me far more efforts to develop.
Level 5 : indicator/strategy that do not disclose source code. private version of Level 3 script with my accumulated script processing skills or a large number of custom functions. I had a private function library built in past two years. Level 5 scripts use many of them to achieve private trading strategy.
Improved Commodity Channel IndexI took the normal CCI version and I made it better and more pleasantly visual.
At the same time now the CCI changes color based on the direction is going to take
We also have more levels, to define even better the current situation.
Details are simple :
green color cci = uptrend - > buy
red color cci = downtrend - > sell
Ehlers Adaptive Commodity Channel Index V1 [CC]The Adaptive Commodity Channel Index V1 was created by John Ehlers (Rocket Science For Traders pgs 236-237) and this is the typical Commodity Channel formula with the introduction of adaptive lengths based on his earlier work with indicators such as the Mother of Adaptive Moving Averages. For longer term signals you would get a bullish signal when CCI is above 0 and a bearish signal when CCI falls below 0. For shorter term signals you would get a bullish signal when crosses over it's overbought level or when it crosses above it's oversold level or vice versa. I have included both signals to make it easier.
Let me know if you want a custom script written or if you have a special request for me

dirt cheap yet elegant RSI StrategyFor Educational Purposes. Results can differ on different markets and can fail at any time. Profit is not guaranteed.
This only works in a few markets and in certain situations. Changing the settings can give better or worse results for other markets. This is a good way to show off a good looking strategy, atleast in paper, with minimal effort involved in the making and usage. It can be made with the most minimal lines of code if needed to bring shame unto others. It only works in a few markets and who knows if it will actually rebound from the overbought or oversold levels but in case it doesn't I put in a time-based stop to exit in case of that worst case scenario. There's not much to it, good for trolling others, or serious business, you decide.
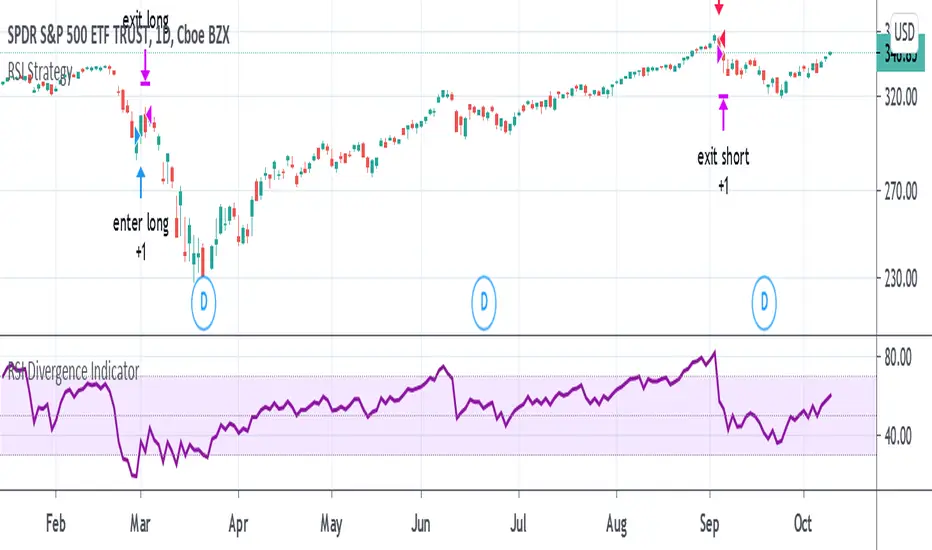
RSI TrendsRSI is a momentum indicator, however most people seem to be using it to go against the momentum by trying to identify tops/bottoms using it. Its in my opinion the wrong way to be using it. It can be easily used for trend following which seems like a better use for it.
Uptrend - RSI > 60
Downtrend - RSI < 40
Sideways - RSI between 40 and 60
If however not interested in filtering for sideways trends and convert it to a long-short only strategy that stays in market all the time then it can be simply modified by setting both overbought/oversold thresholds to 50. In such a case uptrend will be above 50 and downtrend will be less than 50.
Note: wait for close for current bar to be confirmed as RSI is calculated at close

RSI with Self-Adjusting Linear Regression Bands (Expo)RSI with Self-Adjusting Linear Regression Bands (Expo) makes use of RSI and Linear Regression to create an RSI that follows the current trend. The indicator has an upper and lower self-adjusting Linear Regression Band that act as RSI boundaries.
HOW TO USE
The indicator can be used in multiple ways, for instance, to find overbought and oversold areas. Or to identify trends as well as pullbacks in trends.
INDICATOR IN ACTION
This indicator is a modification of RafaelZioni's work "Linear Regression Trend bands"
Credit to: RafaelZioni
I hope you find this indicator useful , and please comment or contact me if you like the script or have any questions/suggestions for future improvements. Thanks!
I will continually work on this indicator, so please share your experience and feedback as it will enable me to make even better improvements. Thanks to everyone that has already contacted me regarding my scripts. Your feedback is valuable for future developments!
-----------------
Disclaimer
Copyright by Zeiierman.
The information contained in my scripts/indicators/ideas does not constitute financial advice or a solicitation to buy or sell any securities of any type. I will not accept liability for any loss or damage, including without limitation any loss of profit, which may arise directly or indirectly from the use of or reliance on such information.
All investments involve risk, and the past performance of a security, industry, sector, market, financial product, trading strategy, or individual’s trading does not guarantee future results or returns. Investors are fully responsible for any investment decisions they make. Such decisions should be based solely on an evaluation of their financial circumstances, investment objectives, risk tolerance, and liquidity needs.
My scripts/indicators/ideas are only for educational purposes!

MTF Stoch RSI ScreenerDisplays when multiple timeframes of Stochastic RSI are overbought/oversold. Multiple consecutive timeframes being overbought/oversold can signify a short term top or bottom.
Thanks to Micse in Pinescripters telegram who helped remove a few errors from this.

Percentage Price Over SMAReturn the percentage of closing prices greater than SMA's with periods within a user-selected range. An exponential moving average applied to these results is also displayed (in orange).
Settings
Min : Minimum period of the SMA in the range
Max : Maximum period of the SMA in the range
Smooth : Period of the EMA
Src : Input series of the indicator
Usage
The indicator is a normalized oscillator. A value of 100 indicates that 100% of the current closing price is over SMA's with periods ranging from min to max , this indicates a bullish market, while a value of 0 would indicate a bearish market.
In this image the indicator use min = 50 and max = 200, here AMD has been strongly bullish at the start, and ended being strongly bearish at the end, during this bullish period the indicator is over its overbought level, while it is under its oversold level during the bearish period.
In case the market is ranging we can expect the indicator to be around 50%, using the smoothed result might be more useful to detect ranging markets with this indicator.
If the smoothed result is within the overbought/oversold levels, then we can say that the market is either ranging or transitioning from a bullish/bearish market to an opposite one.

Hybrid Overbought/Oversold Detector + Put/Call SignalsThere are many indicators of overbought/oversold conditions out there. Some of more common ones are:
- Bollinger Bands %B
- Money Flow Index (MFI)
- Relative Strength Index (RSI)
- Stochastic
This script uses a combination of these 4 oscillators to confirm overbought/oversold and filter the signals of market reverse which could be used for trading binary options.
You may select which oscillators you want to apply and of course change the source, the length of the calculations and the overbought/oversold levels.
Also the script will draw a combined graph which is the average of the selected oscillators in the options.
Send me your ideas!

Price Distance to its MA by DGTPrices high above the moving average (MA) or low below it are likely to be remedied in the future by a reverse price movement as stated in an Article by Denis Alajbeg, Zoran Bubas and Dina Vasic published in International Journal of Economics, Commerce and Management
Here comes a study to indicate the idea of this article, Price Distance to its Moving Averages (P/MA Ratio)
The analysis expressed in the paper indicates that there is a connection between the distance of the prices to moving averages and subsequent returns : portfolios of stocks with lower prices to moving averages generally outperformed portfolios of stocks with higher prices to moving averages. This “overextended” effect is more pronounced when using shorter moving averages of 20 and 50 days, and is especially strong in short-term holding periods like one and two weeks. The highest annual returns are recorded when buying in the range of 0-5% below shorter moving averages of 20/50 days, and 0-10% below longer moving averages of 100/200 days. However, buying very far below almost all moving averages on almost all holding periods produces the lowest returns.
The concept of this study recognizes three different modes of action.
In a clearly established upward trend traders should be buying when prices are near or below the MA line and selling when prices move too far above the MA.
Conversely, in downward trend stocks should be shorted when reaching or going above the moving average and covered when they drop too far below the MA line.
In a sideways movement traders are advised to buy if the price is too low below the moving average and sell when it goes too far above it
Short-term traders can expect to outperform in a one or two week time window if buying stocks with lower prices compared to their 20 and 50 SMA/EMA, one to two-week holding periods is quite high, ranging from 72,09% to 90,61% for the SMA(20, 50) and 85,03% to 87,5% for the EMA(20, 50). The best results for the SMA 20 and 50, on average, are concentrated in the region of 0-5% below the MA for the majority of holding periods. Buying very far below almost all MA in almost all holding periods turns out to be the worst possible option
Candle patterns, momentum could be used in conjunction with this indicator for better results. Try Colored DMI and Ichimoku colored SuperTrend by DGT

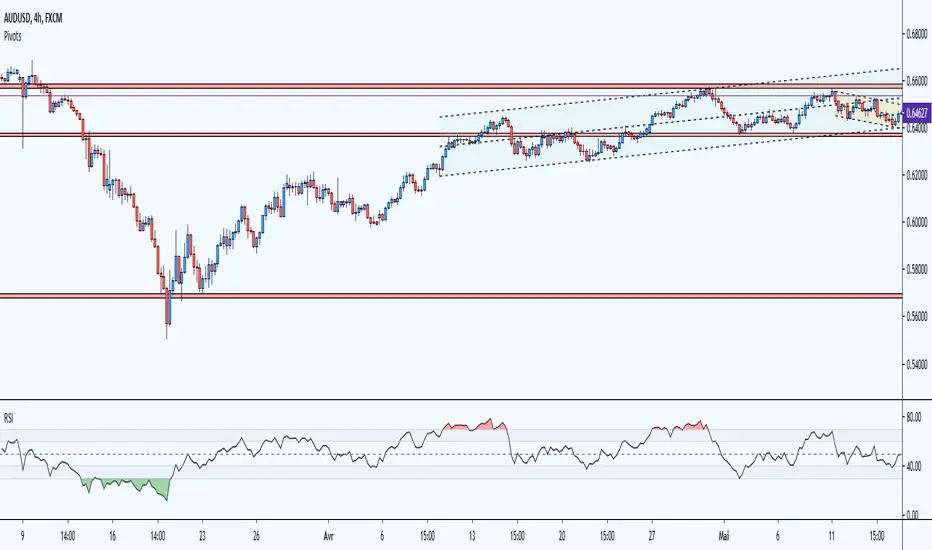
RSI Multicolor editableEN:
RSI with overbought and oversold area in color and editable level. visually more interesting than the basic version the overbought and oversold areas catch the eye quickly. Depending on the strategies and your personal use of the RSI, you can modify all the lines and add colors to each defined zone.
overbought zone, oversold and editable noise zone
I wanted to have a modifiable RSI like some trading platforms.
please excuse me for my english and my code, i'm just getting started.
FR:
RSI avec zone de surachat et survente en couleur et niveau éditable. visuellement plus intéressant que la version basique les zones de surachat et survente attirent l’œil rapidement. Selon les stratégies et l'utilisation personnel que vous faite du RSI, vous pouvez modifier toutes les lignes et ajouter des couleurs à chaque zone défini.
zone de surachat, survente et zone de bruit éditable
je souhaitais avoir un RSI modifiable comme certaines plateforme de trading.
veuillez m'excuser pour mon anglais et mon code, je débute.
B3 Stochastic Full w/BarColorNow with Bar Color!
The simplest upgrade to the classic indicator, old script:
B3 Stochastic Full
Also, if you like this one you may appreciate my personally modified take on the stochastic readings:
B3 Extended Stochastics

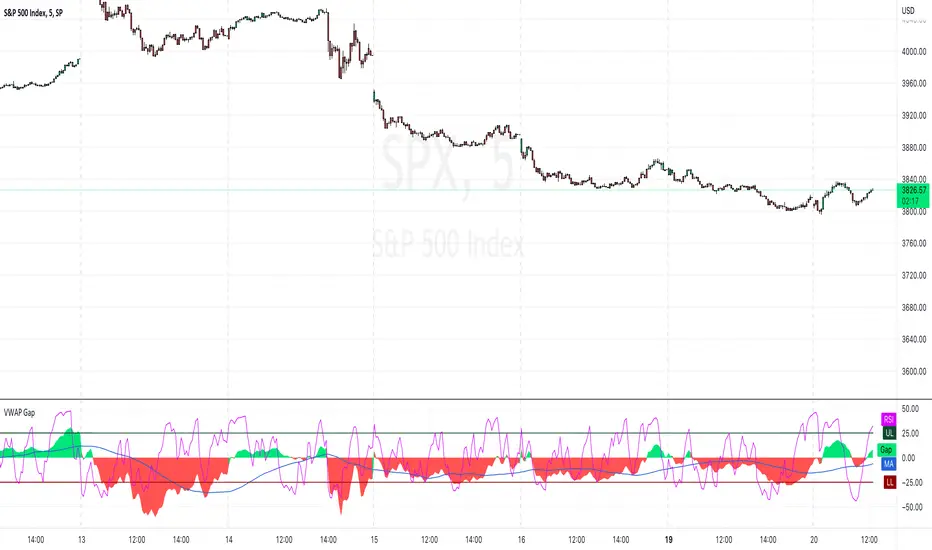
VWAP Gap [AR]This simple indicator measure the difference between price and VWAP line
The VWAP Gap indicator works best on intraday charts
SET-UP INFO
1. Add VWAP to your chart and set it up
2. Open "VWAP Gap Indicator" settings
3. Change source to "VWAP"
Enjoy!
Alex R.
RSI Call-outs [BigBitsIO]This is a simple RSI indicator that overlays the current chart to show labels for specified oversold and overbought areas defined with inputs.
It will delete any labels of the same kind within the last 3 candles so you don't see as many labels as you would otherwise.
Red labels with white text represent overbought RSI levels as defined by the user.
Green labels with black test represent oversold RSI levels as defined by the user.
This RSI overlay help easily call-out overbought and oversold candles on a chart without sacrificing screen space for a traditional RSI indicator that is not overlayed on the chart.

RSI ChannelHello All. For a while this idea (showing RSI levels on the chart as a channel) was in my mind and finally today I developed the script. I hope it will be usefull for all.
Enjoy!

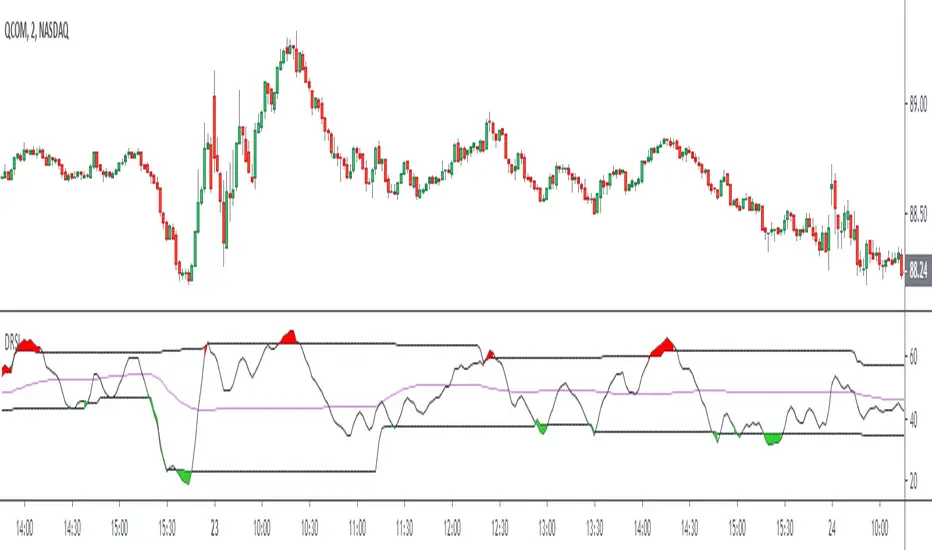
Dynamic RSIThe Dynamic RSI indicator is a kind of exponential RSI. The overbought and oversold levels (respectively HiLine and LoLine) are calculated according to the recent highest and lowest values of the Dynamic RSI line.
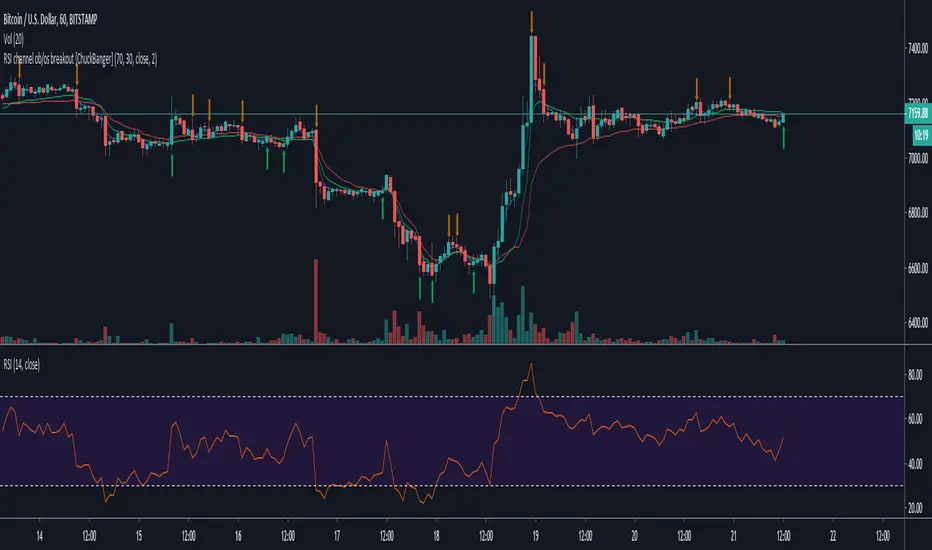
RSI channel ob/os breakout [ChuckBanger]This is a breakout signal script based on reverse engineering of RSI. It shows a channel of overbought and oversold readings that the trader can sett in settings. When low crosses under lower line it shows bullish signal and when high is crossing upper line it shows a bearish signal. The script also has wilder's moving average as filter instead of high/low.
Good luck traders!
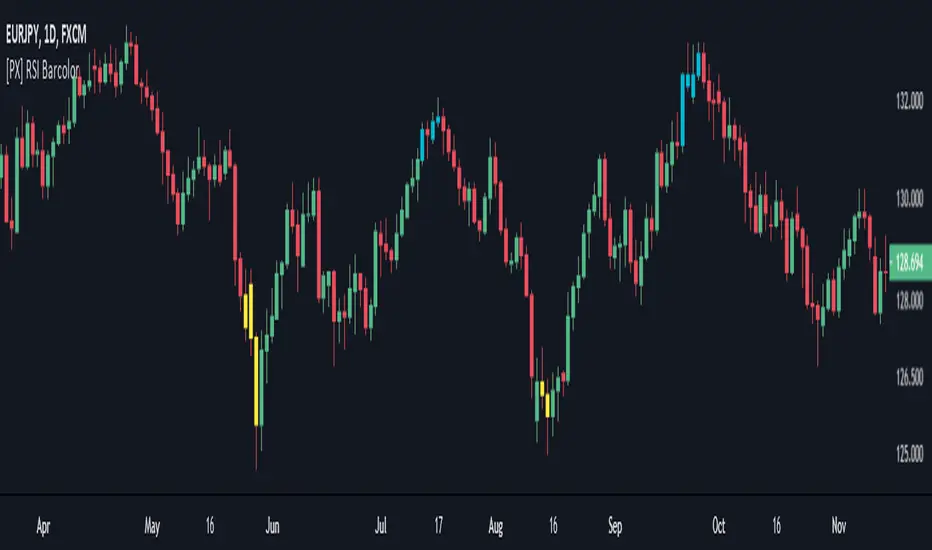
[PX] RSI BarcolorThis script simply colors the candles based on the defined "overbought" and "oversold" RSI-levels set in the input section of the indicator.
If the price is below the oversold level, the candle is colored in yellow.
If the price is above the overbought level, the candle is colored in aqua.
If the price moves back between both levels, no color will be applied.
Might be useful for some of you ;)
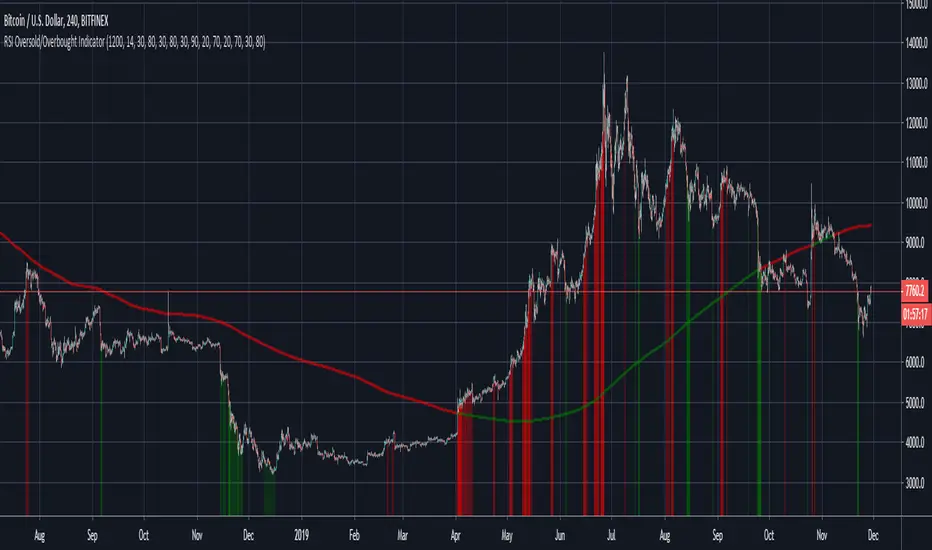
RSI Oversold/Overbought IndicatorThis is a very simple but quite powerful indicator which looks at the RSI simultaneously over the 4h, Daily and Weekly timeframes, and places bands on the chart when one or more timeframes move into oversold/overbought territory. For further filtering I use the 200 day SMA to determine if we are in a Bull or Bear market, which puts a bias on the RSI (30/80 in a Bull market and 20/70 in a Bear market).
The deeper the colour, the more oversold the market is. The weekly RSI can be used as an early warning sign, with the Daily/ 4h RSI useful to identify local peaks.