UK100 London Judas & IFVG SetupUK100 London Judas & IFVG Setup
Overview This indicator is a specialized trading tool designed to automate the ICT Judas Swing strategy specifically for the UK100 (FTSE 100) index during the London Market Open. It combines institutional time-based logic with price action confirmation using Inversion Fair Value Gaps (IFVG) to identify high-probability reversal setups.
How It Works The strategy is based on the concept that the initial move after the London Open is often a "fake-out" (manipulation) designed to trap retail traders and engineer liquidity before the true trend of the day begins.
Session & Opening Price:
The script marks the London Open price (default 09:00 Warsaw / 08:00 London time) with a dashed line.
This serves as the "line in the sand." Prices moving away from this line initially are monitored for manipulation.
Judas Swing (Liquidity Sweep):
If price moves BELOW the open, it is hunting Sell-Side Liquidity (trapping sellers).
If price moves ABOVE the open, it is hunting Buy-Side Liquidity (trapping buyers).
The Entry Trigger: Inversion FVG (IFVG):
The indicator scans for Fair Value Gaps (FVG) created during the manipulation phase.
BUY Signal: The price manipulates lower, creates a Bearish FVG (Red Box), but then aggressively reverses and closes ABOVE that gap. The gap is now "Inverted" (turns Green), acting as support.
SELL Signal: The price manipulates higher, creates a Bullish FVG (Green Box), but then aggressively reverses and closes BELOW that gap. The gap is now "Inverted" (turns Orange), acting as resistance.
Key Features
Automated Pattern Recognition: No need to manually draw gaps. The script detects valid FVG inversions that align with the Judas Swing logic.
Built-in Risk Calculator: The signal labels display the exact Lot Size you should use based on your account balance and risk percentage (default 0.5%). It calculates this dynamically based on the Stop Loss distance.
Institutional Targets: The indicator fetches H1 Fractals (Liquidity) from the 1-hour timeframe and plots them on your 1-minute chart as blue lines. These are your primary Take Profit (TP) levels.
Stop Loss Visualization: Automatically suggests a Stop Loss placement behind the swing high/low of the reversal structure.
How to Use
Timeframe: Set your chart to 1 Minute (1m).
Asset: UK100 (FTSE 100).
Wait: Allow the London session to open. Watch for price to move away from the opening line.
Execute: When a BUY or SELL label appears:
Enter the trade using the Lot Size shown on the label.
Set your Stop Loss at the price shown on the label.
Target the blue H1 Liquidity lines for profit taking.
Settings
Timezone: Set this to your chart/exchange timezone (Default: Europe/Warsaw).
Account Balance: Input your current trading capital (e.g., 100,000) for accurate risk calculations.
Risk Per Trade %: The percentage of your account you are willing to lose if the Stop Loss is hit (Standard: 0.5% - 1.0%).
Contract Size: The value of 1 point movement (Check your broker's specifications. Usually 1 for CFDs).
Alerts You can set a single alert in TradingView to capture all signals. Select the indicator and choose "Any alert() function call". You will receive a notification with the direction (Buy/Sell), Entry Price, and Lot Size.
Индикаторы и стратегии

Early Momentum Dashboard [Small Caps]Early Momentum Dashboard for Small Caps
A clean, real-time dashboard that detects building momentum before major moves in small-cap stocks.
Features:
• 7 key early-momentum indicators with traffic-light system (🟢 Bullish / 🟡 Neutral / 🔴 Bearish)
• Toggle each indicator on/off via settings
• Momentum Score (e.g., 5/7) – higher = stronger early signal
• Visual markers on chart (VOL, RSI, MACD)
• Includes: Relative Volume Spike, RSI Buildup, MACD, OBV Accumulation, ROC, ATR Volatility, VWAP Proximity
Ideal for scanning low-float or catalyst-driven small caps.
Tip: Look for 4+ green lights as a high-probability early entry signal.
Enjoy!

Harmonic Patterns (Experimental) [Kodexius]Harmonic Patterns (Experimental) is a multi pattern harmonic geometry scanner that automatically detects, validates, and draws classic harmonic structures directly on your chart. The script continuously builds a pivot map (swing highs and swing lows), then evaluates the most recent pivot sequence against a library of harmonic ratio templates such as Gartley, Bat, Deep Bat, Butterfly, Crab, Deep Crab, Cypher, Shark, Alt Shark, 5-0, AB=CD, and 3 Drives.
Unlike simple “pattern exists / pattern doesn’t exist” indicators, this version scores candidates by accuracy . Each pattern includes “ideal” ratio targets, and the script computes a total error score by measuring how far the observed ratios deviate from the ideal. When multiple patterns could match the same pivot structure, the script selects the best match (lowest total error) and displays that one. This reduces clutter and makes the output more practical in real market conditions where many ratio ranges overlap.
The end result is a clean, information rich visualization of harmonic opportunities that is:
-Pivot based and swing aware
-Ratio validated with configurable tolerance
-Direction filtered (bullish, bearish, or both)
-Ranked by accuracy to prefer higher quality matches
Note: This is an experimental pattern engine intended for research, confluence and chart study. Harmonic patterns are probabilistic and can fail often. Always combine with your own risk management and confirmation tools.
🔹 Features
🔸Pivot Detection
The script uses pivot functions to detect structural turning points:
-Pivot Left Bars controls how many bars must exist on the left of the pivot
-Pivot Right Bars controls confirmation delay on the right (smaller value reacts faster)
Additionally, a Min Swing Distance (%) filter can ignore tiny swings to reduce noise. Pivots are stored separately for highs and lows and capped by Max Pivots to Store to keep the script efficient.
🔸Pattern Library (XABCD and Beyond)
Supported structures include:
-Gartley, Bat, Deep Bat, Butterfly, Crab, Deep Crab
-Cypher (uses XC extension and CD retracement logic)
-Shark and Alt Shark (0-X-A-B-C mapping)
-5-0 (AB and BC extensions with CD retracement)
-AB=CD (symmetry and proportionality checks)
-3 Drives (6 point structure, drive and retracement ratios)
Each pattern is defined by ratio ranges and also “ideal” ratio targets used for scoring.
🔸 Pattern Fibonacci Rules (Detailed Ratio Definitions)
This script validates each harmonic template by measuring a small set of Fibonacci relationships between the legs of the pattern. All measurements are computed using absolute price distance (so the ratios are direction independent), and then a directional sanity check ensures the geometry is positioned correctly for bullish or bearish cases.
How ratios are measured
Most patterns in this script use the standard X A B C D harmonic structure. Four ratios are evaluated:
1) XB retracement of XA
This measures how much price retraces from A back toward X when forming point B .
xbRatio = |B - A| / |A - X|
2) AC retracement of AB
This measures how much point C retraces the AB leg.
acRatio = |C - B| / |B - A|
3) BD extension of BC
This measures the “drive” from C into D relative to the BC leg.
bdRatio = |D - C| / |C - B|
4) XD retracement of XA
This is the most important “completion” ratio in many patterns. It measures where D lands relative to the original XA swing.
xdRatio = |D - A| / |A - X|
Important: the script applies a user defined Fibonacci Tolerance to each accepted range, meaning the pattern can still pass even if ratios are slightly off from the textbook values.
🔸 XABCD Pattern Ratio Templates
Below are the exact ratio rules used by the templates in this script.
Gartley
-XB must be ~0.618 of XA
-AC must be between 0.382 and 0.886 of AB
-BD must be between 1.272 and 1.618 extension of BC
-XD must be ~0.786 of XA
In practice, Gartley is a “non extension” structure, meaning D usually remains inside the X boundary .
Bat
-XB between 0.382 and 0.50 of XA
-AC between 0.382 and 0.886 of AB
-BD between 1.618 and 2.618 of BC
-XD ~0.886 of XA
Bat patterns typically complete deeper than Gartley and often create a sharper reaction at D.
Deep Bat
-XB ~0.886 of XA
-AC between 0.382 and 0.886 of AB
-BD between 1.618 and 2.618 of BC
-XD ~0.886 of XA
Deep Bat uses the same completion zone as Bat, but requires a much deeper B point.
Butterfly
-XB ~0.786 of XA
-AC between 0.382 and 0.886 of AB
-BD between 1.618 and 2.618 of BC
-XD between 1.272 and 1.618 of XA
Butterfly is an extension pattern . That means D is expected to break beyond X (in the completion direction).
Crab
-XB between 0.382 and 0.618 of XA
-AC between 0.382 and 0.886 of AB
-BD between 2.24 and 3.618 of BC
-XD ~1.618 of XA
Crab is also an extension pattern . It often produces a very deep D completion and a strong reaction zone.
Deep Crab
-XB ~0.886 of XA
-AC between 0.382 and 0.886 of AB
-BD between 2.0 and 3.618 of BC
-XD ~1.618 of XA
Deep Crab combines a deep B point with a strong XA extension completion.
🔸 Cypher Fibonacci Rules (XC Based)
Cypher is not validated with the same four ratios as XABCD patterns. Instead it uses an XC based completion model:
1) B as a retracement of XA
xb = |B - A| / |A - X| // AB/XA
Must be between 0.382 and 0.618 .
2) C as an extension from X relative to XA
xc = |C - X| / |A - X| // XC/XA
Must be between 1.272 and 1.414 .
3) D as a retracement of XC
xd = |D - C| / |C - X| // CD/XC
Must be ~ 0.786 .
This makes Cypher structurally different: the “completion” is defined as a retracement of the entire XC leg, not XA.
🔸 Shark and Alt Shark Fibonacci Rules (0-X-A-B-C Mapping)
Shark patterns are commonly defined as 0 X A B C . In this script the pivots are mapped like this:
0 = pX, X = pA, A = pB, B = pC, C = pD
So the final pivot (stored as pD) is labeled as C on the chart.
Three ratios are validated:
1) AB relative to XA
ab_xa = |B - A| / |A - X|
Must be between 1.13 and 1.618 .
2) BC relative to AB
bc_ab = |C - B| / |B - A|
Must be between 1.618 and 2.24 .
3) OC relative to OX
oc_ox = |C - 0| / |X - 0|
For Shark it must be between 0.886 and 1.13 .
For Alt Shark it must be between 1.13 and 1.618 (a deeper / more extended completion).
🔸 5-0 Fibonacci Rules
5-0 is validated as a sequence of extensions and then a fixed retracement:
1) AB extension of XA
ab_xa = |B - A| / |A - X|
Must be between 1.13 and 1.618 .
2) BC extension of AB
bc_ab = |C - B| / |B - A|
Must be between 1.618 and 2.24 .
3) CD retracement of BC
cd_bc = |D - C| / |C - B|
Must be approximately 0.50 .
Note that for 5-0 the script does not rely on an XA completion ratio like 0.786 or 1.618. The defining completion is the 0.5 retracement of BC.
🔸 AB=CD Fibonacci Rules
AB=CD is a symmetry pattern and is treated differently from the harmonic templates:
1) AB and CD length symmetry
The script checks if CD is approximately equal to AB within tolerance.
2) BC proportion
BC/AB is expected to fall in a common Fibonacci retracement zone:
-approximately 0.618 to 0.786 (with a looser tolerance in code)
3) CD/BC expansion
CD/BC is expected to be an expansion ratio:
-approximately 1.272 to 1.618 (also with a looser tolerance)
This allows the script to capture both classic equal leg AB=CD and common “expanded” variations.
🔸 3 Drives Fibonacci Rules (6 Point Structure)
3 Drives is a 6 point structure and is validated using retracement ratios and extension ratios:
Retracement rules
Retracement 1 must be between 0.618 and 0.786 of Drive 1
Retracement 2 must be between 0.618 and 0.786 of Drive 2
Extension rules
Drive 2 must be between 1.272 and 1.618 of Retracement 1
Drive 3 must be between 1.272 and 1.618 of Retracement 2
This pattern is meant to capture rhythm and proportional repetition rather than a single XA completion ratio.
🔸 Why the script can show “ratio labels” on legs
If you enable Show Fibonacci Values on Legs , the script prints the measured ratios near the midpoint of each leg (or diagonal, depending on pattern type). This makes it easy to visually confirm:
-Which ratios caused the pattern to pass
-How close the structure is to ideal harmonic values
-Why one template was preferred over another via the accuracy score
🔸 Fibonacci Tolerance Control
All ratio checks use a single tolerance input (percentage). This tolerance expands or contracts the acceptable ratio ranges, letting you decide whether you want:
-Tight, high precision matches (lower tolerance)
-Broader, more frequent matches (higher tolerance)
🔸 Direction Filter (Bullish Only / Bearish Only / Both)
You can restrict scanning to bullish patterns, bearish patterns, or allow both. This is useful if you are aligning with higher timeframe bias or only trading one side of the market.
🔸 Best Match Selection (Anti Clutter Logic)
When a new pivot confirms, the script evaluates all enabled patterns against the latest pivot sequence and keeps the one with the smallest total error score. This is especially helpful because many harmonic templates overlap in real time. Instead of drawing multiple conflicting labels, you get one “most accurate” candidate.
🔸 Clean Visual Rendering and Optional Details
The drawing system can display:
-Main structure lines (X-A-B-C-D or special mappings)
-Dashed diagonals for geometric context (XB, AC, BD, XD)
-Pattern fill to visually highlight the structure zone
-Point labels (X,A,B,C,D or 0..5 for 3 Drives, 0-X-A-B-C for Shark)
-Leg Fibonacci labels placed around midpoints for fast ratio reading
All colors (bullish and bearish line and fill) are configurable.
🔸 Pattern Spacing and Display Limits
To keep charts readable, the script includes:
-Max Patterns to Display to limit on-chart drawings
-Min Bars Between Patterns to avoid repeated signals too close together in the same direction
Older patterns are automatically deleted once the display limit is exceeded.
🔸 Alerts
When enabled, alerts trigger on new confirmed detections:
-Bullish Pattern Detected
-Bearish Pattern Detected
Alerts fire once per bar when a new pattern is confirmed by a fresh pivot.
🔹 Calculations
This section summarizes the core logic used under the hood.
1) Pivot Detection and Swing Filtering
The script confirms pivots using right side confirmation, then optionally filters them by minimum swing distance relative to the last opposite pivot.
// Pivot detection
float pHigh = ta.pivothigh(high, pivotLeftBars, pivotRightBars)
float pLow = ta.pivotlow(low, pivotLeftBars, pivotRightBars)
// Example swing distance filter (conceptual)
abs(newPivot - lastOppPivot) / lastOppPivot >= minSwingPercent
Pivots are stored in capped arrays (high pivots and low pivots), ensuring performance and stable memory usage.
2) Ratio Measurements (Retracement and Extension)
The engine measures harmonic ratios using two core helpers:
Retracement measures how much the third point retraces the previous leg.
Extension measures how much the next leg extends relative to the previous leg.
// Retracement: (p3 - p2) compared to (p2 - p1)
calcRetracement(p1, p2, p3) =>
float leg = math.abs(p2.price - p1.price)
float retr = math.abs(p3.price - p2.price)
leg != 0 ? retr / leg : na
// Extension: (p4 - p3) compared to (p3 - p2)
calcExtension(p2, p3, p4) =>
float leg = math.abs(p3.price - p2.price)
float ext = math.abs(p4.price - p3.price)
leg != 0 ? ext / leg : na
For a standard XABCD pattern the script evaluates:
-XB retracement of XA
-AC retracement of AB
-BD extension of BC
-XD retracement of XA
3) Tolerance Based Range Check
Ratio validation uses a flexible range check that expands min and max by the tolerance percent:
isInRange(value, minVal, maxVal, tolerance) =>
float tolMin = minVal * (1.0 - tolerance)
float tolMax = maxVal * (1.0 + tolerance)
value >= tolMin and value <= tolMax
This means even “fixed” ratios (like 0.786) still allow a user controlled deviation.
4) Positional Sanity Check for D (Beyond X or Not)
Some harmonic patterns require D to remain within X (non extension patterns), while others require D to break beyond X (extension patterns). The script enforces that using a boolean flag in each template.
Conceptually:
-If the pattern is an extension type, D should cross beyond X in the expected direction
-If the pattern is not extension type, D should stay on the correct side of X
This prevents visually incorrect “ratio matches” that violate the intended geometry.
5) Template Definitions (Ranges + Ideal Targets)
Every pattern includes ratio ranges plus ideal values. The ideal values are used only for scoring quality, not for pass/fail. Example concept:
-Ranges determine validity
-Ideal targets determine ranking
6) Accuracy Scoring (Total Error)
When a candidate passes all validity checks, the script computes an accuracy score by summing absolute deviations from ideal ratios:
calcError(value, ideal) =>
math.abs(value - ideal)
// Total error is the sum of the four leg errors (as available for the pattern)
totalError =
calcError(xbRatio, xbIdeal) +
calcError(acRatio, acIdeal) +
calcError(bdRatio, bdIdeal) +
calcError(xdRatio, xdIdeal)
Lower score means closer to the “textbook” harmonic proportions.
7) Best Match Resolution (Choosing One Winner)
When multiple enabled patterns match the same pivot structure, the script selects the one with the lowest totalError:
updateBest(currentBest, newCandidate) =>
result = currentBest
if not na(newCandidate)
if na(currentBest) or newCandidate.totalError < currentBest.totalError
result := newCandidate
result
This is a major practical feature because it reduces clutter and highlights the highest quality interpretation.
8) Bullish and Bearish Scanning Logic
The scanner runs when pivots confirm:
-Bullish patterns are evaluated on a newly confirmed pivot low (potential D)
-Bearish patterns are evaluated on a newly confirmed pivot high (potential D)
From that D pivot, the script searches backward through stored pivots to build a valid pivot sequence (X,A,B,C,D). If 3 Drives is enabled, it also attempts to find the extra preceding point needed for the 6 point structure.
9) Rendering: Lines, Fill, Labels, and Leg Fib Text
After detection the script draws:
-Primary legs with thicker lines
-Geometric diagonals with dashed lines (for XABCD types)
-Optional fill between selected legs to emphasize the structure area
-A summary label showing direction, pattern name, and ratios
-Optional point labels and leg ratio labels placed near midpoints
To avoid overlapping with candles, the script offsets labels using ATR:
float yOff = math.max(ta.atr(14) * 0.15, syminfo.mintick * 10)
10) Pattern Lifecycle and Cleanup
To respect chart limits and keep visuals clean, the script deletes old drawings once the maximum visible patterns threshold is exceeded. This includes lines, fills, and labels.

Programmers Toolbox of ta LibraryA programmer's "Swiss army knife" for selecting functions from the " ta Library by Trading View " during coding. Illustrates the results of the individual library functions. Adds a few extra features. Extensively and uniquely documented.

RO H1 Signal CandleMarks specific H1 signal candles based on Bucharest (RO) time.
Designed for clean backtesting and time-based analysis.
Displays a small marker on selected hourly candles only.

Green AverageGA (Green Average) is used as a bias and context tool. The indicator is not an entry signal by itself,
but answers the question: Should I even be looking for longs or shorts right now?
1. What the indicator shows
• BP (green line): buying pressure – how much of the upward movement is driven by green
candles.
• SP (red line): selling pressure – how much of the downward movement is driven by red candles.
• GA % (box): proportion of candles that are green (frequency / flow).
2. Quick market read (3 seconds)
• BP above SP → bullish bias
• SP above BP → bearish bias
• Lines close together → chop / uncertain market
• Both lines spiking simultaneously → high energy / volatility
3. Core rules
• Bias first, entry second: trade only in the direction of dominant pressure.
• Crossovers indicate regime shifts, not automatic entries.
• GA % is context, not a buy/sell signal.
4. Entry models
A) Trend continuation
BP > SP with clear separation. Wait for a pullback (VWAP, support, MA) and enter on trend
resumption.
B) Regime shift after crossover
After a BP/SP crossover, wait for price confirmation (15m swing break or VWAP reclaim).
C) Mean reversion (range)
Only when both lines are low and cross frequently. Small targets, defensive sizing.
5. Common mistakes
• Taking every crossover as a trade
• Oversizing when lines are glued together
• Assuming high GA % guarantees upside
6. Day types
• Trend day: BP dominates, GA % often above 52–55.
• Chop day: BP ≈ SP, GA % around 50.
• Distribution: GA % high but SP takes control.
7. Default settings (ETH 5m)
• Window N = 24 (≈ 2 hours)
• BP/SP smoothing = 3
• GA used together with VWAP and price structure

Forexsebi - NASDAQ Psychological Levels - TrendflowTrendflow is an advanced TradingView indicator combining psychological price levels with trend and multi-timeframe analysis.
The indicator automatically plots psychological levels in around the current price. Each level is visualized using horizontal lines and price zones (boxes) to clearly highlight potential support and resistance areas.
Psychological Levels – Trendflow ist ein fortschrittlicher TradingView-Indikator , der wichtige psychologische Preislevel mit einer klaren Trend- und Multi-Timeframe-Analyse kombiniert.
Trend Analysis with SMAs
SMA 50 & SMA 200 plotted directly on the chart
Individually toggleable
Clear color separation for fast trend recognition
Multi-Timeframe SMA Trend Table
Trend status (BULLISH / BEARISH / NEUTRAL) across:
5M, 15M, 1H, 4H, 1D
Logic: Price relative to SMA 50 & SMA 200
Color-coded, easy-to-read table
Info Box
Current Gold price
Nearest psychological level above and below price
Alert System
Alerts when price approaches a psychological level
User-defined alert distance

USDT Market Cap Change [Alpha Extract]A sophisticated stablecoin market analysis tool that tracks USDT market capitalization changes across daily and 60-day periods with statistical normalization and gradient intensity visualization. Utilizing z-score methodology for overbought/oversold detection and dynamic color gradients reflecting change magnitude, this indicator delivers institutional-grade market liquidity assessment through stablecoin flow analysis. The system's dual-timeframe approach combined with statistical normalization provides comprehensive market sentiment measurement based on capital inflows and outflows from the dominant stablecoin.
🔶 Advanced Market Cap Tracking Framework
Implements daily USDT market capitalization monitoring with dual-period change calculations measuring both 1-day and 60-day net capital flows. The system retrieves real-time CRYPTOCAP:USDT data on daily timeframe resolution, calculating absolute dollar changes to quantify stablecoin supply expansion or contraction as primary market liquidity indicator.
// Core Market Cap Analysis
USDT = request.security("CRYPTOCAP:USDT", "D", close)
USDT_60D_Change = USDT - USDT
USDT_1D_Change = USDT - USDT
🔶 Dynamic Gradient Intensity System
Features sophisticated color gradient engine that intensifies visual representation based on change magnitude relative to recent extremes. The system normalizes current 60-day change against configurable lookback period maximum, applying gradient strength calculation to transition colors from neutral tones through progressively intense blues (negative) or reds (positive) based on flow direction and magnitude.
🔶 Statistical Z-Score Normalization Engine
Implements comprehensive z-score calculation framework that normalizes 60-day market cap changes using rolling mean and standard deviation for objective overbought/oversold determination. The system applies statistical normalization over configurable periods, enabling cross-temporal comparison and threshold-based regime identification independent of absolute market cap levels.
// Z-Score Normalization
Change_Mean = ta.sma(USDT_60D_Change, Normalization_Length)
Change_StdDev = ta.stdev(USDT_60D_Change, Normalization_Length)
Z_Score = Change_StdDev > 0 ? (USDT_60D_Change - Change_Mean) / Change_StdDev : 0.0
🔶 Multi-Tier Threshold Detection System
Provides four-level regime classification including standard overbought (+1.5σ), standard oversold (-1.5σ), extreme overbought (+2.5σ), and extreme oversold (-2.5σ) thresholds with configurable adjustment. The system identifies market liquidity extremes when stablecoin inflows or outflows reach statistically significant levels, indicating potential market turning points or trend exhaustion.
🔶 Dual-Timeframe Flow Visualization
Features layered area plots displaying both 60-day strategic flows and 1-day tactical movements with distinct color coding for instant flow direction assessment. The system overlays short-term daily changes on longer-term 60-day trends, enabling traders to identify divergences between tactical and strategic capital flows into or out of stablecoin reserves.
🔶 Gradient Color Psychology Framework
Implements intuitive color scheme where red gradients indicate capital inflow (bullish for crypto as USDT supply expands for buying) and blue gradients show capital outflow (bearish as USDT is redeemed). The intensity progression from pale to vivid colors communicates flow magnitude, with extreme colors signaling statistically significant liquidity events requiring attention.
🔶 Background Zone Highlighting System
Provides subtle background coloring when z-score breaches overbought or oversold thresholds, creating visual alerts without obscuring primary data. The system applies translucent red backgrounds during overbought conditions and blue during oversold states, enabling instant regime recognition across chart timeframes.
🔶 Configurable Normalization Architecture
Features adjustable gradient lookback and statistical normalization periods enabling optimization across different market cycles and trading timeframes. The system allows traders to calibrate sensitivity by modifying the window used for maximum change detection (gradient) and mean/standard deviation calculation (z-score), adapting to volatile or stable market regimes.
🔶 Market Liquidity Interpretation Framework
Tracks USDT supply changes as proxy for overall cryptocurrency market liquidity conditions, where expanding market cap indicates fresh capital entering crypto markets and contracting cap suggests capital flight. The system provides leading indicator properties as large stablecoin inflows often precede major market rallies while outflows may signal distribution phases.
🔶 Why Choose USDT Market Cap Change ?
This indicator delivers sophisticated stablecoin flow analysis through statistical normalization and gradient visualization of USDT market capitalization changes. Unlike traditional market sentiment indicators that rely on price action alone, this tool measures actual capital flows through the dominant stablecoin, providing objective assessment of market liquidity conditions. The combination of dual-timeframe tracking, z-score normalization for overbought/oversold detection, and intensity-based gradient coloring makes it essential for traders seeking macro-level market assessment and regime change detection across cryptocurrency markets. The indicator excels at identifying liquidity extremes that often precede major market reversals or trend accelerations.

ICT Candle Reading PROICT Candle Reading – Visual Clean
This indicator is designed to provide a clean and precise price reading, based on ICT and Smart Money Concepts, without cluttering the chart.
Its purpose is to help traders identify real institutional zones, understand market intention, and improve entry timing, using pure price action.
🔹 What does this indicator show?
🟢 Fair Value Gaps (FVG / Imbalances)
Detects market inefficiencies created by impulsive moves.
Displayed as clean and minimal boxes extended into the future.
Useful as mitigation, reaction, or continuation zones.
🟠 Liquidity Sweeps
Highlights liquidity grabs above recent highs or below recent lows.
Drawn using dashed horizontal lines.
Helps identify market manipulation before the true move.
🔵 Displacement Candles
Identifies candles with dominant bodies, showing institutional momentum.
Marked with small symbols to keep the chart clean.
Useful to confirm impulse starts or shifts in market intent.
🎯 Indicator Philosophy
❌ No lagging indicators
❌ No chart clutter
✅ Real ICT concepts
✅ Clean candle reading
✅ Suitable for scalping, intraday, and swing trading
⚙️ Customization
Each concept can be enabled or disabled individually.
Zone extension length is adjustable.
Optimized for 15M, 1H, and 4H timeframes.
📈 How to use
This indicator does not provide automatic buy/sell signals.
It is best used with:
Higher timeframe bias
Market structure
Session timing (London / New York)
Proper risk management
🧠 Final Notes
ICT Candle Reading – Visual Clean helps you see the market from an institutional perspective, focusing only on what truly matters: price, liquidity, and intent.

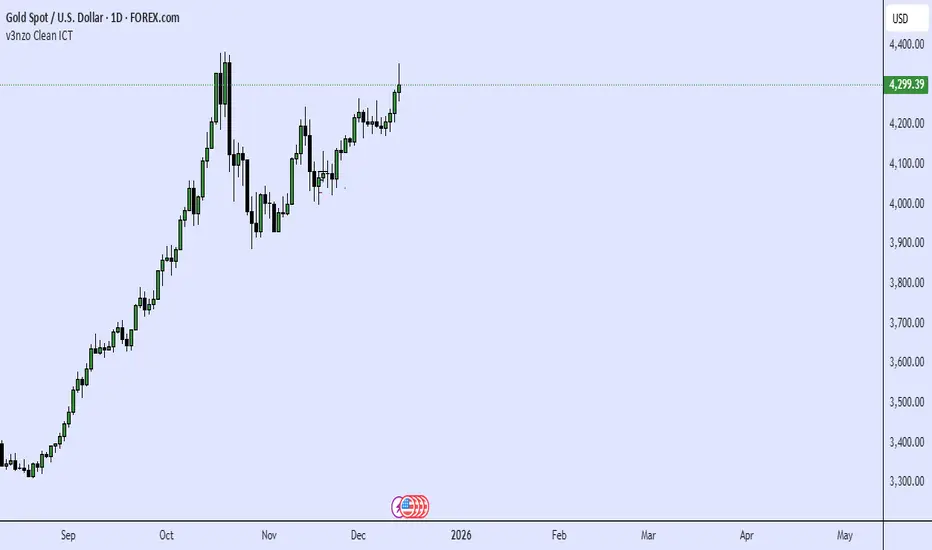
Magical Thirteen Turns - The Greedy SnakeThe number 9 appears:
Meaning: Warning signal. The rise may encounter resistance and a cautious pullback is about to begin.
Operation: Consider reducing your holdings (selling a portion) to lock in profits and avoid experiencing wild fluctuations.
The number 13 appears:
Meaning: Strong sell signal. The upward momentum is likely to be exhausted, which is also known as "bull exhaustion".
Operation: It is recommended to liquidate your positions or significantly reduce them. Short sell (if you are trading contracts).

VEGA (Velocity of Efficient Gain Adaptation)VEGA (Velocity of Efficient Gain Adaptation)
VEGA is a momentum oscillator that measures the velocity of an efficiency-weighted adaptive moving average. Unlike traditional momentum indicators that react uniformly to all price movements, VEGA intelligently adapts its sensitivity based on market conditions—responding quickly during trending periods and filtering noise during consolidation.
--------------------------------
What Makes VEGA Different
Efficiency-Driven Adaptation
At its core, VEGA uses the Efficiency Ratio (ER) to distinguish between trending and choppy markets. When price moves efficiently in one direction, VEGA's underlying adaptive MA speeds up to capture the move. When price chops sideways, it slows down to avoid whipsaws. This creates a momentum reading that's inherently cleaner than fixed-period alternatives.
Linear Regression Smoothed Source
VEGA offers an optional LinReg-smoothed price source that blends regular candles with linear regression values. This pre-smoothing reduces noise before it ever enters the calculation, resulting in a histogram that's easier to read without sacrificing responsiveness. The mix ratio lets you dial in exactly how much smoothing you want.
Z-Score Normalization with Dead Zone
Rather than arbitrary oscillator bounds, VEGA normalizes output as standard deviations from the mean. This gives statistically meaningful levels: readings above +2σ or below -2σ represent genuinely extreme momentum. The configurable dead zone (with Snap, Soft Fade, or None modes) filters out insignificant movements near zero, keeping you focused on signals that matter.
--------------------------------
How It Works
1. Source Preparation — Price is smoothed via a LinReg/regular candle blend
2. Efficiency Ratio — Measures directional movement vs total movement over the lookback period
3. Adaptive MA — Applies variable smoothing based on efficiency (fast during trends, slow during chop)
4. Velocity — Calculates the rate of change of the adaptive MA
5. Normalization — Converts to Z-Score (standard deviations) or ATR-normalized percentage
6. Dead Zone — Optionally filters near-zero values to reduce noise
--------------------------------
How To Read VEGA
Signal and Interpretation
Histogram above zero | Bullish momentum
Histogram below zero | Bearish momentum
Bright color | Momentum accelerating
Faded color | Momentum decelerating
Beyond ±1σ bands | Above-average momentum
Beyond ±2σ bands | Extreme momentum (potential reversal zone)
Zero line cross*| Momentum shift
--------------------------------
Key Settings
ER Length — Lookback for efficiency ratio calculation. Higher = smoother, slower adaptation.
Fast/Slow Smoothing — Controls the adaptive MA's responsiveness range. The MA blends between these based on efficiency.
LinReg Settings — Enable smoothed candles and adjust the blend ratio (0 = regular candles, 1 = full LinReg, 0.5 = 50/50 mix).
Z-Score Lookback — Period for calculating mean and standard deviation. Shorter = more reactive normalization.
Dead Zone Type — How to handle near-zero values:
Snap — Hard cutoff to zero
Soft Fade — Gradual reduction toward zero
None — No filtering
Dead Zone Threshold — Values within this Z-Score range are affected by the dead zone setting.
VEGA works on any timeframe and any market. For best results, adjust the ER Length and LinReg settings to match your trading style and the volatility characteristics of your instrument.

Volatility Targeting: Single Asset [BackQuant]Volatility Targeting: Single Asset
An educational example that demonstrates how volatility targeting can scale exposure up or down on one symbol, then applies a simple EMA cross for long or short direction and a higher timeframe style regime filter to gate risk. It builds a synthetic equity curve and compares it to buy and hold and a benchmark.
Important disclaimer
This script is a concept and education example only . It is not a complete trading system and it is not meant for live execution. It does not model many real world constraints, and its equity curve is only a simplified simulation. If you want to trade any idea like this, you need a proper strategy() implementation, realistic execution assumptions, and robust backtesting with out of sample validation.
Single asset vs the full portfolio concept
This indicator is the single asset, long short version of the broader volatility targeted momentum portfolio concept. The original multi asset concept and full portfolio implementation is here:
That portfolio script is about allocating across multiple assets with a portfolio view. This script is intentionally simpler and focuses on one symbol so you can clearly see how volatility targeting behaves, how the scaling interacts with trend direction, and what an equity curve comparison looks like.
What this indicator is trying to demonstrate
Volatility targeting is a risk scaling framework. The core idea is simple:
If realized volatility is low relative to a target, you can scale position size up so the strategy behaves like it has a stable risk budget.
If realized volatility is high relative to a target, you scale down to avoid getting blown around by the market.
Instead of always being 1x long or 1x short, exposure becomes dynamic. This is often used in risk parity style systems, trend following overlays, and volatility controlled products.
This script combines that risk scaling with a simple trend direction model:
Fast and slow EMA cross determines whether the strategy is long or short.
A second, longer EMA cross acts as a regime filter that decides whether the system is ACTIVE or effectively in CASH.
An equity curve is built from the scaled returns so you can visualize how the framework behaves across regimes.
How the logic works step by step
1) Returns and simple momentum
The script uses log returns for the base return stream:
ret = log(price / price )
It also computes a simple momentum value:
mom = price / price - 1
In this version, momentum is mainly informational since the directional signal is the EMA cross. The lookback input is shared with volatility estimation to keep the concept compact.
2) Realized volatility estimation
Realized volatility is estimated as the standard deviation of returns over the lookback window, then annualized:
vol = stdev(ret, lookback) * sqrt(tradingdays)
The Trading Days/Year input controls annualization:
252 is typical for traditional markets.
365 is typical for crypto since it trades daily.
3) Volatility targeting multiplier
Once realized vol is estimated, the script computes a scaling factor that tries to push realized volatility toward the target:
volMult = targetVol / vol
This is then clamped into a reasonable range:
Minimum 0.1 so exposure never goes to zero just because vol spikes.
Maximum 5.0 so exposure is not allowed to lever infinitely during ultra low volatility periods.
This clamp is one of the most important “sanity rails” in any volatility targeted system. Without it, very low volatility regimes can create unrealistic leverage.
4) Scaled return stream
The per bar return used for the equity curve is the raw return multiplied by the volatility multiplier:
sr = ret * volMult
Think of this as the return you would have earned if you scaled exposure to match the volatility budget.
5) Long short direction via EMA cross
Direction is determined by a fast and slow EMA cross on price:
If fast EMA is above slow EMA, direction is long.
If fast EMA is below slow EMA, direction is short.
This produces dir as either +1 or -1. The scaled return stream is then signed by direction:
avgRet = dir * sr
So the strategy return is volatility targeted and directionally flipped depending on trend.
6) Regime filter: ACTIVE vs CASH
A second EMA pair acts as a top level regime filter:
If fast regime EMA is above slow regime EMA, the system is ACTIVE.
If fast regime EMA is below slow regime EMA, the system is considered CASH, meaning it does not compound equity.
This is designed to reduce participation in long bear phases or low quality environments, depending on how you set the regime lengths. By default it is a classic 50 and 200 EMA cross structure.
Important detail, the script applies regime_filter when compounding equity, meaning it uses the prior bar regime state to avoid ambiguous same bar updates.
7) Equity curve construction
The script builds a synthetic equity curve starting from Initial Capital after Start Date . Each bar:
If regime was ACTIVE on the previous bar, equity compounds by (1 + netRet).
If regime was CASH, equity stays flat.
Fees are modeled very simply as a per bar penalty on returns:
netRet = avgRet - (fee_rate * avgRet)
This is not realistic execution modeling, it is just a simple turnover penalty knob to show how friction can reduce compounded performance. Real backtesting should model trade based costs, spreads, funding, and slippage.
Benchmark and buy and hold comparison
The script pulls a benchmark symbol via request.security and builds a buy and hold equity curve starting from the same date and initial capital. The buy and hold curve is based on benchmark price appreciation, not the strategy’s asset price, so you can compare:
Strategy equity on the chart symbol.
Buy and hold equity for the selected benchmark instrument.
By default the benchmark is TVC:SPX, but you can set it to anything, for crypto you might set it to BTC, or a sector index, or a dominance proxy depending on your study.
What it plots
If enabled, the indicator plots:
Strategy Equity as a line, colored by recent direction of equity change, using Positive Equity Color and Negative Equity Color .
Buy and Hold Equity for the chosen benchmark as a line.
Optional labels that tag each curve on the right side of the chart.
This makes it easy to visually see when volatility targeting and regime gating change the shape of the equity curve relative to a simple passive hold.
Metrics table explained
If Show Metrics Table is enabled, a table is built and populated with common performance statistics based on the simulated daily returns of the strategy equity curve after the start date. These include:
Net Profit (%) total return relative to initial capital.
Max DD (%) maximum drawdown computed from equity peaks, stored over time.
Win Rate percent of positive return bars.
Annual Mean Returns (% p/y) mean daily return annualized.
Annual Stdev Returns (% p/y) volatility of daily returns annualized.
Variance of annualized returns.
Sortino Ratio annualized return divided by downside deviation, using negative return stdev.
Sharpe Ratio risk adjusted return using the risk free rate input.
Omega Ratio positive return sum divided by negative return sum.
Gain to Pain total return sum divided by absolute loss sum.
CAGR (% p/y) compounded annual growth rate based on time since start date.
Portfolio Alpha (% p/y) alpha versus benchmark using beta and the benchmark mean.
Portfolio Beta covariance of strategy returns with benchmark returns divided by benchmark variance.
Skewness of Returns actually the script computes a conditional value based on the lower 5 percent tail of returns, so it behaves more like a simple CVaR style tail loss estimate than classic skewness.
Important note, these are calculated from the synthetic equity stream in an indicator context. They are useful for concept exploration, but they are not a substitute for professional backtesting where trade timing, fills, funding, and leverage constraints are accurately represented.
How to interpret the system conceptually
Vol targeting effect
When volatility rises, volMult falls, so the strategy de risks and the equity curve typically becomes smoother. When volatility compresses, volMult rises, so the system takes more exposure and tries to maintain a stable risk budget.
This is why volatility targeting is often used as a “risk equalizer”, it can reduce the “biggest drawdowns happen only because vol expanded” problem, at the cost of potentially under participating in explosive upside if volatility rises during a trend.
Long short directional effect
Because direction is an EMA cross:
In strong trends, the direction stays stable and the scaled return stream compounds in that trend direction.
In choppy ranges, the EMA cross can flip and create whipsaws, which is where fees and regime filtering matter most.
Regime filter effect
The 50 and 200 style filter tries to:
Keep the system active in sustained up regimes.
Reduce exposure during long down regimes or extended weakness.
It will always be late at turning points, by design. It is a slow filter meant to reduce deep participation, not to catch bottoms.
Common applications
This script is mainly for understanding and research, but conceptually, volatility targeting overlays are used for:
Risk budgeting normalize risk so your exposure is not accidentally huge in high vol regimes.
System comparison see how a simple trend model behaves with and without vol scaling.
Parameter exploration test how target volatility, lookback length, and regime lengths change the shape of equity and drawdowns.
Framework building as a reference blueprint before implementing a proper strategy() version with trade based execution logic.
Tuning guidance
Lookback lower values react faster to vol shifts but can create unstable scaling, higher values smooth scaling but react slower to regime changes.
Target volatility higher targets increase exposure and drawdown potential, lower targets reduce exposure and usually lower drawdowns, but can under perform in strong trends.
Signal EMAs tighter EMAs increase trade frequency, wider EMAs reduce churn but react slower.
Regime EMAs slower regime filters reduce false toggles but will miss early trend transitions.
Fees if you crank this up you will see how sensitive higher turnover parameter sets are to friction.
Final note
This is a compact educational demonstration of a volatility targeted, long short single asset framework with a regime gate and a synthetic equity curve. If you want a production ready implementation, the correct next step is to convert this concept into a strategy() script, add realistic execution and cost modeling, test across multiple timeframes and market regimes, and validate out of sample before making any decision based on the results.

5-Period Average of Returns (Close)This indicator calculates the 5-period average of returns of the closing price, providing a detrended, zero-centered oscillator ideal for cycle analysis and timing.
Key Features:
Detrended: Centers around zero to clearly reveal cyclical patterns.
Cycle-friendly: Highlights peaks and troughs for measuring dominant cycles.
Flexible: Can be applied to multiple timeframes (daily, weekly, intraday).
Zero Line Reference: Quickly identify directional shifts in average returns.
Foundation for Advanced Analysis: Can be combined with RSI, statistical bands, or multi-timeframe studies.
Use this indicator to:
Identify dominant cycles and their phase
Measure cycle length and rhythm
Assist in entry and exit timing based on average-return oscillations
Detrend price data for more precise technical and cyclical analysis

Sideways Zone Breakout 📘 Sideways Zone Breakout – Indicator Description
Sideways Zone Breakout is a visual market-structure indicator designed to identify low-volatility consolidation zones and highlight potential breakout opportunities when price exits these zones.
This indicator focuses on detecting periods where price trades within a tight range, often referred to as sideways or consolidation phases, and visually marks these zones directly on the chart for clarity.
🔍 Core Concept
Markets often spend time moving sideways before making a directional move.
This indicator aims to:
Detect price compression
Visually highlight the sideways zone
Signal when price breaks above or below the zone boundaries
Instead of predicting direction, it simply reacts to range expansion after consolidation.
⚙️ How the Indicator Works
1️⃣ Sideways Zone Detection
The indicator looks back over a user-defined number of candles
It calculates the highest high and lowest low within that window
If the total price range remains within a defined percentage of the current price, the market is considered sideways
This helps filter out trending and highly volatile conditions.
2️⃣ Visual Zone Representation
When a sideways condition is detected:
A clear price zone is drawn between the recent high and low
The zone is displayed using a soft gradient fill for better visibility
Outer borders are added to enhance zone clarity without cluttering the chart
This makes consolidation areas easy to spot at a glance.
3️⃣ Breakout Identification
Once a sideways zone is active:
A bullish breakout is marked when price closes above the upper boundary
A bearish breakout is marked when price closes below the lower boundary
Directional arrows and labels are plotted directly on the chart to indicate these events.
📊 Visual Elements Included
Sideways consolidation zones with gradient fill
Upper and lower zone boundaries
Buy and Sell arrows on breakout
Optional text labels for clear interpretation
All visuals are designed to remain lightweight and readable on any chart theme.
🔧 User Inputs
Sideways Lookback (candles): Controls how many past candles are used to define the range
Max Range % (tightness): Determines how tight the range must be to qualify as sideways
Adjusting these inputs allows users to adapt the indicator to different instruments and timeframes.
📈 Usage Guidelines
Can be applied to any market or timeframe
Works well as a context or confirmation tool
Best used alongside volume, trend, or risk management tools
Signals should be validated with proper trade planning
⚠️ Disclaimer
This indicator is provided as open-source for educational and analytical purposes only.
It does not generate trade recommendations or guarantee outcomes.
Market conditions vary, and users are responsible for their own trading decisions.

MNQ Quant Oscillator Lab v2.1MNQ Quant Oscillator Lab v2.1 — Clean Namespaces
Adaptive LinReg Oscillator + Auto Regime Switching + MTF Confirmation + MOEP Gate + Research Harness
MNQ Quant Oscillator Lab is a research-grade oscillator framework designed for MNQ/NQ (and other liquid futures/indices) on 1-minute and intraday timeframes. It combines a linear-regression-based detrended oscillator with quant-style normalization, adaptive parameterization, regime switching, multi-timeframe confirmation, and an optional MOEP (Minimum Optimal Entry Point) gate. The goal is to provide a customizable signal laboratory that is stable in real time, non-repainting by default, and suitable for systematic experimentation.
What this indicator does
1) Core oscillator (quant-normalized)
The indicator computes a linear regression (LinReg) detrended signal and expresses it as a z-scored oscillator for portability across volatility regimes and assets. You can switch the oscillator “transform family” via Oscillator type:
LinReg Residual / Residual Z: detrended residual (mean-reversion sensitive)
LinReg Slope Z: regression slope (trend-derivative sensitive)
LogReturn Z: log-return oscillator (momentum-style)
VolNorm Return Z: volatility-normalized returns (risk-scaled)
This yields a single oscillator that is comparable over time, not tied to raw point values.
2) Adaptive length (dynamic calibration)
When enabled, the regression length is automatically adapted using a volatility-regime proxy (ATR% z-scored → logistic mapping). High volatility typically shortens the effective lookback; low volatility allows longer lookbacks. This helps the oscillator remain responsive during expansions while staying stable in compressions.
Important: the adaptive logic is implemented with safe warmup behavior, so it will not throw NaN errors on early bars.
3) Adaptive thresholds (dynamic bands)
Instead of static overbought/oversold levels, the indicator can compute dynamic upper/lower bands from the oscillator’s own distribution (rolling mean + sigma). This creates thresholds that adjust automatically to regime changes.
4) Auto regime switching (Trend vs Mean Reversion)
With Auto regime switch enabled, the indicator selects whether to behave as a Trend system or a Mean Reversion system using an interpretable heuristic:
Trend regime when EMA-spread is strong relative to ATR and ATR is rising
Otherwise defaults to Mean Reversion
This prevents running mean-reversion logic in trend breakouts and reduces “mode mismatch.”
5) Multi-timeframe (MTF) confirmation (optional)
MTF confirmation can be enabled to require that the higher timeframe oscillator sign aligns with the direction of the signal. This is useful for reducing noise on MNQ 1m by requiring higher-timeframe structure agreement (e.g., 5m or 15m).
6) MOEP Gate (optional “institutional” filter)
The MOEP gate is a confluence score filter intended to reduce low-quality signals. It aggregates multiple components into a 0–100 score:
BB/KC squeeze condition
Expansion proxy
Trend proxy
Momentum proxy (RSI-based)
Volume catalyst (volume z-score)
Structure break (highest/lowest break)
You can set:
Score threshold (minimum score required)
Minimum components required (forces diversity of evidence)
When enabled, a signal must satisfy both oscillator logic and MOEP confluence conditions.
7) Research harness (NON-CAUSAL, OFF by default)
A built-in research mode evaluates signals using future bars to compute basic forward excursion statistics:
MFE (max favorable excursion)
MAE (max adverse excursion)
Simple win-rate proxy based on MFE vs MAE
This feature is strictly for offline analysis and tuning. It is disabled by default and should not be considered “live-safe” because it uses future information for evaluation.
Signals and interpretation
Mean Reversion regime
Long: oscillator is below the lower band and turns back upward across it
Short: oscillator is above the upper band and turns back downward across it
Trend regime
Long: oscillator crosses above zero (optionally requires structure break confirmation)
Short: oscillator crosses below zero (optionally requires structure break confirmation)
Hybrid
When Hybrid is selected (manual mode), the indicator allows both trend and mean-reversion triggers, but still respects the filters and gates you enable.
Recommended starting configuration (MNQ 1m)
If you want stable, high-quality signals first, then expand into research:
Use RTH only: ON
Auto regime switch: ON
Adaptive length: ON
Adaptive bands: ON
MTF confirmation: OFF initially (turn ON later with 5m)
MOEP Gate: OFF initially (turn ON after you confirm base behavior)
Research harness: OFF (only enable for tuning studies)
Practical notes / transparency
The indicator is designed to be stable on live bars (optional confirmed-bar behavior reduces flicker).
No repainting logic is used for signals.
Any “performance” numbers shown under Research harness are not tradable metrics; they are forward-looking evaluation outputs intended strictly for experimentation.
Disclaimer
This script is provided for educational and research purposes only and does not constitute financial advice. Futures trading involves substantial risk, including the possibility of loss exceeding initial investment.

Session Highlighter with Kill Zones [Exponential-X]Session Highlighter with Kill Zones
Overview
This indicator provides comprehensive visualization of major forex trading sessions (Asian, London, and New York) with integrated kill zone detection and real-time session analytics. It helps traders identify optimal trading times by highlighting high-volatility periods and tracking session-specific price ranges.
What Makes This Original
While session indicators are common, this script uniquely combines several features that work together:
Kill Zone Integration: Highlights specific high-volatility windows within sessions (London: 02:00-05:00 EST, NY: 08:30-11:00 EST) when institutional activity typically peaks
Session Overlap Detection: Automatically detects and highlights when major sessions overlap (London-NY, Asian-London) with distinct visual cues
Real-Time Range Tracking: Calculates and displays percentage-based session ranges as they develop, not just historical data
Dynamic Statistics Dashboard: Live table showing current active session, session times, and comparative range percentages
Customizable Visual System: Flexible styling options including background shading, box overlays, and configurable line styles for session boundaries
How It Works
Session Detection Logic
The script uses timezone-normalized session detection based on EST/EDT times. It converts the current bar's timestamp to New York time and determines which session(s) are active using minute-based calculations. This approach ensures accurate session detection regardless of your chart's timezone settings.
Kill Zones
Kill zones represent periods within sessions when institutional traders are most active. The London kill zone (02:00-05:00 EST) captures pre-London open volatility, while the NY kill zone (08:30-11:00 EST) aligns with US economic data releases and market open activity.
Range Calculations
Session highs, lows, and opens are tracked from the first bar of each session and updated in real-time. Range percentages are calculated as: ((High - Low) / Low) × 100 , providing a volatility measure that's comparable across different instruments and price levels.
Visual System
Background shading: Color-coded zones for each session
Session boxes: Outline entire session ranges
H/L lines: Dynamic lines showing current session extremes
Open lines: Reference levels from session start
Overlap highlighting: Distinct colors when multiple sessions are active simultaneously
How to Use
Intraday Trading: Use kill zones to time entries during high-liquidity periods
Session Breakouts: Monitor for price breaks above/below session highs/lows
Range Trading: Trade between session boundaries during consolidation
Session Continuity: Observe how price behaves as sessions transition
Volatility Assessment: Compare current session ranges to typical values
Recommended Timeframes: Works on any timeframe, but most useful on 1m to 1H charts for intraday trading.
Settings Explained
Sessions Group
Toggle each major session on/off independently
Customize colors for visual clarity
Enable/disable overlap highlighting
Levels Group
Show/hide session high/low lines
Show/hide session open levels
Choose line styles (Solid/Dashed/Dotted)
Kill Zones Group
Toggle kill zone highlighting
Select which kill zones to display
Customize kill zone color intensity
Display Group
Show/hide statistics table
Show/hide session labels on chart
Important Notes
All times are displayed in EST/EDT
Session ranges reset at the start of each new session
Kill zones are session sub-periods, not separate sessions
Overlap colors override individual session colors when multiple sessions are active
The statistics table updates in real-time and shows percentage-based ranges for cross-instrument comparison
Session Times Reference
Asian Session: 19:00 - 04:00 EST (Tokyo open through early Sydney close)
London Session: 03:00 - 12:00 EST (Full European trading hours)
New York Session: 08:00 - 17:00 EST (US market hours)
London Kill Zone: 02:00 - 05:00 EST (Pre-London volatility spike)
NY Kill Zone: 08:30 - 11:00 EST (US open and news releases)
Alerts Available
The script includes six pre-configured alert conditions:
London Kill Zone start
NY Kill Zone start
London-NY Overlap start
Asian Session open
London Session open
NY Session open
Create alerts through TradingView's alert system to get notified when specific sessions or kill zones begin.
Disclaimer: This indicator is for informational purposes only. Session times and kill zones are based on typical market patterns but do not guarantee specific trading outcomes. Always use proper risk management.

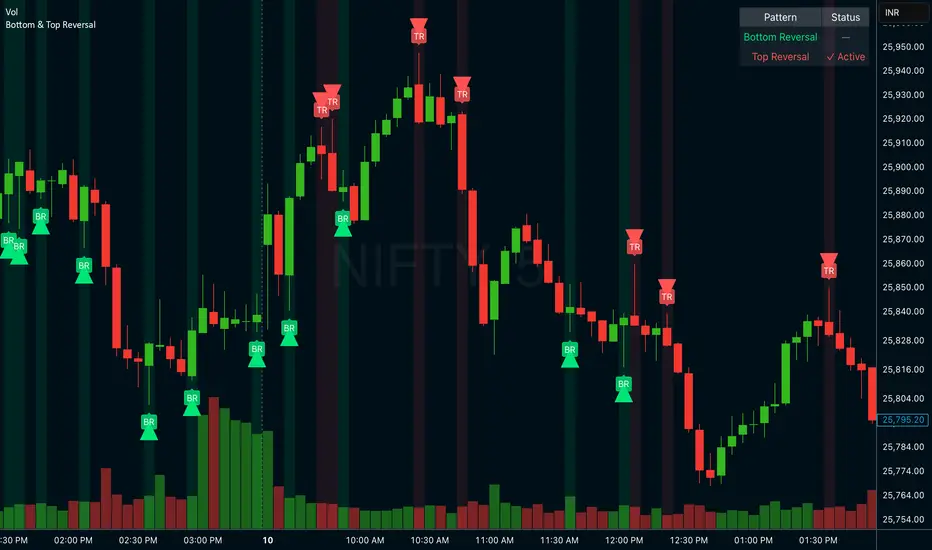
Bottom & Top ReversalBottom & Top Reversal
Bottom Reversal (Bullish):
Opens gap down but recovers strongly
Makes new low but closes above previous close
Lime green arrow + label
Top Reversal (Bearish):
Opens gap up but fails
Makes new high but closes below previous close
Red arrow + label
Extra features:
Status table showing active patterns
Toggle each pattern on/off
Background highlights
Alert system
SB-VDEMA + PivotsBest use - Intraday Scalping ( 1 Mt, 3 Mts, 5 Mts )
Uses Volatility weighted DEMA for smoother and reliable signals.
One can use dynamic colour coding of VWDEMA for entering call or puts. VWAP and Henkin ashi Supertrend is also there but, i think VWDEMA is quite enogh for decision making.

SB - Ultimate Clean Trend Pro Uses dynamic Moving colour coding for spotting chage of bias. Use set up with keeping VWAP in reference.

SB - RSI EW OscillatorAdd EW with RSI.
Makes sense take a call if RSI is above 50 and EW turns green and vice versa.

VWAP Histogram with EMAsBased on VWAP and Moving Averages.
Bias turns +ve if dynamic colour of the moving averages turns green. All moving avaerages are customisable.

Stepped Multi Timeframe MAs with PDH PDL TDH TDL Dynamic Labels
Plots stepped (blocky) higher‑timeframe moving averages and VWAP on the current chart (HMA/EMA/VWMA/SMA/VWAP toggles).
Automatically switches MA source to the chart’s timeframe on Daily/Weekly/Monthly (e.g., Weekly chart shows weekly MAs), while intraday charts can use a user-selected higher timeframe.
Draws Previous Day High/Low (PDH/PDL) anchored from the exact candle that formed the level, then extends the line across the chart up to the latest bar.
Draws Today’s High/Low (TDH/TDL) the same way, and updates dynamically as new intraday highs/lows are made (the anchor shifts to the new wick candle).
Keeps labels readable by placing them above/below each line with no background and a clean grey style, and repositions label X based on the visible chart window (so labels stay at a consistent % from the right edge while you pan/zoom)
