BALANCED Strategy: Intraday Pro + Smart DashboardWelcome to the BALANCED Strategy: Intraday Pro.
This all-in-one indicator is designed for Intraday traders looking to capture trend movements while effectively filtering out sideways market noise. It combines the power of Supertrend for direction, EMA 100 for the baseline trend, and rigorous validation via RSI and ADX.
The script also integrates a complete Risk Management system with targets based on the Golden Ratio (Fibonacci) and a real-time Dashboard.
⏳ Recommended Timeframes
This algorithm is optimized for Intraday volatility:
M5 (5 Minutes) ⭐️: Ideal for quick Scalping. The ADX filter is crucial here to avoid false signals.
M15 (15 Minutes) 🏆: The "Sweet Spot." It offers the best balance between signal frequency and trend reliability.
M30 / H1: For a "Swing Intraday" approach—calmer, fewer signals, but higher precision.
Not recommended for M1 (1 Minute) with default settings (too much noise).
🚀 How It Works
The algorithm follows a strict 3-step logic to generate high-quality signals:
1. Trend Identification (The Engine)
Supertrend: Determines the immediate direction.
EMA 100: Acts as a background trend filter. We only buy above and sell below the EMA.
2. Noise Filtering (Safety)
ADX (Average Directional Index): The signal is only validated if there is sufficient volatility (Configurable threshold, default 12) to avoid "chop markets" (flat markets).
RSI (Relative Strength Index): Strict momentum filter. Buy only if RSI > 50, Sell if RSI < 50.
3. Entry Confirmation (The Trigger)
The script doesn't just rely on a crossover. It waits for "Price Action" confirmation: the candle must close higher than the previous one (for Long) or lower (for Short) to validate the entry.
🛡️ Risk Management (Money Management)
This is the core strength of this tool. Upon signal validation, the script automatically calculates and plots:
Stop Loss (SL): Based on volatility (ATR). It places the stop at the recent Low/High with a safety padding.
Take Profit (TP): Two modes available:
Fibonacci Mode (Default): Targets the 1.618 extension (Golden Ratio) of the risk taken.
Fixed Ratio Mode: Targets a manual Risk/Reward ratio (e.g., 2.0).
📊 The Dashboard
Located at the bottom right, the smart dashboard provides vital info at a glance:
Signal Time: To check if the alert is fresh.
Type (LONG/SHORT): Color-coded (Green/Pink).
Tech Data: RSI and ADX values at the moment of the signal.
Exact Prices: Entry Level, Target (TP), and Stop Loss (SL).
⚙️ Configurable Settings
Sensitivity: Adjust the Supertrend factor (Default 2.0).
Filters: Toggle the RSI filter ON/OFF or adjust the ADX threshold.
Execution: Choose between Fibonacci Target (1.618) or a Manual Ratio.
⚠️ Disclaimer: This tool is a technical decision aid and does not constitute financial investment advice. Always use prudent risk management and backtest the indicator on your preferred assets before live use.
Индикаторы и стратегии

NeoChartLabs TrixxOne of our Favorite Indicators - The Trixx - The Trix with K & J lines for extra crossovers and trend analysis. Best when used on the 4hr and above.
Shout out to fauxlife for the original script, we updated to v6.
The TRIX indicator (Triple Exponential Average) is a momentum oscillator used in technical analysis to show the percentage rate of change of a triple-smoothed exponential moving average, helping traders identify overbought/oversold conditions and potential trend reversals by filtering out minor price fluctuations. It plots as a line oscillating around a zero line, often with a signal line (an EMA of TRIX) for crossovers, and traders look for divergence with price or signal line crosses for buy/sell signals

Golden hour 1130 1230 Session LinesGolden Hour 11:30–12:30 Session Lines
Overview :
Calculate the session high and low between 11:30 AM and 12:30 PM and mark the lines.
Trading Rule
Once the price breaks either side (high or low), it will continue to move further in that direction.
Session Time : 11:30 AM – 12:30 PM
Key Levels : Session High & Session Low
Strategy : Breakout continuation in the direction of the break

Prince Break and RetestHow to use the new visuals (super simple)
When the script prints RETEST BUY or RETEST SELL, you will instantly see:
ENTRY line (lime)
SL line (orange)
TP1 line (teal)
TP2 line (purple)
Entry Mode options
Close = enter at the close of the retest signal candle (simplest)
Box Edge = enter at the box edge (more “limit-order-ish”)
For your style (break + retest), start with Close.

NeoChartLabs Trend VolatalityAn Experimental Indicator - Trend Volatility
Using the Trix & ATR, it becomes possible to measure the volatility in the trend.
When the ATR% is below the user defined rate (default is 5%), the background turns RED signaling a low vol asset.
If ATRP goes under 5% in Crypto and the background turns RED - expect a large move to happen soon either up or down.

USOIL BOS Retest Overlay (HTF + Blocks + Profit Zone + Lot Size)This is a test overlay that should show entry positions and lot sizes to take based on R20 000 account. This was made purely for USOIL

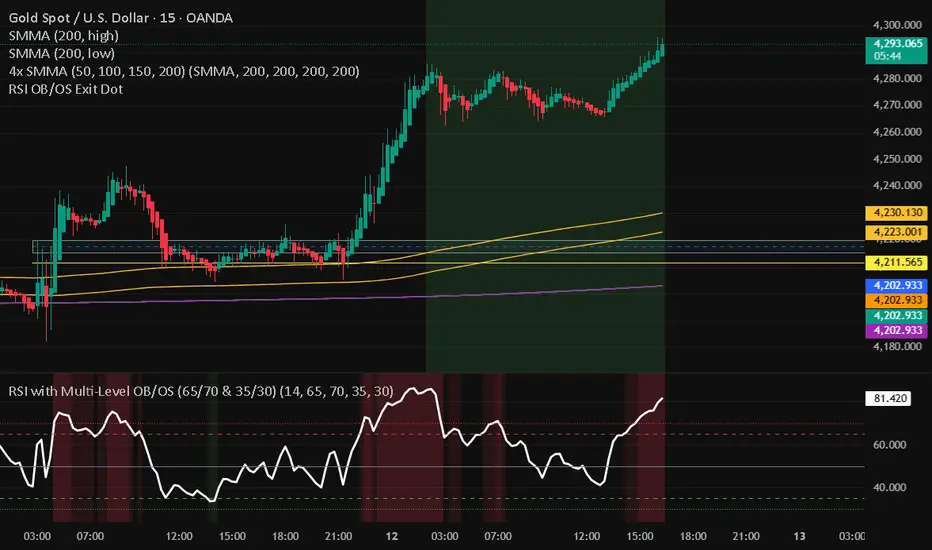
RSI with Multi-Level OB/OS (65/70 & 35/30)With a revised 65 and 35 level for higher probability of winning

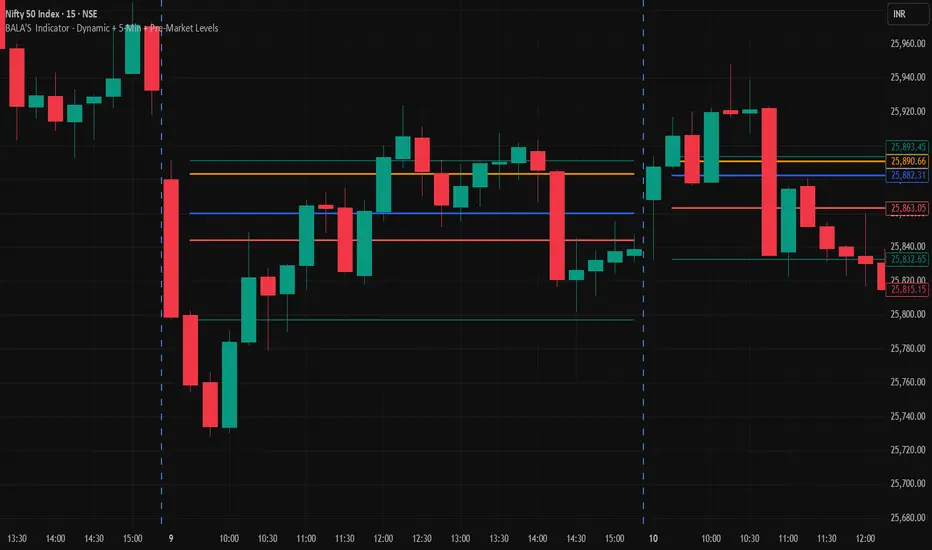
BALA'S Indicator - Dynamic + 5-Min + Pre-Market LevelsINTRADAY Strategy on Nifty with 15min Candle Setup.
Miela Labs | John Dee's Watchtower [257-463]Bridging the gap between 16th-century esoteric mathematics and modern algorithmic trading.
The Enochian Watchtower is not merely a trend indicator; it is a computational artifact developed by Miela Labs LLC. This script translates Dr. John Dee’s "Great Table of the Watchtowers" and the "Sigil Dei Aemeth" into actionable financial data points.
Using our proprietary Occultator V2.0 Engine, we have derived specific mathematical constants that resonate with the current market structure.
🏛️ The Algorithmic Logic
This indicator utilizes three sacred numbers to construct a "Future Vision" of the market:
1. The Axis Mundi (Vector 257): derived from Fermat Primes and John Dee’s Grid coordinates. This Weighted Moving Average (WMA) acts as the spinal cord of the trend.
2. The Gates (Cipher 463): A prime number derived from the "Galethog" cipher stride. These bands define the absolute volatility limits (Heaven & Earth Gates).
3. Future Vision (Offset 21): Utilizing Fibonacci time sequences, the indicator projects Support and Resistance levels 21 bars into the future, allowing traders to anticipate market movements before they occur.
⚡ How to Use
• The Trend: If price is above the Purple Axis (257), the market is in a bullish phase.
• The Entry: Look for "L" (Long) and "S" (Short) signals. These are confirmed when the signal path crosses the Axis.
• The Future: Watch the projected lines on the right side of the chart to identify upcoming resistance zones.
About Miela Labs
Miela Labs is a Technomancy Research Institute based in McKinney, Texas. We specialize in building open-source esoteric trading tools and the Magic Programming Language (MPL).
🌐 Official Hub: Visit Miela Labs
💻 Source Code & Research: GitHub Repository
Disclaimer: This tool is for educational and research purposes only. It demonstrates the application of esoteric mathematics in financial analysis. Trade responsibly.

Risk & Position CalculatorThis indicator is called "Risk & Position Calculator".
This indicator shows 4 information on a table format.
1st: 20 day ADR% (ADR%)
2nd: Low of the day price (LoD)
3rd: The percentage distance between the low of the day price and the current market price in real-time (LoD dist.%)
4th: The calculated amount of shares that are suggested to buy (Shares)
The ADR% and LoD is straightforward, and I will explain more on the 3rd and 4th information.
__________________________________________________________________________________
The Lod dist.% is a useful tool if you are a breakout buyer and use the low of the day price as your stop loss, it helps you determine if a breakout buy is at a risk tight area (~1/2 ADR%) or it is more of a chase (>1 ADR%).
I use four different colors to visualize this calculation results (green, yellow, purple, and red).
Green: Lod dist.% <= 0.5 ADR%
Yellow: 0.5 ADR% < Lod dist.% <= 1 ADR%
Purple: 1 ADR% < Lod dist.% <= 1.5 ADR%
Red: 1.5 ADR% < Lod dist.%
(e.g., if Lod dist.% is colored in Green, it means your stop loss is <= 0.5 ADR%, therefore if you buy here, the risk is probably tight enough)
__________________________________________________________________________________
The Shares is a useful tool if you want to know exactly how many shares you should buy at the breakout moment. To use this tool, you first need to input two information in the indicator setting panel: the account size ($) and portfolio risk (%).
Account Size ($) means the dollar value in your total account.
Portfolio Risk (%) means how much risk you are willing to take per trade.
(e.g. a 1% portfolio risk in a 5000$ account is 50$, which is the risk you will take per trade)
After you provide these two inputs, the indicator will help you calculate how many shares you should buy based on the calculated Dollar Risk ($), real-time market price, and the low of the day price.
(e.g. Dollar Risk (50$), real-time market price (100$), Lod price (95$) -> then you will need to buy 50/(100-95) = 10 shares to meet your demand, so it will display as Shares { 10 } )
In addition, I also introduce a mechanism that helps you avoid buying too big of a position relative to your overall account . I set the limit to 25%, which means you don't put more than 25% of your account money into a single trade, which helps prevent single stock risk.
By introducing this mechanism, it will supervise if the suggested Shares to buy exceed max position limit (25%). If it actually exceeds, instead of using Dollar Risk ($) to calculate Shares, it will use position limit to calculate and display the max Shares you should buy.
__________________________________________________________________________________
That's it. Hope you find this explanation helpful when you use this indicator. Have a great day mate:)

ATR Regime Filter (ATR14 vs SMA20)ATR volatility + ATR SMA
Green ATR above Red SMA + green background
→ Volatility expanding
→ Trend mode only
Green ATR below Red SMA + blue background
→ Volatility compressing
→ Mean reversion allowed
Crossovers / flickering
→ Transition
→ Size down or stay flat


takeshi_2Step_Screener_MOU_KAKU_FIXED3//@version=5
indicator("MNO_2Step_Screener_MOU_KAKU_FIXED3", overlay=true, max_labels_count=500)
// =========================
// Inputs
// =========================
emaSLen = input.int(5, "EMA Short (5)")
emaMLen = input.int(13, "EMA Mid (13)")
emaLLen = input.int(26, "EMA Long (26)")
macdFast = input.int(12, "MACD Fast")
macdSlow = input.int(26, "MACD Slow")
macdSignal = input.int(9, "MACD Signal")
macdZeroTh = input.float(0.2, "MOU: MACD near-zero threshold", step=0.05)
volLookback = input.int(5, "Volume MA days", minval=1)
volMinRatio = input.float(1.3, "MOU: Volume ratio min", step=0.1)
volStrong = input.float(1.5, "Strong volume ratio (Breakout/KAKU)", step=0.1)
volMaxRatio = input.float(3.0, "Volume ratio max (filter)", step=0.1)
wickBodyMult = input.float(2.0, "Pinbar: lowerWick >= body*x", step=0.1)
pivotLen = input.int(20, "Resistance lookback", minval=5)
pullMinPct = input.float(5.0, "Pullback min (%)", step=0.1)
pullMaxPct = input.float(15.0, "Pullback max (%)", step=0.1)
breakLookbackBars = input.int(5, "Pullback route: valid bars after break", minval=1)
// --- Breakout route (押し目なし初動ブレイク) ---
useBreakoutRoute = input.bool(true, "Enable MOU Breakout Route (no pullback)")
breakConfirmPct = input.float(0.3, "Break confirm: close > R*(1+%)", step=0.1)
bigBodyLookback = input.int(20, "Break candle body MA length", minval=5)
bigBodyMult = input.float(1.2, "Break candle: body >= MA*mult", step=0.1)
requireCloseNearHigh = input.bool(true, "Break candle: close near high")
closeNearHighPct = input.float(25.0, "Close near high threshold (% of range)", step=1.0)
allowMACDAboveZeroInstead = input.bool(true, "Breakout route: allow MACD GC above zero instead")
// 表示
showEMA = input.bool(true, "Plot EMAs")
showMou = input.bool(true, "Show MOU label")
showKaku = input.bool(true, "Show KAKU label")
showDebugTbl = input.bool(false, "Show debug table (last bar)")
locChoice = input.string("Below Bar", "Label location", options= )
lblLoc = locChoice == "Below Bar" ? location.belowbar : location.abovebar
// =========================
// EMA
// =========================
emaS = ta.ema(close, emaSLen)
emaM = ta.ema(close, emaMLen)
emaL = ta.ema(close, emaLLen)
// plot は if の中に入れない(naで制御)
plot(showEMA ? emaS : na, color=color.new(color.yellow, 0), title="EMA 5")
plot(showEMA ? emaM : na, color=color.new(color.blue, 0), title="EMA 13")
plot(showEMA ? emaL : na, color=color.new(color.orange, 0), title="EMA 26")
emaUpS = emaS > emaS
emaUpM = emaM > emaM
emaUpL = emaL > emaL
goldenOrder = emaS > emaM and emaM > emaL
above26_2days = close > emaL and close > emaL
// 勝率維持の土台(緩めない)
baseTrendOK = (emaUpS and emaUpM and emaUpL) and goldenOrder and above26_2days
// =========================
// MACD
// =========================
= ta.macd(close, macdFast, macdSlow, macdSignal)
macdGC = ta.crossover(macdLine, macdSig)
macdUp = macdLine > macdLine
macdNearZero = math.abs(macdLine) <= macdZeroTh
macdGCAboveZero = macdGC and macdLine > 0 and macdSig > 0
macdMouOK = macdGC and macdNearZero and macdUp
macdBreakOK = allowMACDAboveZeroInstead ? (macdMouOK or macdGCAboveZero) : macdMouOK
// =========================
// Volume
// =========================
volMA = ta.sma(volume, volLookback)
volRatio = volMA > 0 ? (volume / volMA) : na
volumeMouOK = volRatio >= volMinRatio and volRatio <= volMaxRatio
volumeStrongOK = volRatio >= volStrong and volRatio <= volMaxRatio
// =========================
// Candle patterns
// =========================
body = math.abs(close - open)
upperWick = high - math.max(open, close)
lowerWick = math.min(open, close) - low
pinbar = (lowerWick >= wickBodyMult * body) and (lowerWick > upperWick) and (close >= open)
bullEngulf =
close > open and close < open and
close >= open and open <= close
bigBull =
close > open and
open < emaM and close > emaS and
(body > ta.sma(body, 20))
candleOK = pinbar or bullEngulf or bigBull
// =========================
// Resistance / Pullback route
// =========================
res = ta.highest(high, pivotLen)
pullbackPct = res > 0 ? (res - close) / res * 100.0 : na
pullbackOK = pullbackPct >= pullMinPct and pullbackPct <= pullMaxPct
brokeRes = ta.crossover(close, res )
barsSinceBreak = ta.barssince(brokeRes)
afterBreakZone = (barsSinceBreak >= 0) and (barsSinceBreak <= breakLookbackBars)
pullbackRouteOK = afterBreakZone and pullbackOK
// =========================
// Breakout route (押し目なし初動ブレイク)
// =========================
breakConfirm = close > res * (1.0 + breakConfirmPct / 100.0)
bullBreak = close > open
bodyMA = ta.sma(body, bigBodyLookback)
bigBodyOK = bodyMA > 0 ? (body >= bodyMA * bigBodyMult) : false
rng = math.max(high - low, syminfo.mintick)
closeNearHighOK = not requireCloseNearHigh ? true : ((high - close) / rng * 100.0 <= closeNearHighPct)
mou_breakout =
useBreakoutRoute and
baseTrendOK and
breakConfirm and
bullBreak and
bigBodyOK and
closeNearHighOK and
volumeStrongOK and
macdBreakOK
mou_pullback = baseTrendOK and volumeMouOK and candleOK and macdMouOK and pullbackRouteOK
mou = mou_pullback or mou_breakout
// =========================
// KAKU (Strict): 8条件 + 最終三点
// =========================
cond1 = emaUpS and emaUpM and emaUpL
cond2 = goldenOrder
cond3 = above26_2days
cond4 = macdGCAboveZero
cond5 = volumeMouOK
cond6 = candleOK
cond7 = pullbackOK
cond8 = pullbackRouteOK
all8_strict = cond1 and cond2 and cond3 and cond4 and cond5 and cond6 and cond7 and cond8
final3 = pinbar and macdGCAboveZero and volumeStrongOK
kaku = all8_strict and final3
// =========================
// Display (統一ラベル)
// =========================
showKakuNow = showKaku and kaku
showMouPull = showMou and mou_pullback and not kaku
showMouBrk = showMou and mou_breakout and not kaku
plotshape(showMouPull, title="MOU_PULLBACK", style=shape.labelup, text="猛",
color=color.new(color.lime, 0), textcolor=color.black, location=lblLoc, size=size.tiny)
plotshape(showMouBrk, title="MOU_BREAKOUT", style=shape.labelup, text="猛B",
color=color.new(color.lime, 0), textcolor=color.black, location=lblLoc, size=size.tiny)
plotshape(showKakuNow, title="KAKU", style=shape.labelup, text="確",
color=color.new(color.yellow, 0), textcolor=color.black, location=lblLoc, size=size.small)
// =========================
// Alerts
// =========================
alertcondition(mou, title="MNO_MOU", message="MNO: MOU triggered")
alertcondition(mou_breakout, title="MNO_MOU_BREAKOUT", message="MNO: MOU Breakout triggered")
alertcondition(mou_pullback, title="MNO_MOU_PULLBACK", message="MNO: MOU Pullback triggered")
alertcondition(kaku, title="MNO_KAKU", message="MNO: KAKU triggered")
// =========================
// Debug table (optional)
// =========================
var table t = table.new(position.top_right, 2, 14, border_width=1, border_color=color.new(color.white, 60))
fRow(_name, _cond, _r) =>
bg = _cond ? color.new(color.lime, 70) : color.new(color.red, 80)
tx = _cond ? "OK" : "NO"
table.cell(t, 0, _r, _name, text_color=color.white, bgcolor=color.new(color.black, 0))
table.cell(t, 1, _r, tx, text_color=color.white, bgcolor=bg)
if showDebugTbl and barstate.islast
// ❗ colspanは使えないので2セルでヘッダーを作る
table.cell(t, 0, 0, "MNO Debug", text_color=color.white, bgcolor=color.new(color.black, 0))
table.cell(t, 1, 0, "", text_color=color.white, bgcolor=color.new(color.black, 0))
fRow("BaseTrend", baseTrendOK, 1)
fRow("MOU Pullback", mou_pullback, 2)
fRow("MOU Breakout", mou_breakout, 3)
fRow("Break confirm", breakConfirm, 4)
fRow("Break big body", bigBodyOK, 5)
fRow("Break close high", closeNearHighOK, 6)
fRow("Break vol strong", volumeStrongOK, 7)
fRow("Break MACD", macdBreakOK, 8)
fRow("KAKU all8", all8_strict, 9)
fRow("KAKU final3", final3, 10)
fRow("MOU any", mou, 11)
fRow("KAKU", kaku, 12)

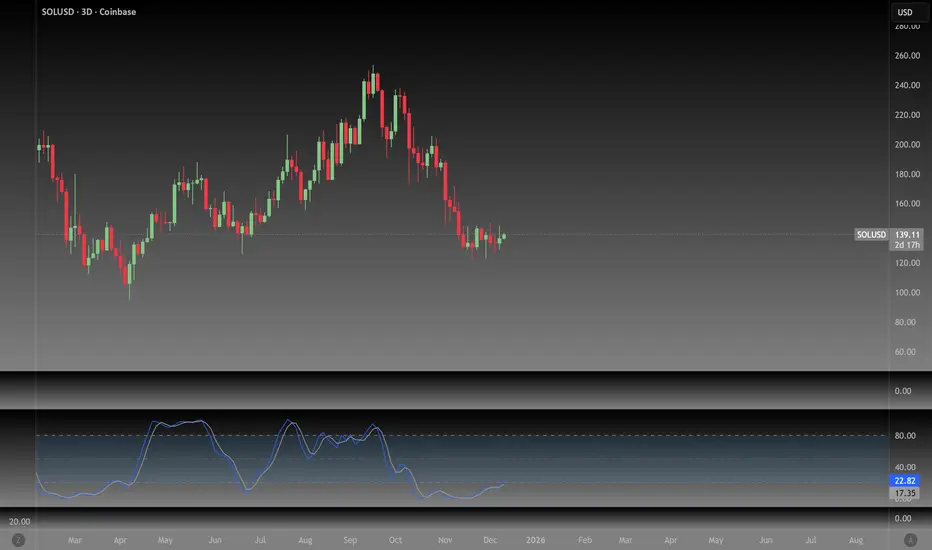
NeoChartLabs Stochastic RSIOne of our Favorite Indicators - The NeoChart Labs Stochastic RSI
Slowed down and smoothed out to hide the jerky movements of the crypto market.
StochRSI measures where the current RSI value sits relative to its recent high and low range. This provides more frequent signals and is designed to address the issue of the standard RSI remaining at extreme levels for too long. Best when used with 80 / 20
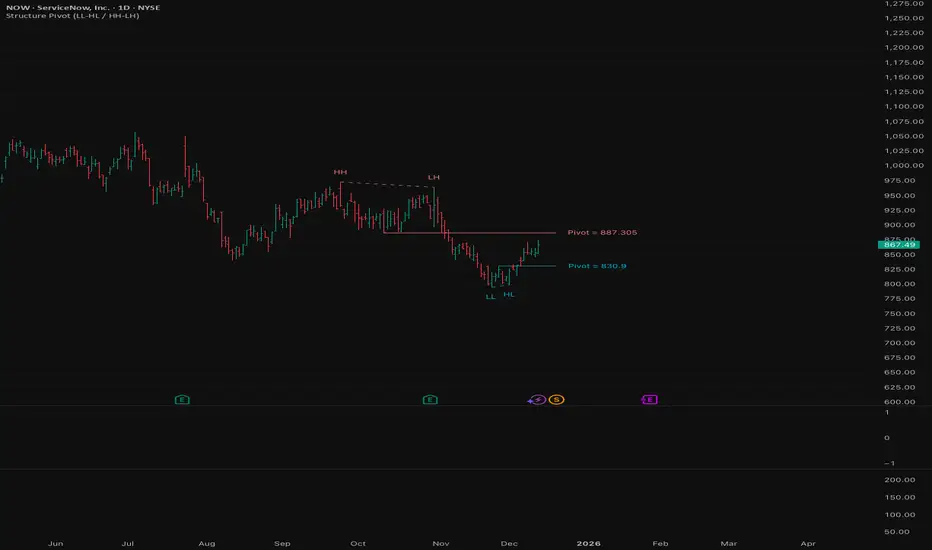
Structure Pivot (LL-HL / HH-LH)Structure Pivot (LL-HL / HH-LH) - Indicator Guide
This indicator scans for market structure pivot patterns—specifically the bullish Higher Low (LL–HL) and the bearish Lower High (HH–LH) —across multiple lengths simultaneously.
It automatically selects the most optimal pattern based on a "Priority Mode" and plots the structure and breakout/breakdown levels on the chart.
1. Basic Calculation Method
The indicator builds upon TradingView’s ta.pivotlow and ta.pivothigh functions to identify structural points.
Bullish Structure (LL–HL)
1.LL (Lowest Low): A standard Pivot Low is identified.
2.HL (Higher Low): A subsequent Pivot Low forms higher than the previous LL. This completes the setup.
3.Pivot Line (Resistance): The indicator finds the highest price (High) that occurred between the LL and the HL. This level becomes the breakout trigger.
Bearish Structure (HH–LH)
1.HH (Highest High): A standard Pivot High is identified.
2.LH (Lower High): A subsequent Pivot High forms lower than the previous HH. This completes the setup.
3.Pivot Line (Support): The indicator finds the lowest price (Low) that occurred between the HH and the LH. This level becomes the breakdown trigger.
2. Multi-Length Scanning
Unlike standard indicators that use a single fixed length (e.g., Length = 5), this indicator scans a range of lengths simultaneously.
・Settings: Defined by Min Length and Max Length.
・Mechanism: If set to Min=2 and Max=10, the indicator internally runs 9 separate calculations (Length 2 through 10) in parallel.
This allows it to capture everything from small, short-term pullbacks to larger, significant structural pivots without manual adjustment.
3. Priority Mode System
Since multiple lengths are scanned, multiple valid patterns may appear at the same time. The Priority Mode determines which single pattern is the "winner" and gets displayed.
A. Tightest Structure (Default)
・For Bullish (Long): Selects the pattern with the lowest Pivot Line (Resistance).
・For Bearish (Short): Selects the pattern with the highest Pivot Line (Support).
・Advantage: It finds the "tightest" contraction (like a VCP). This offers the entry point closest to the stop-loss level, providing the best Risk/Reward ratio.
B. Longest Length
・Selects the pattern detected by the longest length setting.
・Advantage: Focuses on major structural points, filtering out short-term noise. Best for trend confirmation.
C. Shortest Length
・Selects the pattern detected by the shortest length setting.
・Advantage: Extremely sensitive. Best for scalping or catching immediate micro-pullbacks.
4. Real-Time Logic & Features
Structure Invalidation (Failure)
・Bullish: If the current price drops below the HL (the support of the structure), the setup is considered failed.
・Bearish: If the current price rises above the LH (the resistance of the structure), the setup is considered failed.
・Result: All lines and labels for that structure are immediately deleted to keep the chart clean.
Pivot Line Extension
・As long as the structure remains valid (price hasn't violated the HL or LH), the Pivot Line extends to the right, acting as a live reference for breakouts or breakdowns.
Alerts
・Bullish Breakout: Triggered when the Close price crosses over the Pivot Line.
・Bearish Breakdown: Triggered when the Close price crosses under the Pivot Line.
NeoChartLabs POCOne of our Favorite Indicators - the High Time Frame Point of Control with a Volume Profile.
Shout out to p2pasta for the original script, we updated to v6.
Currently included: Monthly, 3 months and 6 months.
/* DEFINITION */
Point Of Control (= POC) is a price level at which the heaviest volumes were traded.
Value Area High/Low (=VAH/VAL) is a range of prices where the majority of trading volume took place. Naturally, Value Area High being the top price level and Value Area Low being the lowest. POC always is between the two.
/* HOW TO TRADE WITH THIS INDICATOR */
The basis for POC is determining bias on whichever timeframe you choose.
1. Identify a POC on the timeframe of your choosing.
/* If you choose a "low" timeframe (monthly here) then make sure to look at the higher timeframes to see how it is playing against a higher timeframe POC.
2. When the price is moving away from the POC (either to the upside or downside) this will confirm or invalidate the trade.
3. You can now enter the trade on bias or wait for a retest of the same POC.

NeoChartLabs McGinley DynamicOne of our Favorite Indicators - the McGinley Dynamic
The MGD is adaptive, it speeds up for crypto and slows down for stocks, this version turns green when bullish and red when bearish - this is a fast indicator so the colors are more reliable on higher time frames.
The McGinley Dynamic is a smart, adaptive moving average technical indicator created by John R. McGinley, designed to overcome the lag and whipsaw issues of traditional moving averages (MAs) by automatically adjusting to varying market speeds, resulting in a smoother, more responsive line that tracks price action better, acting as a reliable trend-following tool or baseline in financial charts.
Shout out to LOXX for the original script, updated to v6.

RSI Dip Reversal Pro ScannerRSI Upside Reversal Scanner (High Accuracy)
This indicator is designed to detect early-stage upside reversals by identifying when RSI crosses upward from oversold levels while the price remains positioned in the lower portion of its recent range. It combines momentum shift with price location analysis to produce highly reliable reversal signals.
It uses 3 primary filters:
RSI Oversold Cross:
RSI must cross upward from the oversold threshold (default 30).
Price in Bottom Range:
Price must be located within the lower 40% of the last 20-bar range, indicating a discount zone.
Overbought Protection:
RSI must stay below the ceiling level (default 75) to prevent signals near top exhaustion.
When all criteria are met, the indicator plots a “GİRİŞ” (ENTRY) label below the candle.
This tool is ideal for:
Identifying accurate dip-buy zones
Capturing trend reversals early
Optimizing swing and scalp entries
Feeding systematic trading models or bots
It performs well on short- and mid-term timeframes.

NeoChartLabs EMAsOne of our Favorite Indicators - the NeoChart Labs 20/50/100/200 EMAs
20 = Blue and very thin
50 = Orange and thin
100 = Purple and thick
200 = White and very thick
When 20 Crosses above and below any other expect action.
50 crossing 200 on the 1D is the death cross.
Shout out to drsweets for the original script

Sayed Official SniperSniper and Trading best swing of the year no body knows i get it premium to share with you guyz
indicator("MouNoOkite_InitialMove_Screener", overlay=true)//@version=5
indicator("猛の掟・初動スクリーナー(5EMA×MACD×出来高×ローソク)", overlay=true, max_labels_count=500)
// =========================
// Inputs
// =========================
emaSLen = input.int(5, "EMA Short (5)")
emaMLen = input.int(13, "EMA Mid (13)")
emaLLen = input.int(26, "EMA Long (26)")
macdFast = input.int(12, "MACD Fast")
macdSlow = input.int(26, "MACD Slow")
macdSignal = input.int(9, "MACD Signal")
volLookback = input.int(5, "出来高平均(日数)", minval=1)
volMinRatio = input.float(1.3, "出来高倍率(初動点灯)", step=0.1)
volStrong = input.float(1.5, "出来高倍率(本物初動)", step=0.1)
volMaxRatio = input.float(2.0, "出来高倍率(上限目安)", step=0.1)
wickBodyMult = input.float(2.0, "ピンバー判定: 下ヒゲ >= (実体×倍率)", step=0.1)
pivotLen = input.int(20, "直近高値/レジスタンス判定のLookback", minval=5)
pullMinPct = input.float(5.0, "押し目最小(%)", step=0.1)
pullMaxPct = input.float(15.0, "押し目最大(%)", step=0.1)
showDebug = input.bool(true, "デバッグ表示(条件チェック)")
// =========================
// EMA
// =========================
emaS = ta.ema(close, emaSLen)
emaM = ta.ema(close, emaMLen)
emaL = ta.ema(close, emaLLen)
plot(emaS, color=color.new(color.yellow, 0), title="EMA 5")
plot(emaM, color=color.new(color.blue, 0), title="EMA 13")
plot(emaL, color=color.new(color.orange, 0), title="EMA 26")
emaUpS = emaS > emaS
emaUpM = emaM > emaM
emaUpL = emaL > emaL
// 26EMA上に2日定着
above26_2days = close > emaL and close > emaL
// 黄金隊列
goldenOrder = emaS > emaM and emaM > emaL
// =========================
// MACD
// =========================
= ta.macd(close, macdFast, macdSlow, macdSignal)
// ヒストグラム縮小(マイナス圏で上向きの準備)も見たい場合の例
histShrinking = math.abs(macdHist) < math.abs(macdHist )
histUp = macdHist > macdHist
// ゼロライン上でGC(最終シグナル)
macdGCAboveZero = ta.crossover(macdLine, macdSig) and macdLine > 0 and macdSig > 0
// 参考:ゼロ直下で上昇方向(勢い準備)
macdRisingNearZero = (macdLine < 0) and (macdLine > macdLine ) and (math.abs(macdLine) <= math.abs(0.5))
// =========================
// Volume
// =========================
volMA = ta.sma(volume, volLookback)
volRatio = volMA > 0 ? (volume / volMA) : na
volumeOK = volRatio >= volMinRatio and volRatio <= volMaxRatio
volumeStrongOK = volRatio >= volStrong
// =========================
// Candle patterns
// =========================
body = math.abs(close - open)
upperWick = high - math.max(open, close)
lowerWick = math.min(open, close) - low
// 長い下ヒゲ(ピンバー系): 実体が小さく、下ヒゲが優位
pinbar = (lowerWick >= wickBodyMult * body) and (lowerWick > upperWick) and (close >= open)
// 陽線包み足(前日陰線を包む)
bullEngulf =
close > open and close < open and
close >= open and open <= close
// 5EMA・13EMA を貫く大陽線(勢い)
bigBull =
close > open and
open < emaM and close > emaS and
(body > ta.sma(body, 20)) // “相対的に大きい”目安
candleOK = pinbar or bullEngulf or bigBull
// =========================
// 押し目 (-5%〜-15%) & レジブレ後
// =========================
recentHigh = ta.highest(high, pivotLen)
pullbackPct = recentHigh > 0 ? (recentHigh - close) / recentHigh * 100.0 : na
pullbackOK = pullbackPct >= pullMinPct and pullbackPct <= pullMaxPct
// “レジスタンスブレイク”簡易定義:直近pivotLen高値を一度上抜いている
// → その後に押し目位置にいる(現在が押し目)
brokeResistance = ta.crossover(close, recentHigh ) or (close > recentHigh )
afterBreakPull = brokeResistance or brokeResistance or brokeResistance or brokeResistance or brokeResistance
breakThenPullOK = afterBreakPull and pullbackOK
// =========================
// 最終三点シグナル(ヒゲ × 出来高 × MACD)
// =========================
final3 = pinbar and macdGCAboveZero and volumeStrongOK
// =========================
// 猛の掟 8条件チェック(1つでも欠けたら「見送り」)
// =========================
// 1) 5EMA↑ 13EMA↑ 26EMA↑
cond1 = emaUpS and emaUpM and emaUpL
// 2) 5>13>26 黄金隊列
cond2 = goldenOrder
// 3) ローソク足が26EMA上に2日定着
cond3 = above26_2days
// 4) MACD(12,26,9) ゼロライン上でGC
cond4 = macdGCAboveZero
// 5) 出来高が直近5日平均の1.3〜2.0倍
cond5 = volumeOK
// 6) ピンバー or 包み足 or 大陽線
cond6 = candleOK
// 7) 押し目 -5〜15%
cond7 = pullbackOK
// 8) レジスタンスブレイク後の押し目
cond8 = breakThenPullOK
all8 = cond1 and cond2 and cond3 and cond4 and cond5 and cond6 and cond7 and cond8
// =========================
// 判定(2択のみ)
// =========================
isBuy = all8 and final3
decision = isBuy ? "買い" : "見送り"
// =========================
// 表示
// =========================
plotshape(isBuy, title="BUY", style=shape.labelup, text="買い", color=color.new(color.lime, 0), textcolor=color.black, location=location.belowbar, size=size.small)
plotshape((not isBuy) and all8, title="ALL8_OK_but_noFinal3", style=shape.labelup, text="8条件OK (最終3未)", color=color.new(color.yellow, 0), textcolor=color.black, location=location.belowbar, size=size.tiny)
// デバッグ(8項目チェック結果)
if showDebug and barstate.islast
var label dbg = na
label.delete(dbg)
txt =
"【8項目チェック】 " +
"1 EMA全上向き: " + (cond1 ? "達成" : "未達") + " " +
"2 黄金隊列: " + (cond2 ? "達成" : "未達") + " " +
"3 26EMA上2日: " + (cond3 ? "達成" : "未達") + " " +
"4 MACDゼロ上GC: " + (cond4 ? "達成" : "未達") + " " +
"5 出来高1.3-2.0: "+ (cond5 ? "達成" : "未達") + " " +
"6 ローソク条件: " + (cond6 ? "達成" : "未達") + " " +
"7 押し目5-15%: " + (cond7 ? "達成" : "未達") + " " +
"8 ブレイク後押し目: " + (cond8 ? "達成" : "未達") + " " +
"最終三点(ヒゲ×出来高×MACD): " + (final3 ? "成立" : "未成立") + " " +
"判定: " + decision
dbg := label.new(bar_index, high, txt, style=label.style_label_left, textcolor=color.white, color=color.new(color.black, 0))
// アラート
alertcondition(isBuy, title="猛の掟 BUY", message="猛の掟: 買いシグナル(8条件+最終三点)")

ORB + FVG + PDH/PDL ORB + FVG + PDH/PDL is an all-in-one day-trading overlay that plots:
Opening Range (ORB) high/low with optional box and extension
Fair Value Gaps (FVG) with optional “unmitigated” levels + mitigation lines
Previous Day High/Low history (PDH/PDL) drawn as one-day segments (yesterday’s levels plotted across today’s session only)
Includes presets (ORB only / FVG only / Both) and optional alerts for ORB touches, ORB break + retest, FVG entry, and PDH/PDL touches.
