Intraday Buy/Sell/Average Zones by Chaitu50cIntraday Buy/Sell/Average Zones by chaitu50c
Timeframe:
Tested on the 5-minute chart.
Recommended timeframe: 5-minute
What it does
This indicator marks intraday Buy (green) and Sell (red) zones made by strong close-confirmed breakouts. These zones act as support/resistance. If price later closes through a zone, the zone changes color from that bar forward (support ↔ resistance). It can flip more than once.
How zones form
Single breakout: an opposite-type candle closes beyond the previous candle’s high/low.
Double breakout: a base candle, then two opposite-type candles, and the second one closes beyond the base high/low.
Zone size
Buy zone: from the combo lowest low up to the nearest open/close of the combo.
Sell zone: from the combo highest high down to the nearest open/close of the combo.
Color shift (optional)
If price closes through a zone, it flips color at that bar and behaves as the other side (support ↔ resistance). Flips can happen again later.
Overlap control
When a new zone overlaps an existing same-color zone in the same session, choose:
Merge (combine), or
Suppress (ignore the new one).
Flipped zones use their current color for this.
Right edge & session
All zones extend to the right (your offset). Detection is limited to your chosen session, and you can show only the last N sessions.
---
How to trade (simple)
A) Initial breakout trade
When a new zone forms, that breakout itself can be a trade idea in the breakout direction, The stoploss will be the zone.
B) Zone breakout trade (flip)
If price later closes out of a zone and it changes color, that breakout is another trade opportunity in the new direction.
C) Retrace & average trade
When price retests a zone, wait for a confirmation candle in the zone’s favor
— bullish close for a green zone, bearish close for a red zone — then average entries inside/near the zone.
Place stops just beyond the opposite edge of the zone.
If the zone flips color, stop averaging; bias changed.
---
Key settings
Breakout type: Single and/or Double
Confirm on Close: strict mode (no intrabar preview) or allow intrabar preview that auto-removes if fail
Color Shift on Breaks: on/off
Same-Type Overlap: Merge/Suppress
Session, Sessions to Display, Right Offset, Colors, Max Zones
Reminder: Best results on the 5-minute timeframe (tested and recommended).
Индикаторы и стратегии

Heikin-Ashi-Candles MTFHeikin-Ashi Higher Timeframe Candles
This indicator overlays higher-timeframe Heikin-Ashi candles (default: 5 minutes) onto a lower-timeframe chart (e.g., 1 minute). Instead of using standard candlesticks, it draws:
Semi-transparent rectangles to represent the candle bodies.
Vertical lines to represent wicks, centered on each body.
Key features:
Dynamic transparency: The current, still-forming higher-timeframe candle is plotted in green or red (depending on trend) with a separate, lighter transparency (default: 30) so you can easily distinguish it from completed candles.
Finalization on close: As soon as a higher-timeframe candle closes, its body and wicks update to the standard transparency level (default: 50), ensuring completed candles are visually distinct.
Customizable inputs: You can adjust
The higher timeframe (tf) for Heikin-Ashi calculations.
Body transparency for confirmed candles.
Transparency for unfinished candles.
Wick thickness.
Use case:
This is particularly useful for traders who analyze price action on lower timeframes but want to stay aware of the higher-timeframe Heikin-Ashi trend without switching charts. The fading effect on the active candle helps prevent confusion between fully formed candles and those still developing.

Multipower Entry SecretMultipower Entry Secret indicator is designed to be the ultimate trading companion for traders of all skill levels—especially those who struggle with decision-making due to unclear or overwhelming signals. Unlike conventional trading systems cluttered with too many lines and confusing alerts, this indicator provides a clear, adaptive, and actionable guide for market entries and exits.
Key Points:
Clear Buy/Sell/Wait Signals:
The script dynamically analyzes price action, candle patterns, volume, trend strength, and higher time frame context. This means it gives you “Buy,” “Sell,” or “Wait” signals based on real, meaningful market information—filtering out the noise and weak trades.
Multi-Timeframe Adaptive Analysis:
It synchronizes signals between higher and current timeframes, ensuring you get the most reliable direction—reducing the risk of getting caught in fake moves or sudden reversals.
Automatic Support, Resistance & Liquidity Zones:
Key levels like support, resistance, and liquidity zones are auto-detected and displayed directly on the chart, helping you make precise decisions without manual drawing.
Real-Time Dashboard:
All relevant information, such as trend strength, market intent, volume sentiment, and the reason behind each signal, is neatly summarized in a dashboard—making monitoring effortless and intuitive.
Customizable & Beginner-Friendly:
Whether you’re a newcomer wanting straightforward guidance or a professional needing advanced customization, the indicator offers flexible options to adjust analysis depth, timeframes, sensitivity, and more.
Visual & Clutter-Free:
The design ensures that your chart remains clean and readable, showing only the most important information. This minimizes mental overload and allows for instant decision-making.
Who Will Benefit?
Beginners who want to learn trading logic, avoid common traps, and see the exact reason behind every signal.
Advanced traders who require adaptive multi-timeframe analytics, fast execution, and stress-free monitoring.
Anyone who wants to save screen time, reduce analysis paralysis, and have more confidence in every trade they take.
1. No Indicator Clutter
Intent:
Many traders get confused by charts filled with too many indicators and signals. This often leads to hesitation, missed trades, or taking random, risky trades.
In this Indicator:
You get a clean and clutter-free chart. Only the most important buy/sell/wait signals and relevant support/resistance/liquidity levels are shown. These update automatically, removing the “overload” and keeping your focus sharp, so your decision-making is faster and stress-free.
2. Exact Entry Guide
Intent:
Traders often struggle with entry timing, leading to FOMO (fear of missing out) or getting trapped in sudden market reversals.
In this Indicator:
The system uses powerful adaptive logic to filter out weak signals and only highlight the strongest market moves. This not only prevents you from entering late or on noise, but also helps avoid losses from false breakouts or whipsaws. You get actionable suggestions—when to enter, when to hold back—so your entries are high-conviction and disciplined.
3. HTF+LTF Logic: Multitimeframe Sync Analysis
Intent:
Most losing trades happen when you act only on the short-term chart, ignoring the bigger market trend.
In this Indicator:
Signals are based on both the current chart timeframe (LTF) and a higher (HTF, like hourly/daily) timeframe. The indicator synchronizes trend direction, momentum, and structure across both levels, quickly adapting to show you when both are aligned. This filtering results in “only trade with the bigger trend”—dramatically increasing your win rate and market confidence.
4. Auto Support/Resistance & Liquidity Zones
Intent:
Drawing support/resistance and liquidity zones manually is time-consuming and error-prone, especially for beginners.
In this Indicator:
The system automatically identifies and plots the most crucial support/resistance levels and liquidity zones on your chart. This is based on adaptive, real-time price and volume analysis. These zones highlight where major institutional activity, trap setups, or real breakouts/reversals are most likely, removing guesswork and giving you a clear reference for entries, exits, and stop placements.
5. Clear Action/Direction
Intent:
Traders need certainty—what does the market want right now? Most indicators are vague.
In this Indicator:
Your dashboard always displays in plain words (like “BUY”, “SELL”, or “WAIT”) what action makes sense in the current market phase. Whether it’s a bull trap, volume spike, wick reversal, or exhaustion—it’s interpreted and explained clearly. No more confusion—just direct, real-time advice.
6. For Everyone (Beginner to Pro)
Intent:
Most advanced indicators are overwhelming for new traders; simple ones lack depth for professionals.
In this Indicator:
It is simple enough for a beginner—just add it to the chart and instantly see what action to consider. At the same time, it includes advanced adaptive analysis, multi-timeframe logic, and customizable settings so professional traders can fine-tune it for their strategies.
7. Ideal Usage and User Benefits
Instant Decision Support:
Whenever you’re unsure about a trade, just look at the indicator’s suggestion for clarity.
Entry Learning:
Beginners get real-time “practice” by not only seeing signals, but also the reason behind them—improving your chart reading and market understanding.
Screen Time & Stress Reduction:
Clear, relevant information only; no noise, less fatigue, faster decisions.
Makes Trading Confident & Simple:
The smart dashboard splits actionable levels (HTF, LTF, action) so you never miss a move, avoid traps, and stay aligned with high-probability trades.
8. Advanced Input Settings (Smart Customization)
Explained with Examples:
Enable Wick Analysis:
Finds candles with strong upper/lower wicks (signs of rejection/buying/selling force), alerting you to hidden reversals and protecting from FOMO entries.
Enable Absorption:
Detects when heavy order flow from one side is “absorbed” by the other (shows where institutional buyers/sellers are likely active, helps spot fake breakouts).
Enable Unusual Breakout:
Highlights real breakouts—large volatility plus high volume—so you catch genuine moves and avoid random spikes.
Enable Range/Expansion:
Smartly flags sudden range expansions—when the market goes from quiet to volatile—so you can act at the start of real trends.
Trend Bar Lookback:
Adjusts how many bars/candles are used in trend calculations. Short (fast trades, more signals), long (more reliability, fewer whipsaws).
Bull/Bear Bars for Strong Trend Min:
Sets how many candles in a row must support a trend before calling it “strong”—prevents flipping signals, keeps you disciplined.
Volume MA Length:
Lets you adjust how many bars back volume is averaged—fine-tune for your asset and trading style for best volume signals.
Swing Lookback Bars:
Set how many bars to use for swing high/low detection—short (quick swing levels), long (stronger support/resistance).
HTF (Bias Window):
Decide which higher timeframe the indicator should use for big-picture market mood. Adjustable for any style (scalp, swing, position).
Adaptive Lookback (HTF):
Choose how much HTF history is used for detecting major extremes/zones. Quick adjust for more/less sensitivity.
Show Support/Resistance, Liquidity Zones, Trendlines:
Toggle them on/off instantly per your needs—keeps your chart relevant and tailored.
9. Live Dashboard Sections Explained
Intent HTF:
Shows if the bigger timeframe currently has a Bullish, Bearish, or Neutral (“Chop”) intent, based on strict volume/price body calculations. Instant clarity—no more guessing on trend bias.
HTF Bias:
Clear message about which side (buy/sell/sideways) controls the market on the higher timeframe, so you always trade with the “big money.”
Chart Action:
The central action for the current bar—Whether to Buy, Sell, or Wait—calculated from all indicator logic, not just one rule.
TrendScore Long/Short:
See how many candles in your chosen window were bullish or bearish, at a glance. Instantly gauge market momentum.
Reason (WHY):
Every time a signal appears, the “reason” cell tells you the primary logic (breakout, wick, strong trend, etc.) behind it. Full transparency and learning—never trade blindly.
Strong Trend:
Shows if the market is currently in a powerful trend or not—helping you avoid choppy, risky entries.
HTF Vol/Body:
Displays current higher timeframe volume and candle body %—helping spot when big players are active for higher probability trades.
Volume Sentiment:
A real-time analysis of market psychology (strong bullish/bearish, neutral)—making your decision-making much more confident.
10. Smart and User-Friendly Design
Multi-timeframe Adaptive:
All calculations can now be drawn from your choice of higher or current timeframe, ensuring signals are filtered by larger market context.
Flexible Table Position:
You can set the live dashboard/summary anywhere on the chart for best visibility.
Refined Zone Visualization:
Liquidity and order blocks are visually highlighted, auto-tuning for your settings and always cleaning up to stay clutter-free.
Multi-Lingual & Beginner Accessible:
With Hindi and simple English support, descriptions and settings are accessible for a wide audience—anyone can start using powerful trading logic with zero language barrier.
Efficient Labels & Clear Reasoning:
Signal labels and reasons are shown/removed dynamically so your chart stays informative, not messy.
Every detail of this indicator is designed to make trading both simpler and smarter—helping you avoid the common pitfalls, learn real price action, stay in sync with the market’s true mood, and act with discipline for higher consistency and confidence.
This indicator makes professional-grade market analysis accessible to everyone. It’s your trusted assistant for making smarter, faster, and more profitable trading decisions—providing not just signals, but also the “why” behind every action. With auto-adaptive logic, clear visuals, and strong focus on real trading needs, it lets you focus on capturing the moves that matter—every single time.

Volume Spread Candle█ Overview
Volume Spread Candle is a Solid tool for VSA (Volume Spread Analysis).
█ Setting
please put on VSCandle above the candle chart.
█ Features
Candle color reflect volume size.
Back ground color reflect Spread size.
Warning Volume is relatively large volume compared to the Volume flow (up volume MA - down volume MA).
Yellow square mark appears when Warning volume.
Volume Density is Volume / Spread.
Yellow circle mark appears when large Volume Density.
█ Usage
Abnormal Volume and Spread hint what about to happen.

Mayfair FX Scalper V-10 Price Action + SMC//@version=5
indicator("Mayfair FX Scalper V-10 Price Action + SMC", overlay=true)
// === INPUTS ===
rsiLength = input.int(14, title="RSI Length")
overbought = input.float(73, title="SELL Level")
oversold = input.float(31, title="BUY Level")
rsiSrc = input.source(open, title="RSI Source")
// === Color Inputs ===
entryLineColor = input.color(color.white, title="entry Label Color")
entryLabelColor = input.color(color.white, title="entry Lable Color")
slLineColor = input.color(color.red, title="Stop Loss Line Color")
slLabelColor = input.color(color.red, title="Stop Loss Label Color")
tpLineColor = input.color(color.blue, title="Take Profit Line Color")
tpLabelColor = input.color(color.blue, title="Take Profit Color")
entryTextColor = input.color(color.rgb(0, 0, 0) , title="entry Text Color")
slTextColor = input.color(color.white, title="Stop Lose Color")
tpTextColor = input.color(color.white, title="Take Profit Text Color")
//indicator("Author Info Display"
// Create table
var table infoTable = table.new(position.top_right, 2, 6, bgcolor=color.new(#000000, 1), border_width=1)
if barstate.islast
table.cell(infoTable, 0, 0, "Author:", text_color=color.white, text_size=size.small)
table.cell(infoTable, 1, 0, "MR WOW", text_color=color.rgb(255, 251, 0), text_size=size.large)
table.cell(infoTable, 0, 1, "YouTube:", text_color=color.white, text_size=size.small)
table.cell(infoTable, 1, 1, "www.youtube.com/@iammrwow", text_color=color.rgb(255, 251, 0), text_size=size.small)
table.cell(infoTable, 0, 3, "Website:", text_color=color.white, text_size=size.small)
table.cell(infoTable, 1, 3, "www.mrwowea.com", text_color=color.rgb(255, 251, 0), text_size=size.small)
// === RSI CALCULATION ===
rsi = ta.rsi(rsiSrc, rsiLength)
rawBuySignal = rsi < oversold
rawSellSignal = rsi > overbought
// === Confirmed Signals ===
isBullish = close > open
isBearish = close < open
newBuy = rawBuySignal and isBullish and close > open == false
newSell = rawSellSignal and isBearish and close < open == false
// === Trade State Variables ===
var bool inPosition = false
var bool isBuy = false
var float entryPrice = na
var float slPrice = na
var float tp1Price = na
var float tp2Price = na
var float tp3Price = na
var int entryBarIndex = na
var label labels = array.new()
var line lines = array.new()
// === Instrument & Timeframe SL/TP Setup ===
isGold = str.contains(syminfo.ticker, "XAU") or str.contains(syminfo.ticker, "GOLD")
instrumentType = syminfo.type == "crypto" ? "Crypto" : isGold ? "Gold" : syminfo.currency == "JPY" ? "JPY" : "Forex"
tf = timeframe.period
slPipsGold = tf == "1" ? 30 : tf == "3" ? 45 : tf == "5" ? 50 : tf == "15" ? 60 : 70
slPipsCrypto = tf == "1" ? 5 : tf == "3" ? 8 : tf == "5" ? 12 : tf == "15" ? 15 : 10
slPipsForex = tf == "1" ? 6 : tf == "3" ? 9 : tf == "5" ? 11 : tf == "15" ? 15 : 15
gold_slDist = 0.1 * slPipsGold
gold_tp1Dist = gold_slDist
gold_tp2Dist = gold_slDist * 2
gold_tp3Dist = gold_slDist * 3
pipSize = instrumentType == "Crypto" ? 1.0 : instrumentType == "Gold" or instrumentType == "JPY" ? 0.01 : 0.0001
slPips = instrumentType == "Crypto" ? slPipsCrypto : instrumentType == "Gold" ? slPipsGold : slPipsForex
slDist = slPips * pipSize
tp1Dist = slDist
tp2Dist = slDist * 2
tp3Dist = slDist * 3
// === Draw Line & Label ===
drawLine(y, txt, col, lblCol, extendToCurrent) =>
int lineEnd = extendToCurrent ? bar_index : entryBarIndex + 2
array.push(lines, line.new(entryBarIndex, y, lineEnd, y, color=col, width=2, extend=extend.none))
textCol = str.contains(txt, "Entry") ? entryTextColor : str.contains(txt, "Stop") ? slTextColor : tpTextColor
array.push(labels, label.new(lineEnd, y, txt, style=label.style_label_left, color=color.new(lblCol, 0), textcolor=textCol, size=size.small))
// === Check Exit ===
slHit = inPosition and ((isBuy and low <= slPrice) or (not isBuy and high >= slPrice))
tp3Hit = inPosition and ((isBuy and high >= tp3Price) or (not isBuy and low <= tp3Price))
shouldExit = slHit or tp3Hit
if shouldExit
for l in labels
label.delete(l)
array.clear(labels)
for ln in lines
line.delete(ln)
array.clear(lines)
inPosition := false
entryPrice := na
slPrice := na
tp1Price := na
tp2Price := na
tp3Price := na
entryBarIndex := na
// === Confirmed Signal with No Position ===
confirmedBuy = not inPosition and newBuy
confirmedSell = not inPosition and newSell
// === Signal Markers ===
plotshape(series=confirmedBuy, location=location.belowbar, color=color.rgb(33, 150, 243), style=shape.triangleup, text="BUY", textcolor=color.rgb(33, 150, 243))
plotshape(series=confirmedSell, location=location.abovebar, color=color.rgb(254, 254, 255), style=shape.triangledown, text="SELL", textcolor=color.rgb(239, 238, 247))
// === Entry Execution ===
if confirmedBuy or confirmedSell
entryPrice := close
entryBarIndex := bar_index
isBuy := confirmedBuy
inPosition := true
if isGold
slPrice := isBuy ? entryPrice - gold_slDist : entryPrice + gold_slDist
tp1Price := isBuy ? entryPrice + gold_tp1Dist : entryPrice - gold_tp1Dist
tp2Price := isBuy ? entryPrice + gold_tp2Dist : entryPrice - gold_tp2Dist
tp3Price := isBuy ? entryPrice + gold_tp3Dist : entryPrice - gold_tp3Dist
else
slPrice := isBuy ? entryPrice - slDist : entryPrice + slDist
tp1Price := isBuy ? entryPrice + tp1Dist : entryPrice - tp1Dist
tp2Price := isBuy ? entryPrice + tp2Dist : entryPrice - tp2Dist
tp3Price := isBuy ? entryPrice + tp3Dist : entryPrice - tp3Dist
drawLine(entryPrice, "Entry Price - After Candle Above Entry Price Then Place Trade: " + str.tostring(entryPrice), entryLineColor, entryLabelColor, false)
drawLine(slPrice, "Stop Loss: " + str.tostring(slPrice), slLineColor, slLabelColor, false)
drawLine(tp1Price, "(1:1) Take Profit: " + str.tostring(tp1Price), tpLineColor, tpLabelColor, false)
drawLine(tp2Price, "(2:1) Take Profit: " + str.tostring(tp2Price), tpLineColor, tpLabelColor, false)
drawLine(tp3Price, "(3:1) Take Profit: " + str.tostring(tp3Price), tpLineColor, tpLabelColor, false)
// === Update TP/SL Lines if Still in Trade ===
if inPosition and not (confirmedBuy or confirmedSell)
for ln in lines
line.delete(ln)
array.clear(lines)
for l in labels
label.delete(l)
array.clear(labels)
drawLine(entryPrice, "After Candle Closed Above Entry Line Buy & Below Sell :Entry Price-" + str.tostring(entryPrice), entryLineColor, entryLabelColor, true)
drawLine(slPrice, "Stop Loss: " + str.tostring(slPrice), slLineColor, slLabelColor, true)
drawLine(tp1Price, "(1:1) Take Profit: " + str.tostring(tp1Price), tpLineColor, tpLabelColor, true)
drawLine(tp2Price, "(2:1) Take Profit: " + str.tostring(tp2Price), tpLineColor, tpLabelColor, true)
drawLine(tp3Price, "(3:1) Take Profit: " + str.tostring(tp3Price), tpLineColor, tpLabelColor, true)
// === Bollinger Bands Inputs ===
bb_length = input.int(20, title="SMA & StdDev Length")
src = input.source(close, title="Source")
// === Bollinger Band Colors ===
color_upper_2_3 = input.color(color.new(#0db107, 64), title="Upper Band 2–3 Color")
color_upper_3_4 = input.color(color.new(#05c41f, 58), title="Upper Band 3–4 Color")
color_lower_2_3 = input.color(color.new(#bdbc9d, 80), title="Lower Band 2–3 Color")
color_lower_3_4 = input.color(color.new(#e9e6bf, 63), title="Lower Band 3–4 Color")
// === Bollinger Band Calculations ===
sma = ta.sma(src, bb_length)
stdev = ta.stdev(src, bb_length)
bb2_upper = sma + 2 * stdev
bb2_lower = sma - 2 * stdev
bb3_upper = sma + 3 * stdev
bb3_lower = sma - 3 * stdev
bb4_upper = sma + 4 * stdev
bb4_lower = sma - 4 * stdev
// === Hidden Plots for Fill ===
p_bb2_upper = plot(bb2_upper, color=na)
p_bb3_upper = plot(bb3_upper, color=na)
p_bb4_upper = plot(bb4_upper, color=na)
p_bb2_lower = plot(bb2_lower, color=na)
p_bb3_lower = plot(bb3_lower, color=na)
p_bb4_lower = plot(bb4_lower, color=na)
// === Band Zone Fills ===
fill(p_bb2_upper, p_bb3_upper, color=color_upper_2_3)
fill(p_bb3_upper, p_bb4_upper, color=color_upper_3_4)
fill(p_bb2_lower, p_bb3_lower, color=color_lower_2_3)
fill(p_bb3_lower, p_bb4_lower, color=color_lower_3_4)
//SMc
BULLISH_LEG = 1
BEARISH_LEG = 0
BULLISH = +1
BEARISH = -1
GREEN = #9c9c9c
RED = #9c9c9c
BLUE = #9c9c9c
GRAY = #ffffff
MONO_BULLISH = #b2b5be
MONO_BEARISH = #5d606b
HISTORICAL = 'Historical'
PRESENT = 'Present'
COLORED = 'Colored'
MONOCHROME = 'Monochrome'
ALL = 'All'
BOS = 'BOS'
CHOCH = 'CHoCH'
TINY = size.tiny
SMALL = size.small
NORMAL = size.normal
ATR = 'Atr'
RANGE = 'Cumulative Mean Range'
CLOSE = 'Close'
HIGHLOW = 'High/Low'
SOLID = '⎯⎯⎯'
DASHED = '----'
DOTTED = '····'
SMART_GROUP = 'Smart Money Concepts'
INTERNAL_GROUP = 'Real Time Internal Structure'
SWING_GROUP = 'Real Time Swing Structure'
BLOCKS_GROUP = 'Order Blocks'
EQUAL_GROUP = 'EQH/EQL'
GAPS_GROUP = 'Fair Value Gaps'
LEVELS_GROUP = 'Highs & Lows MTF'
ZONES_GROUP = 'Premium & Discount Zones'
modeTooltip = 'Allows to display historical Structure or only the recent ones'
styleTooltip = 'Indicator color theme'
showTrendTooltip = 'Display additional candles with a color reflecting the current trend detected by structure'
showInternalsTooltip = 'Display internal market structure'
internalFilterConfluenceTooltip = 'Filter non significant internal structure breakouts'
showStructureTooltip = 'Display swing market Structure'
showSwingsTooltip = 'Display swing point as labels on the chart'
showHighLowSwingsTooltip = 'Highlight most recent strong and weak high/low points on the chart'
showInternalOrderBlocksTooltip = 'Display internal order blocks on the chart Number of internal order blocks to display on the chart'
showSwingOrderBlocksTooltip = 'Display swing order blocks on the chart Number of internal swing blocks to display on the chart'
orderBlockFilterTooltip = 'Method used to filter out volatile order blocks It is recommended to use the cumulative mean range method when a low amount of data is available'
orderBlockMitigationTooltip = 'Select what values to use for order block mitigation'
showEqualHighsLowsTooltip = 'Display equal highs and equal lows on the chart'
equalHighsLowsLengthTooltip = 'Number of bars used to confirm equal highs and equal lows'
equalHighsLowsThresholdTooltip = 'Sensitivity threshold in a range (0, 1) used for the detection of equal highs & lows Lower values will return fewer but more pertinent results'
showFairValueGapsTooltip = 'Display fair values gaps on the chart'
fairValueGapsThresholdTooltip = 'Filter out non significant fair value gaps'
fairValueGapsTimeframeTooltip = 'Fair value gaps timeframe'
fairValueGapsExtendTooltip = 'Determine how many bars to extend the Fair Value Gap boxes on chart'
showPremiumDiscountZonesTooltip = 'Display premium, discount, and equilibrium zones on chart'
modeInput = input.string( HISTORICAL, 'Mode', group = SMART_GROUP, tooltip = modeTooltip, options = )
styleInput = input.string( COLORED, 'Style', group = SMART_GROUP, tooltip = styleTooltip,options = )
showTrendInput = input( false, 'Color Candles', group = SMART_GROUP, tooltip = showTrendTooltip)
showInternalsInput = input( true, 'Show Internal Structure', group = INTERNAL_GROUP, tooltip = showInternalsTooltip)
showInternalBullInput = input.string( ALL, 'Bullish Structure', group = INTERNAL_GROUP, inline = 'ibull', options = )
internalBullColorInput = input( GREEN, '', group = INTERNAL_GROUP, inline = 'ibull')
showInternalBearInput = input.string( ALL, 'Bearish Structure' , group = INTERNAL_GROUP, inline = 'ibear', options = )
internalBearColorInput = input( RED, '', group = INTERNAL_GROUP, inline = 'ibear')
internalFilterConfluenceInput = input( false, 'Confluence Filter', group = INTERNAL_GROUP, tooltip = internalFilterConfluenceTooltip)
internalStructureSize = input.string( TINY, 'Internal Label Size', group = INTERNAL_GROUP, options = )
showStructureInput = input( true, 'Show Swing Structure', group = SWING_GROUP, tooltip = showStructureTooltip)
showSwingBullInput = input.string( ALL, 'Bullish Structure', group = SWING_GROUP, inline = 'bull', options = )
swingBullColorInput = input( GREEN, '', group = SWING_GROUP, inline = 'bull')
showSwingBearInput = input.string( ALL, 'Bearish Structure', group = SWING_GROUP, inline = 'bear', options = )
swingBearColorInput = input( RED, '', group = SWING_GROUP, inline = 'bear')
swingStructureSize = input.string( SMALL, 'Swing Label Size', group = SWING_GROUP, options = )
showSwingsInput = input( false, 'Show Swings Points', group = SWING_GROUP, tooltip = showSwingsTooltip,inline = 'swings')
swingsLengthInput = input.int( 50, '', group = SWING_GROUP, minval = 10, inline = 'swings')
showHighLowSwingsInput = input( true, 'Show Strong/Weak High/Low',group = SWING_GROUP, tooltip = showHighLowSwingsTooltip)
showInternalOrderBlocksInput = input( true, 'Internal Order Blocks' , group = BLOCKS_GROUP, tooltip = showInternalOrderBlocksTooltip, inline = 'iob')
internalOrderBlocksSizeInput = input.int( 5, '', group = BLOCKS_GROUP, minval = 1, maxval = 20, inline = 'iob')
showSwingOrderBlocksInput = input( false, 'Swing Order Blocks', group = BLOCKS_GROUP, tooltip = showSwingOrderBlocksTooltip, inline = 'ob')
swingOrderBlocksSizeInput = input.int( 5, '', group = BLOCKS_GROUP, minval = 1, maxval = 20, inline = 'ob')
orderBlockFilterInput = input.string( 'Atr', 'Order Block Filter', group = BLOCKS_GROUP, tooltip = orderBlockFilterTooltip, options = )
orderBlockMitigationInput = input.string( HIGHLOW, 'Order Block Mitigation', group = BLOCKS_GROUP, tooltip = orderBlockMitigationTooltip, options = )
internalBullishOrderBlockColor = input.color(color.new(#808080, 80), 'Internal Bullish OB', group = BLOCKS_GROUP)
internalBearishOrderBlockColor = input.color(color.new(#808080, 80), 'Internal Bearish OB', group = BLOCKS_GROUP)
swingBullishOrderBlockColor = input.color(color.new(#808080, 80), 'Bullish OB', group = BLOCKS_GROUP)
swingBearishOrderBlockColor = input.color(color.new(#808080, 80), 'Bearish OB', group = BLOCKS_GROUP)
showEqualHighsLowsInput = input( true, 'Equal High/Low', group = EQUAL_GROUP, tooltip = showEqualHighsLowsTooltip)
equalHighsLowsLengthInput = input.int( 3, 'Bars Confirmation', group = EQUAL_GROUP, tooltip = equalHighsLowsLengthTooltip, minval = 1)
equalHighsLowsThresholdInput = input.float( 0.1, 'Threshold', group = EQUAL_GROUP, tooltip = equalHighsLowsThresholdTooltip, minval = 0, maxval = 0.5, step = 0.1)
equalHighsLowsSizeInput = input.string( TINY, 'Label Size', group = EQUAL_GROUP, options = )
showFairValueGapsInput = input( false, 'Fair Value Gaps', group = GAPS_GROUP, tooltip = showFairValueGapsTooltip)
fairValueGapsThresholdInput = input( true, 'Auto Threshold', group = GAPS_GROUP, tooltip = fairValueGapsThresholdTooltip)
fairValueGapsTimeframeInput = input.timeframe('', 'Timeframe', group = GAPS_GROUP, tooltip = fairValueGapsTimeframeTooltip)
fairValueGapsBullColorInput = input.color(color.new(#00ff68, 70), 'Bullish FVG' , group = GAPS_GROUP)
fairValueGapsBearColorInput = input.color(color.new(#ff0008, 70), 'Bearish FVG' , group = GAPS_GROUP)
fairValueGapsExtendInput = input.int( 1, 'Extend FVG', group = GAPS_GROUP, tooltip = fairValueGapsExtendTooltip, minval = 0)
showDailyLevelsInput = input( false, 'Daily', group = LEVELS_GROUP, inline = 'daily')
dailyLevelsStyleInput = input.string( SOLID, '', group = LEVELS_GROUP, inline = 'daily', options = )
dailyLevelsColorInput = input( BLUE, '', group = LEVELS_GROUP, inline = 'daily')
showWeeklyLevelsInput = input( false, 'Weekly', group = LEVELS_GROUP, inline = 'weekly')
weeklyLevelsStyleInput = input.string( SOLID, '', group = LEVELS_GROUP, inline = 'weekly', options = )
weeklyLevelsColorInput = input( BLUE, '', group = LEVELS_GROUP, inline = 'weekly')
showMonthlyLevelsInput = input( false, 'Monthly', group = LEVELS_GROUP, inline = 'monthly')
monthlyLevelsStyleInput = input.string( SOLID, '', group = LEVELS_GROUP, inline = 'monthly', options = )
monthlyLevelsColorInput = input( BLUE, '', group = LEVELS_GROUP, inline = 'monthly')
showPremiumDiscountZonesInput = input( false, 'Premium/Discount Zones', group = ZONES_GROUP , tooltip = showPremiumDiscountZonesTooltip)
premiumZoneColorInput = input.color( RED, 'Premium Zone', group = ZONES_GROUP)
equilibriumZoneColorInput = input.color( GRAY, 'Equilibrium Zone', group = ZONES_GROUP)
discountZoneColorInput = input.color( GREEN, 'Discount Zone', group = ZONES_GROUP)
//---------------------------------------------------------------------------------------------------------------------}
//DATA STRUCTURES & VARIABLES
//---------------------------------------------------------------------------------------------------------------------{
// @type UDT representing alerts as bool fields
// @field internalBullishBOS internal structure custom alert
// @field internalBearishBOS internal structure custom alert
// @field internalBullishCHoCH internal structure custom alert
// @field internalBearishCHoCH internal structure custom alert
// @field swingBullishBOS swing structure custom alert
// @field swingBearishBOS swing structure custom alert
// @field swingBullishCHoCH swing structure custom alert
// @field swingBearishCHoCH swing structure custom alert
// @field internalBullishOrderBlock internal order block custom alert
// @field internalBearishOrderBlock internal order block custom alert
// @field swingBullishOrderBlock swing order block custom alert
// @field swingBearishOrderBlock swing order block custom alert
// @field equalHighs equal high low custom alert
// @field equalLows equal high low custom alert
// @field bullishFairValueGap fair value gap custom alert
// @field bearishFairValueGap fair value gap custom alert
type alerts
bool internalBullishBOS = false
bool internalBearishBOS = false
bool internalBullishCHoCH = false
bool internalBearishCHoCH = false
bool swingBullishBOS = false
bool swingBearishBOS = false
bool swingBullishCHoCH = false
bool swingBearishCHoCH = false
bool internalBullishOrderBlock = false
bool internalBearishOrderBlock = false
bool swingBullishOrderBlock = false
bool swingBearishOrderBlock = false
bool equalHighs = false
bool equalLows = false
bool bullishFairValueGap = false
bool bearishFairValueGap = false
// @type UDT representing last swing extremes (top & bottom)
// @field top last top swing price
// @field bottom last bottom swing price
// @field barTime last swing bar time
// @field barIndex last swing bar index
// @field lastTopTime last top swing time
// @field lastBottomTime last bottom swing time
type trailingExtremes
float top
float bottom
int barTime
int barIndex
int lastTopTime
int lastBottomTime
// @type UDT representing Fair Value Gaps
// @field top top price
// @field bottom bottom price
// @field bias bias (BULLISH or BEARISH)
// @field topBox top box
// @field bottomBox bottom box
type fairValueGap
float top
float bottom
int bias
box topBox
box bottomBox
// @type UDT representing trend bias
// @field bias BULLISH or BEARISH
type trend
int bias
// @type UDT representing Equal Highs Lows display
// @field l_ine displayed line
// @field l_abel displayed label
type equalDisplay
line l_ine = na
label l_abel = na
// @type UDT representing a pivot point (swing point)
// @field currentLevel current price level
// @field lastLevel last price level
// @field crossed true if price level is crossed
// @field barTime bar time
// @field barIndex bar index
type pivot
float currentLevel
float lastLevel
bool crossed
int barTime = time
int barIndex = bar_index
// @type UDT representing an order block
// @field barHigh bar high
// @field barLow bar low
// @field barTime bar time
// @field bias BULLISH or BEARISH
type orderBlock
float barHigh
float barLow
int barTime
int bias
// @variable current swing pivot high
var pivot swingHigh = pivot.new(na,na,false)
// @variable current swing pivot low
var pivot swingLow = pivot.new(na,na,false)
// @variable current internal pivot high
var pivot internalHigh = pivot.new(na,na,false)
// @variable current internal pivot low
var pivot internalLow = pivot.new(na,na,false)
// @variable current equal high pivot
var pivot equalHigh = pivot.new(na,na,false)
// @variable current equal low pivot
var pivot equalLow = pivot.new(na,na,false)
// @variable swing trend bias
var trend swingTrend = trend.new(0)
// @variable internal trend bias
var trend internalTrend = trend.new(0)
// @variable equal high display
var equalDisplay equalHighDisplay = equalDisplay.new()
// @variable equal low display
var equalDisplay equalLowDisplay = equalDisplay.new()
// @variable storage for fairValueGap UDTs
var array fairValueGaps = array.new()
// @variable storage for parsed highs
var array parsedHighs = array.new()
// @variable storage for parsed lows
var array parsedLows = array.new()
// @variable storage for raw highs
var array highs = array.new()
// @variable storage for raw lows
var array lows = array.new()
// @variable storage for bar time values
var array times = array.new()
// @variable last trailing swing high and low
var trailingExtremes trailing = trailingExtremes.new()
// @variable storage for orderBlock UDTs (swing order blocks)
var array swingOrderBlocks = array.new()
// @variable storage for orderBlock UDTs (internal order blocks)
var array internalOrderBlocks = array.new()
// @variable storage for swing order blocks boxes
var array swingOrderBlocksBoxes = array.new()
// @variable storage for internal order blocks boxes
var array internalOrderBlocksBoxes = array.new()
// @variable color for swing bullish structures
var swingBullishColor = styleInput == MONOCHROME ? MONO_BULLISH : swingBullColorInput
// @variable color for swing bearish structures
var swingBearishColor = styleInput == MONOCHROME ? MONO_BEARISH : swingBearColorInput
// @variable color for bullish fair value gaps
var fairValueGapBullishColor = styleInput == MONOCHROME ? color.new(MONO_BULLISH,70) : fairValueGapsBullColorInput
// @variable color for bearish fair value gaps
var fairValueGapBearishColor = styleInput == MONOCHROME ? color.new(MONO_BEARISH,70) : fairValueGapsBearColorInput
// @variable color for premium zone
var premiumZoneColor = styleInput == MONOCHROME ? MONO_BEARISH : premiumZoneColorInput
// @variable color for discount zone
var discountZoneColor = styleInput == MONOCHROME ? MONO_BULLISH : discountZoneColorInput
// @variable bar index on current script iteration
varip int currentBarIndex = bar_index
// @variable bar index on last script iteration
varip int lastBarIndex = bar_index
// @variable alerts in current bar
alerts currentAlerts = alerts.new()
// @variable time at start of chart
var initialTime = time
// we create the needed boxes for displaying order blocks at the first execution
if barstate.isfirst
if showSwingOrderBlocksInput
for index = 1 to swingOrderBlocksSizeInput
swingOrderBlocksBoxes.push(box.new(na,na,na,na,xloc = xloc.bar_time,extend = extend.right))
if showInternalOrderBlocksInput
for index = 1 to internalOrderBlocksSizeInput
internalOrderBlocksBoxes.push(box.new(na,na,na,na,xloc = xloc.bar_time,extend = extend.right))
// @variable source to use in bearish order blocks mitigation
bearishOrderBlockMitigationSource = orderBlockMitigationInput == CLOSE ? close : high
// @variable source to use in bullish order blocks mitigation
bullishOrderBlockMitigationSource = orderBlockMitigationInput == CLOSE ? close : low
// @variable default volatility measure
atrMeasure = ta.atr(200)
// @variable parsed volatility measure by user settings
volatilityMeasure = orderBlockFilterInput == ATR ? atrMeasure : ta.cum(ta.tr)/bar_index
// @variable true if current bar is a high volatility bar
highVolatilityBar = (high - low) >= (2 * volatilityMeasure)
// @variable parsed high
parsedHigh = highVolatilityBar ? low : high
// @variable parsed low
parsedLow = highVolatilityBar ? high : low
// we store current values into the arrays at each bar
parsedHighs.push(parsedHigh)
parsedLows.push(parsedLow)
highs.push(high)
lows.push(low)
times.push(time)
//---------------------------------------------------------------------------------------------------------------------}
//USER-DEFINED FUNCTIONS
//---------------------------------------------------------------------------------------------------------------------{
// @function Get the value of the current leg, it can be 0 (bearish) or 1 (bullish)
// @returns int
leg(int size) =>
var leg = 0
newLegHigh = high > ta.highest( size)
newLegLow = low < ta.lowest( size)
if newLegHigh
leg := BEARISH_LEG
else if newLegLow
leg := BULLISH_LEG
leg
// @function Identify whether the current value is the start of a new leg (swing)
// @param leg (int) Current leg value
// @returns bool
startOfNewLeg(int leg) => ta.change(leg) != 0
// @function Identify whether the current level is the start of a new bearish leg (swing)
// @param leg (int) Current leg value
// @returns bool
startOfBearishLeg(int leg) => ta.change(leg) == -1
// @function Identify whether the current level is the start of a new bullish leg (swing)
// @param leg (int) Current leg value
// @returns bool
startOfBullishLeg(int leg) => ta.change(leg) == +1
// @function create a new label
// @param labelTime bar time coordinate
// @param labelPrice price coordinate
// @param tag text to display
// @param labelColor text color
// @param labelStyle label style
// @returns label ID
drawLabel(int labelTime, float labelPrice, string tag, color labelColor, string labelStyle) =>
var label l_abel = na
if modeInput == PRESENT
l_abel.delete()
l_abel := label.new(chart.point.new(labelTime,na,labelPrice),tag,xloc.bar_time,color=color(na),textcolor=labelColor,style = labelStyle,size = size.small)
// @function create a new line and label representing an EQH or EQL
// @param p_ivot starting pivot
// @param level price level of current pivot
// @param size how many bars ago was the current pivot detected
// @param equalHigh true for EQH, false for EQL
// @returns label ID
drawEqualHighLow(pivot p_ivot, float level, int size, bool equalHigh) =>
equalDisplay e_qualDisplay = equalHigh ? equalHighDisplay : equalLowDisplay
string tag = 'EQL'
color equalColor = swingBullishColor
string labelStyle = label.style_label_up
if equalHigh
tag := 'EQH'
equalColor := swingBearishColor
labelStyle := label.style_label_down
if modeInput == PRESENT
line.delete( e_qualDisplay.l_ine)
label.delete( e_qualDisplay.l_abel)
e_qualDisplay.l_ine := line.new(chart.point.new(p_ivot.barTime,na,p_ivot.currentLevel), chart.point.new(time ,na,level), xloc = xloc.bar_time, color = equalColor, style = line.style_dotted)
labelPosition = math.round(0.5*(p_ivot.barIndex + bar_index - size))
e_qualDisplay.l_abel := label.new(chart.point.new(na,labelPosition,level), tag, xloc.bar_index, color = color(na), textcolor = equalColor, style = labelStyle, size = equalHighsLowsSizeInput)
// @function store current structure and trailing swing points, and also display swing points and equal highs/lows
// @param size (int) structure size
// @param equalHighLow (bool) true for displaying current highs/lows
// @param internal (bool) true for getting internal structures
// @returns label ID
getCurrentStructure(int size,bool equalHighLow = false, bool internal = false) =>
currentLeg = leg(size)
newPivot = startOfNewLeg(currentLeg)
pivotLow = startOfBullishLeg(currentLeg)
pivotHigh = startOfBearishLeg(currentLeg)
if newPivot
if pivotLow
pivot p_ivot = equalHighLow ? equalLow : internal ? internalLow : swingLow
if equalHighLow and math.abs(p_ivot.currentLevel - low ) < equalHighsLowsThresholdInput * atrMeasure
drawEqualHighLow(p_ivot, low , size, false)
p_ivot.lastLevel := p_ivot.currentLevel
p_ivot.currentLevel := low
p_ivot.crossed := false
p_ivot.barTime := time
p_ivot.barIndex := bar_index
if not equalHighLow and not internal
trailing.bottom := p_ivot.currentLevel
trailing.barTime := p_ivot.barTime
trailing.barIndex := p_ivot.barIndex
trailing.lastBottomTime := p_ivot.barTime
if showSwingsInput and not internal and not equalHighLow
drawLabel(time , p_ivot.currentLevel, p_ivot.currentLevel < p_ivot.lastLevel ? 'LL' : 'HL', swingBullishColor, label.style_label_up)
else
pivot p_ivot = equalHighLow ? equalHigh : internal ? internalHigh : swingHigh
if equalHighLow and math.abs(p_ivot.currentLevel - high ) < equalHighsLowsThresholdInput * atrMeasure
drawEqualHighLow(p_ivot,high ,size,true)
p_ivot.lastLevel := p_ivot.currentLevel
p_ivot.currentLevel := high
p_ivot.crossed := false
p_ivot.barTime := time
p_ivot.barIndex := bar_index
if not equalHighLow and not internal
trailing.top := p_ivot.currentLevel
trailing.barTime := p_ivot.barTime
trailing.barIndex := p_ivot.barIndex
trailing.lastTopTime := p_ivot.barTime
if showSwingsInput and not internal and not equalHighLow
drawLabel(time , p_ivot.currentLevel, p_ivot.currentLevel > p_ivot.lastLevel ? 'HH' : 'LH', swingBearishColor, label.style_label_down)
// @function draw line and label representing a structure
// @param p_ivot base pivot point
// @param tag test to display
// @param structureColor base color
// @param lineStyle line style
// @param labelStyle label style
// @param labelSize text size
// @returns label ID
drawStructure(pivot p_ivot, string tag, color structureColor, string lineStyle, string labelStyle, string labelSize) =>
var line l_ine = line.new(na,na,na,na,xloc = xloc.bar_time)
var label l_abel = label.new(na,na)
if modeInput == PRESENT
l_ine.delete()
l_abel.delete()
l_ine := line.new(chart.point.new(p_ivot.barTime,na,p_ivot.currentLevel), chart.point.new(time,na,p_ivot.currentLevel), xloc.bar_time, color=structureColor, style=lineStyle)
l_abel := label.new(chart.point.new(na,math.round(0.5*(p_ivot.barIndex+bar_index)),p_ivot.currentLevel), tag, xloc.bar_index, color=color(na), textcolor=structureColor, style=labelStyle, size = labelSize)
// @function delete order blocks
// @param internal true for internal order blocks
// @returns orderBlock ID
deleteOrderBlocks(bool internal = false) =>
array orderBlocks = internal ? internalOrderBlocks : swingOrderBlocks
for in orderBlocks
bool crossedOderBlock = false
if bearishOrderBlockMitigationSource > eachOrderBlock.barHigh and eachOrderBlock.bias == BEARISH
crossedOderBlock := true
if internal
currentAlerts.internalBearishOrderBlock := true
else
currentAlerts.swingBearishOrderBlock := true
else if bullishOrderBlockMitigationSource < eachOrderBlock.barLow and eachOrderBlock.bias == BULLISH
crossedOderBlock := true
if internal
currentAlerts.internalBullishOrderBlock := true
else
currentAlerts.swingBullishOrderBlock := true
if crossedOderBlock
orderBlocks.remove(index)
// @function fetch and store order blocks
// @param p_ivot base pivot point
// @param internal true for internal order blocks
// @param bias BULLISH or BEARISH
// @returns void
storeOrdeBlock(pivot p_ivot,bool internal = false,int bias) =>
if (not internal and showSwingOrderBlocksInput) or (internal and showInternalOrderBlocksInput)
array a_rray = na
int parsedIndex = na
if bias == BEARISH
a_rray := parsedHighs.slice(p_ivot.barIndex,bar_index)
parsedIndex := p_ivot.barIndex + a_rray.indexof(a_rray.max())
else
a_rray := parsedLows.slice(p_ivot.barIndex,bar_index)
parsedIndex := p_ivot.barIndex + a_rray.indexof(a_rray.min())
orderBlock o_rderBlock = orderBlock.new(parsedHighs.get(parsedIndex), parsedLows.get(parsedIndex), times.get(parsedIndex),bias)
array orderBlocks = internal ? internalOrderBlocks : swingOrderBlocks
if orderBlocks.size() >= 100
orderBlocks.pop()
orderBlocks.unshift(o_rderBlock)
// @function draw order blocks as boxes
// @param internal true for internal order blocks
// @returns void
drawOrderBlocks(bool internal = false) =>
array orderBlocks = internal ? internalOrderBlocks : swingOrderBlocks
orderBlocksSize = orderBlocks.size()
if orderBlocksSize > 0
maxOrderBlocks = internal ? internalOrderBlocksSizeInput : swingOrderBlocksSizeInput
array parsedOrdeBlocks = orderBlocks.slice(0, math.min(maxOrderBlocks,orderBlocksSize))
array b_oxes = internal ? internalOrderBlocksBoxes : swingOrderBlocksBoxes
for in parsedOrdeBlocks
orderBlockColor = styleInput == MONOCHROME ? (eachOrderBlock.bias == BEARISH ? color.new(MONO_BEARISH,80) : color.new(MONO_BULLISH,80)) : internal ? (eachOrderBlock.bias == BEARISH ? internalBearishOrderBlockColor : internalBullishOrderBlockColor) : (eachOrderBlock.bias == BEARISH ? swingBearishOrderBlockColor : swingBullishOrderBlockColor)
box b_ox = b_oxes.get(index)
b_ox.set_top_left_point( chart.point.new(eachOrderBlock.barTime,na,eachOrderBlock.barHigh))
b_ox.set_bottom_right_point(chart.point.new(last_bar_time,na,eachOrderBlock.barLow))
b_ox.set_border_color( internal ? na : orderBlockColor)
b_ox.set_bgcolor( orderBlockColor)
// @function detect and draw structures, also detect and store order blocks
// @param internal true for internal structures or order blocks
// @returns void
displayStructure(bool internal = false) =>
var bullishBar = true
var bearishBar = true
if internalFilterConfluenceInput
bullishBar := high - math.max(close, open) > math.min(close, open - low)
bearishBar := high - math.max(close, open) < math.min(close, open - low)
pivot p_ivot = internal ? internalHigh : swingHigh
trend t_rend = internal ? internalTrend : swingTrend
lineStyle = internal ? line.style_dashed : line.style_solid
labelSize = internal ? internalStructureSize : swingStructureSize
extraCondition = internal ? internalHigh.currentLevel != swingHigh.currentLevel and bullishBar : true
bullishColor = styleInput == MONOCHROME ? MONO_BULLISH : internal ? internalBullColorInput : swingBullColorInput
if ta.crossover(close,p_ivot.currentLevel) and not p_ivot.crossed and extraCondition
string tag = t_rend.bias == BEARISH ? CHOCH : BOS
if internal
currentAlerts.internalBullishCHoCH := tag == CHOCH
currentAlerts.internalBullishBOS := tag == BOS
else
currentAlerts.swingBullishCHoCH := tag == CHOCH
currentAlerts.swingBullishBOS := tag == BOS
p_ivot.crossed := true
t_rend.bias := BULLISH
displayCondition = internal ? showInternalsInput and (showInternalBullInput == ALL or (showInternalBullInput == BOS and tag != CHOCH) or (showInternalBullInput == CHOCH and tag == CHOCH)) : showStructureInput and (showSwingBullInput == ALL or (showSwingBullInput == BOS and tag != CHOCH) or (showSwingBullInput == CHOCH and tag == CHOCH))
if displayCondition
drawStructure(p_ivot,tag,bullishColor,lineStyle,label.style_label_down,labelSize)
if (internal and showInternalOrderBlocksInput) or (not internal and showSwingOrderBlocksInput)
storeOrdeBlock(p_ivot,internal,BULLISH)
p_ivot := internal ? internalLow : swingLow
extraCondition := internal ? internalLow.currentLevel != swingLow.currentLevel and bearishBar : true
bearishColor = styleInput == MONOCHROME ? MONO_BEARISH : internal ? internalBearColorInput : swingBearColorInput
if ta.crossunder(close,p_ivot.currentLevel) and not p_ivot.crossed and extraCondition
string tag = t_rend.bias == BULLISH ? CHOCH : BOS
if internal
currentAlerts.internalBearishCHoCH := tag == CHOCH
currentAlerts.internalBearishBOS := tag == BOS
else
currentAlerts.swingBearishCHoCH := tag == CHOCH
currentAlerts.swingBearishBOS := tag == BOS
p_ivot.crossed := true
t_rend.bias := BEARISH
displayCondition = internal ? showInternalsInput and (showInternalBearInput == ALL or (showInternalBearInput == BOS and tag != CHOCH) or (showInternalBearInput == CHOCH and tag == CHOCH)) : showStructureInput and (showSwingBearInput == ALL or (showSwingBearInput == BOS and tag != CHOCH) or (showSwingBearInput == CHOCH and tag == CHOCH))
if displayCondition
drawStructure(p_ivot,tag,bearishColor,lineStyle,label.style_label_up,labelSize)
if (internal and showInternalOrderBlocksInput) or (not internal and showSwingOrderBlocksInput)
storeOrdeBlock(p_ivot,internal,BEARISH)
// @function draw one fair value gap box (each fair value gap has two boxes)
// @param leftTime left time coordinate
// @param rightTime right time coordinate
// @param topPrice top price level
// @param bottomPrice bottom price level
// @param boxColor box color
// @returns box ID
fairValueGapBox(leftTime,rightTime,topPrice,bottomPrice,boxColor) => box.new(chart.point.new(leftTime,na,topPrice),chart.point.new(rightTime + fairValueGapsExtendInput * (time-time ),na,bottomPrice), xloc=xloc.bar_time, border_color = boxColor, bgcolor = boxColor)
// @function delete fair value gaps
// @returns fairValueGap ID
deleteFairValueGaps() =>
for in fairValueGaps
if (low < eachFairValueGap.bottom and eachFairValueGap.bias == BULLISH) or (high > eachFairValueGap.top and eachFairValueGap.bias == BEARISH)
eachFairValueGap.topBox.delete()
eachFairValueGap.bottomBox.delete()
fairValueGaps.remove(index)
// @function draw fair value gaps
// @returns fairValueGap ID
drawFairValueGaps() =>
= request.security(syminfo.tickerid, fairValueGapsTimeframeInput, [close , open , time , high , low , time , high , low ],lookahead = barmerge.lookahead_on)
barDeltaPercent = (lastClose - lastOpen) / (lastOpen * 100)
newTimeframe = timeframe.change(fairValueGapsTimeframeInput)
threshold = fairValueGapsThresholdInput ? ta.cum(math.abs(newTimeframe ? barDeltaPercent : 0)) / bar_index * 2 : 0
bullishFairValueGap = currentLow > last2High and lastClose > last2High and barDeltaPercent > threshold and newTimeframe
bearishFairValueGap = currentHigh < last2Low and lastClose < last2Low and -barDeltaPercent > threshold and newTimeframe
if bullishFairValueGap
currentAlerts.bullishFairValueGap := true
fairValueGaps.unshift(fairValueGap.new(currentLow,last2High,BULLISH,fairValueGapBox(lastTime,currentTime,currentLow,math.avg(currentLow,last2High),fairValueGapBullishColor),fairValueGapBox(lastTime,currentTime,math.avg(currentLow,last2High),last2High,fairValueGapBullishColor)))
if bearishFairValueGap
currentAlerts.bearishFairValueGap := true
fairValueGaps.unshift(fairValueGap.new(currentHigh,last2Low,BEARISH,fairValueGapBox(lastTime,currentTime,currentHigh,math.avg(currentHigh,last2Low),fairValueGapBearishColor),fairValueGapBox(lastTime,currentTime,math.avg(currentHigh,last2Low),last2Low,fairValueGapBearishColor)))
// @function get line style from string
// @param style line style
// @returns string
getStyle(string style) =>
switch style
SOLID => line.style_solid
DASHED => line.style_dashed
DOTTED => line.style_dotted
// @function draw MultiTimeFrame levels
// @param timeframe base timeframe
// @param sameTimeframe true if chart timeframe is same as base timeframe
// @param style line style
// @param levelColor line and text color
// @returns void
drawLevels(string timeframe, bool sameTimeframe, string style, color levelColor) =>
= request.security(syminfo.tickerid, timeframe, [high , low , time , time],lookahead = barmerge.lookahead_on)
float parsedTop = sameTimeframe ? high : topLevel
float parsedBottom = sameTimeframe ? low : bottomLevel
int parsedLeftTime = sameTimeframe ? time : leftTime
int parsedRightTime = sameTimeframe ? time : rightTime
int parsedTopTime = time
int parsedBottomTime = time
if not sameTimeframe
int leftIndex = times.binary_search_rightmost(parsedLeftTime)
int rightIndex = times.binary_search_rightmost(parsedRightTime)
array timeArray = times.slice(leftIndex,rightIndex)
array topArray = highs.slice(leftIndex,rightIndex)
array bottomArray = lows.slice(leftIndex,rightIndex)
parsedTopTime := timeArray.size() > 0 ? timeArray.get(topArray.indexof(topArray.max())) : initialTime
parsedBottomTime := timeArray.size() > 0 ? timeArray.get(bottomArray.indexof(bottomArray.min())) : initialTime
var line topLine = line.new(na, na, na, na, xloc = xloc.bar_time, color = levelColor, style = getStyle(style))
var line bottomLine = line.new(na, na, na, na, xloc = xloc.bar_time, color = levelColor, style = getStyle(style))
var label topLabel = label.new(na, na, xloc = xloc.bar_time, text = str.format('P{0}H',timeframe), color=color(na), textcolor = levelColor, size = size.small, style = label.style_label_left)
var label bottomLabel = label.new(na, na, xloc = xloc.bar_time, text = str.format('P{0}L',timeframe), color=color(na), textcolor = levelColor, size = size.small, style = label.style_label_left)
topLine.set_first_point( chart.point.new(parsedTopTime,na,parsedTop))
topLine.set_second_point( chart.point.new(last_bar_time + 20 * (time-time ),na,parsedTop))
topLabel.set_point( chart.point.new(last_bar_time + 20 * (time-time ),na,parsedTop))
bottomLine.set_first_point( chart.point.new(parsedBottomTime,na,parsedBottom))
bottomLine.set_second_point(chart.point.new(last_bar_time + 20 * (time-time ),na,parsedBottom))
bottomLabel.set_point( chart.point.new(last_bar_time + 20 * (time-time ),na,parsedBottom))
// @function true if chart timeframe is higher than provided timeframe
// @param timeframe timeframe to check
// @returns bool
higherTimeframe(string timeframe) => timeframe.in_seconds() > timeframe.in_seconds(timeframe)
// @function update trailing swing points
// @returns int
updateTrailingExtremes() =>
trailing.top := math.max(high,trailing.top)
trailing.lastTopTime := trailing.top == high ? time : trailing.lastTopTime
trailing.bottom := math.min(low,trailing.bottom)
trailing.lastBottomTime := trailing.bottom == low ? time : trailing.lastBottomTime
// @function draw trailing swing points
// @returns void
drawHighLowSwings() =>
var line topLine = line.new(na, na, na, na, color = swingBearishColor, xloc = xloc.bar_time)
var line bottomLine = line.new(na, na, na, na, color = swingBullishColor, xloc = xloc.bar_time)
var label topLabel = label.new(na, na, color=color(na), textcolor = swingBearishColor, xloc = xloc.bar_time, style = label.style_label_down, size = size.tiny)
var label bottomLabel = label.new(na, na, color=color(na), textcolor = swingBullishColor, xloc = xloc.bar_time, style = label.style_label_up, size = size.tiny)
rightTimeBar = last_bar_time + 20 * (time - time )
topLine.set_first_point( chart.point.new(trailing.lastTopTime, na, trailing.top))
topLine.set_second_point( chart.point.new(rightTimeBar, na, trailing.top))
topLabel.set_point( chart.point.new(rightTimeBar, na, trailing.top))
topLabel.set_text( swingTrend.bias == BEARISH ? 'Strong High' : 'Weak High')
bottomLine.set_first_point( chart.point.new(trailing.lastBottomTime, na, trailing.bottom))
bottomLine.set_second_point(chart.point.new(rightTimeBar, na, trailing.bottom))
bottomLabel.set_point( chart.point.new(rightTimeBar, na, trailing.bottom))
bottomLabel.set_text( swingTrend.bias == BULLISH ? 'Strong Low' : 'Weak Low')
// @function draw a zone with a label and a box
// @param labelLevel price level for label
// @param labelIndex bar index for label
// @param top top price level for box
// @param bottom bottom price level for box
// @param tag text to display
// @param zoneColor base color
// @param style label style
// @returns void
drawZone(float labelLevel, int labelIndex, float top, float bottom, string tag, color zoneColor, string style) =>
var label l_abel = label.new(na,na,text = tag, color=color(na),textcolor = zoneColor, style = style, size = size.small)
var box b_ox = box.new(na,na,na,na,bgcolor = color.new(zoneColor,80),border_color = color(na), xloc = xloc.bar_time)
b_ox.set_top_left_point( chart.point.new(trailing.barTime,na,top))
b_ox.set_bottom_right_point(chart.point.new(last_bar_time,na,bottom))
l_abel.set_point( chart.point.new(na,labelIndex,labelLevel))
// @function draw premium/discount zones
// @returns void
drawPremiumDiscountZones() =>
drawZone(trailing.top, math.round(0.5*(trailing.barIndex + last_bar_index)), trailing.top, 0.95*trailing.top + 0.05*trailing.bottom, 'Premium', premiumZoneColor, label.style_label_down)
equilibriumLevel = math.avg(trailing.top, trailing.bottom)
drawZone(equilibriumLevel, last_bar_index, 0.525*trailing.top + 0.475*trailing.bottom, 0.525*trailing.bottom + 0.475*trailing.top, 'Equilibrium', equilibriumZoneColorInput, label.style_label_left)
drawZone(trailing.bottom, math.round(0.5*(trailing.barIndex + last_bar_index)), 0.95*trailing.bottom + 0.05*trailing.top, trailing.bottom, 'Discount', discountZoneColor, label.style_label_up)
//---------------------------------------------------------------------------------------------------------------------}
//MUTABLE VARIABLES & EXECUTION
//---------------------------------------------------------------------------------------------------------------------{
parsedOpen = showTrendInput ? open : na
candleColor = internalTrend.bias == BULLISH ? swingBullishColor : swingBearishColor
plotcandle(parsedOpen,high,low,close,color = candleColor, wickcolor = candleColor, bordercolor = candleColor)
if showHighLowSwingsInput or showPremiumDiscountZonesInput
updateTrailingExtremes()
if showHighLowSwingsInput
drawHighLowSwings()
if showPremiumDiscountZonesInput
drawPremiumDiscountZones()
if showFairValueGapsInput
deleteFairValueGaps()
getCurrentStructure(swingsLengthInput,false)
getCurrentStructure(5,false,true)
if showEqualHighsLowsInput
getCurrentStructure(equalHighsLowsLengthInput,true)
if showInternalsInput or showInternalOrderBlocksInput or showTrendInput
displayStructure(true)
if showStructureInput or showSwingOrderBlocksInput or showHighLowSwingsInput
displayStructure()
if showInternalOrderBlocksInput
deleteOrderBlocks(true)
if showSwingOrderBlocksInput
deleteOrderBlocks()
if showFairValueGapsInput
drawFairValueGaps()
if barstate.islastconfirmedhistory or barstate.islast
if showInternalOrderBlocksInput
drawOrderBlocks(true)
if showSwingOrderBlocksInput
drawOrderBlocks()
lastBarIndex := currentBarIndex
currentBarIndex := bar_index
newBar = currentBarIndex != lastBarIndex
if barstate.islastconfirmedhistory or (barstate.isrealtime and newBar)
if showDailyLevelsInput and not higherTimeframe('D')
drawLevels('D',timeframe.isdaily,dailyLevelsStyleInput,dailyLevelsColorInput)
if showWeeklyLevelsInput and not higherTimeframe('W')
drawLevels('W',timeframe.isweekly,weeklyLevelsStyleInput,weeklyLevelsColorInput)
if showMonthlyLevelsInput and not higherTimeframe('M')
drawLevels('M',timeframe.ismonthly,monthlyLevelsStyleInput,monthlyLevelsColorInput)
//---------------------------------------------------------------------------------------------------------------------}
//ALERTS
//---------------------------------------------------------------------------------------------------------------------{
alertcondition(currentAlerts.internalBullishBOS, 'Internal Bullish BOS', 'Internal Bullish BOS formed')
alertcondition(currentAlerts.internalBullishCHoCH, 'Internal Bullish CHoCH', 'Internal Bullish CHoCH formed')
alertcondition(currentAlerts.internalBearishBOS, 'Internal Bearish BOS', 'Internal Bearish BOS formed')
alertcondition(currentAlerts.internalBearishCHoCH, 'Internal Bearish CHoCH', 'Internal Bearish CHoCH formed')
alertcondition(currentAlerts.swingBullishBOS, 'Bullish BOS', 'Internal Bullish BOS formed')
alertcondition(currentAlerts.swingBullishCHoCH, 'Bullish CHoCH', 'Internal Bullish CHoCH formed')
alertcondition(currentAlerts.swingBearishBOS, 'Bearish BOS', 'Bearish BOS formed')
alertcondition(currentAlerts.swingBearishCHoCH, 'Bearish CHoCH', 'Bearish CHoCH formed')
alertcondition(currentAlerts.internalBullishOrderBlock, 'Bullish Internal OB Breakout', 'Price broke bullish internal OB')
alertcondition(currentAlerts.internalBearishOrderBlock, 'Bearish Internal OB Breakout', 'Price broke bearish internal OB')
alertcondition(currentAlerts.swingBullishOrderBlock, 'Bullish Swing OB Breakout', 'Price broke bullish swing OB')
alertcondition(currentAlerts.swingBearishOrderBlock, 'Bearish Swing OB Breakout', 'Price broke bearish swing OB')
alertcondition(currentAlerts.equalHighs, 'Equal Highs', 'Equal highs detected')
alertcondition(currentAlerts.equalLows, 'Equal Lows', 'Equal lows detected')
alertcondition(currentAlerts.bullishFairValueGap, 'Bullish FVG', 'Bullish FVG formed')
alertcondition(currentAlerts.bearishFairValueGap, 'Bearish FVG', 'Bearish FVG formed')
//---------------------------------------------------------------------------------------------------------------------}

RenKagi Fusion: Aura & SMA Clash IndicatorRenKagi Fusion: Aura & SMA Clash Indicator
Welcome to the RenKagi Fusion Indicator – a powerful, customizable tool that blends the strengths of Renko and Kagi charts to provide noise-filtered trend insights, enhanced with visual Aura effects and SMA (Simple Moving Average) crossover signals. Designed for traders seeking a unique edge in trend detection and reversal identification, this indicator combines traditional charting techniques with modern visualizations to help you navigate markets more effectively. Whether you're trading stocks, forex, or crypto, RenKagi Fusion offers a clean, actionable overview of market dynamics.
Key Features
RenKagi Line (Weighted Fusion of Renko and Kagi): The core of the indicator is the RenKagi line, a weighted average of Renko (brick-based trend filtering) and Kagi (reversal-focused line charts). Users can adjust the weight (default: 60% Renko, 40% Kagi) to prioritize stability or sensitivity. This fusion reduces market noise while highlighting key price movements.
Trend Scoring System: Calculates strength scores for Renko, Kagi, and RenKagi (capped at 20 points, converted to percentages). Scores increase with trend continuation and reset on reversals, giving a quantitative measure of momentum.
Aura Effects (Optional): Visual "glow" around lines based on score percentage – higher scores mean more opaque and thicker auras, adding a dynamic layer to trend visualization.
SMA Clash (Crossover Detection): Monitors daily SMA50, SMA100, and SMA200 for golden/death crosses (SMA50 crossing above/below longer SMAs) and RenKagi-SMA crossovers. These are displayed in a persistent info table for quick reference.
Customizable Visuals: Toggle lines, boxes, shapes, auras, and labels. Background coloring based on selected source (Renko, Kagi, or RenKagi) for intuitive trend bias.
Info Table: A configurable table (position and colors adjustable) summarizing scores, directions, cross states, brick size (with type), Kagi reversal (with type), and weights. No clutter – all in one place.
Alert Conditions: Built-in alerts for direction changes (Renko, Kagi, RenKagi), SMA crossovers, and golden/death crosses – perfect for real-time notifications.
How It Works
Renko Logic: Builds bricks based on user-selected type (Traditional fixed size, ATR dynamic, or Percentage). Scores build as trends persist, resetting on reversals.
Kagi Logic: Line reverses on thresholds (Traditional, ATR, or Percentage), scoring continuous moves.
RenKagi Calculation: Weighted average: (renkoPrice * renkoWeight + kagiLine * (100 - renkoWeight)) / 100. Score is a blend of individual scores.
SMA Integration: Daily timeframe SMAs for reliable long-term signals. Crossovers trigger alerts and update table states persistently until reversed.
Advantages for Traders
Noise Reduction: By fusing Renko's block structure with Kagi's reversal focus, it filters out minor fluctuations, helping identify strong trends early.
Versatility: Fully customizable – adjust weights, types, and visuals to fit any market or timeframe. Ideal for swing trading, trend following, or scalping.
Visual Clarity: Aura and background coloring provide at-a-glance insights, while the table consolidates data without overwhelming the chart.
Actionable Signals: Golden/Death crosses and direction changes offer clear entry/exit points, backed by alerts for timely execution.
Performance Optimization: Limits on lines/labels/boxes (500 each) ensure smooth operation on large datasets.
Usage Tips
Start with default settings for balanced performance.
Use in higher timeframes for trend confirmation or lower for intraday signals.
Combine with your favorite strategies – e.g., buy on RenKagi upward cross with SMA50 and golden cross confirmation.
Test on historical data to optimize weights and thresholds.
Note: This indicator is for educational and informational purposes only. Past performance is not indicative of future results. Always conduct your own analysis and use risk management. No financial advice is provided.
If you find this useful, please like, comment, or share your feedback!

Fractal Model (TTrades)Fractal Model - Higher Timeframe Analysis with TTFM Labeling
A higher timeframe candle visualization tool enhanced with TTFM (The Fractal Model) labeling system for pivot-based price action analysis, made popular by Youtuber TTrades
What This Script Does:
This indicator displays higher timeframe candles on your current chart and identifies key pivot formations using the TTFM labeling system. It helps traders understand market structure and potential reversal points through systematic pivot analysis.
Key Features:
Higher Timeframe Visualization : Shows HTF candles without switching timeframes
TTFM Labeling System : Identifies pivot components with C2, C3, and C4 labels
T-Spot Detection : Marks areas where price is likely to form wicks based on pivot logic
Sweep Confirmation : Detects when price sweeps previous levels but closes opposite
Fair Value Gap Detection : Identifies imbalance zones between candle ranges
Alert System : Sends alerts when T-spot formations are confirmed using pivot logic
Silver T-Spot Alerts : Special alerts during specific market hours
How TTFM Labeling Works:
The TTFM system labels pivot formations based on their structure:
C2 : The candle that "sticks out" - the initial move that creates the pivot
C3 / C4 : The distribution candle that continues the reversal (standard pivots)
Alert System:
The indicator provides alerts when:
T-spot formations are created and confirmed
Price sweeps tspot levels with proper confirmation (This signal tries to alert you when a potential wick has formed in the tspot location
Silver T-spot patterns occur during specific market hours
T-spot sweep confirmations are triggered
Practical Usage:
Add the indicator to your chart
Watch for T-spot formations (highlighted zones)
Look for C2, C3, C4 labels to understand pivot structure
Use sweep confirmations for entry timing
Set up alerts for T-spot confirmations and sweeps
Technical Implementation:
Logarithmic Midpoint Calculation:
The T-spot levels are calculated using logarithmic midpoint analysis:
Log Values : log_high = ln(high), log_low = ln(low), log_open = ln(open), log_close = ln(close)
Wick Analysis : upper_wick = log_high - max(log_open, log_close), lower_wick = min(log_open, log_close) - log_low
Body Size : body_size = |log_close - log_open|
Midpoint Logic : If max(upper_wick, lower_wick) > body_size, use wick-based midpoint; otherwise use (log_high + log_low)/2
Final Level : T-spot level = exp(log_mid_level)
T-Spot Formation Conditions:
Standard Bearish : last_closed.h > prev_closed.h AND last_closed.c < prev_closed.h
Standard Bullish : last_closed.l < prev_closed.l AND last_closed.c > prev_closed.l
Expansive Bearish : prev_closed.h > prev_prev_closed.h AND last_closed.c < max(prev_closed.o, prev_closed.c)
Expansive Bullish : prev_closed.l < prev_prev_closed.l AND last_closed.c > min(prev_closed.o, prev_closed.c)
Pro-trend Bearish : last_closed.h > mid_level AND last_closed.h < prev_closed.o AND last_closed.c < prev_closed.l
Pro-trend Bullish : last_closed.l < mid_level AND last_closed.l > prev_closed.o AND last_closed.c > prev_closed.h
Sweep Confirmation Logic:
Pivot Detection : Uses ta.pivothigh(high, 1, 2) and ta.pivotlow(low, 1, 2)
Touch Detection : Price must touch T-spot level (high > level OR open > level) AND close opposite
Confirmation Requirements : Pivot must form before touch, close must break beyond pivot level
Alert Trigger : Sweep confirmed when all conditions are met
Silver T-Spot Conditions:
Special T-spots during specific market hours (4th-5th candle of day or 4th candle after 1PM ET) with additional confirmation requirements.
HTF Auto-Detection:
Automatically selects appropriate higher timeframes: 1m→15m, 3m→30m, 5m→1h, 15m→4h, 30m-1h→1D, 4h-8h→1W, 1D→1M.
Based on HTF Candles by Fadi, enhanced with T-spot detection, sweep logic, TTFM labeling system, and comprehensive alert functionality.
Note: This tool is for educational purposes and should be used in conjunction with proper risk management and market analysis.

Chimera [theUltimator5]In myth, the chimera is an “impossible” hybrid—lion, goat, and serpent fused into one—striking to look at and formidable in presence. The word has come to mean a beautiful, improbable union of parts that shouldn’t work together, yet do.
Chimera is a dual-mode market context tool that blends a multi-input oscillator with classic ADX/DI trend strength, plus optional multi-timeframe “gap-line” tracking. Use it to visualize regime (trend vs. range), momentum swings around an adaptive midline, and higher timeframe (HTF) reference levels that auto-terminate on touch/cross.
Modes
1) Oscillator view
A smoothed composite of five common inputs—RSI, MACD (oscillator), Bollinger position, Stochastic, and an ATR/DI-weighted bias. Each is normalized to a comparable 0–100 style scale, averaged, and plotted as a candle-style oscillator (short vs. long smoothing, wickless for clarity). A dynamic midline with standard-deviation bands frames neutral → bearish/bullish zones. Colors ramp from neutral to your chosen Oversold/Overbought endpoints; consolidation can override to white.
Here is a description of the (5) signals used to calculate the sentiment oscillator:
RSI (14): Measures recent momentum by comparing average gains vs. losses. High = strength after advances; low = weakness after declines. (Z-score normalized to 0–100.)
MACD oscillator (12/26/9): Uses the difference between MACD and its signal (histogram) to gauge momentum shifts. Positive = bullish tilt; negative = bearish. (Z-score normalized.)
Bollinger Bands position (20, 2): Locates price within the bands (0–100 from lower → upper). Near upper suggests strength/expansion; near lower suggests weakness/contraction. (Then normalized.)
Stochastic (14, 3, 3): Shows where the close sits within the recent high-low range, smoothed via %D. Higher values = closes near highs; lower = near lows. (Scaled 0–100.)
ATR/DI composite (14): Volatility-weighted directional bias: (+DI − −DI) amplified by ATR as a % of price and its relative average. Positive = bullish pressure with volatility; negative = bearish. (Rank/scale normalized.)
All five are normalized and averaged into one composite, then smoothed (short/long) and compared to an adaptive midline with bands.
2) ADX view
Shows ADX, +DI, –DI with user-defined High Threshold. Transparency and color shift with regime. When ADX is strong, a directional “fire/ice” gradient fills the area between ADX and the high threshold, biased toward the dominant DI; when ADX is weak, a soft white fade highlights low-trend conditions.
HTF gap-line tracking (optional; both modes)
Detects “gap-like” reference levels after weak-trend consolidation flips into a sudden DI jump.
Anchors a line at the event bar’s open and auto-terminates upon first touch/cross (tick-size tolerance).
Auto-selects up to three higher timeframes suited to your chart resolution and prints non-overlapping lines with labels like 1H / 4H / 1D. Lower-priority duplicates are suppressed to reduce clutter.
Confirmation / repaint notes
Signals and lines finalize on bar close of the relevant timeframe.
HTF elements update only on the HTF bar close. During a forming bar they may appear transiently.
Line removal finalizes after the bar that produced the touch/cross closes.
Visual cues & effects
Oscillator candles: Open/High = long smoothing; Low/Close = short smoothing (no wicks).
Adaptive bands: Midline ± StdDev Multiplier × stdev of the blended series.
Consolidation tint: Optional white backdrop/candles when the consolidation condition is true (balance + low ADX).
Breakout VFX (optional): With strong DI/ADX and Bollinger breaks, renders a subtle “fire” flare above upper-band thrusts or “ice” shelf below lower-band thrusts.
Inputs (high-level)
Visual Style: Oscillator or ADX.
General (Oscillator): Lookback Period, Short/Long Smoothing, Standard Deviation Multiplier.
Color (Oscillator): Oversold/Overbought colors for gradient endpoints.
Plot (Oscillator): Show Candles, Show Slow MA Line, Show Individual Component (RSI/MACD/BB/Stoch/ATR).
Table (Oscillator): Show Information Table & position (compact dashboard of component values + status).
ADX / Gaps / VFX (both modes): ADX High Threshold, Highlight Backgrounds, Show Gap Labels, Visual Overlay Effects, and color choices for current-TF & HTF lines.
HTF selection: Automatic ladder (3 tiers) based on your chart timeframe.
Alerts (built-in)
Buy Signal – Primary: Oscillator exits oversold.
Sell Signal – Primary: Oscillator exits overbought.
Gap Fill Line Created (Any TF)
Gap Fill Line Terminated (Any TF)
ADX Crossed ABOVE/BELOW Low Threshold
ADX Crossed ABOVE/BELOW High Threshold
Consolidation Started
Alerts evaluate on the close of the relevant timeframe.
How to read it (quick guide)
Pick your lens: Oscillator for blended momentum around an adaptive midline; ADX for trend strength and DI skew.
Watch extremes & mean re-entries (Oscillator): Approaches to the top/bottom band show persistent momentum; returns toward the midline show normalization.
Check regime (ADX): Below Low = low-trend; above High = strong trend, with “fire/ice” bias toward +DI/–DI.
Track gap lines: Fresh labels mark new reference levels; lines auto-remove on first interaction. HTF lines add context but finalize only on HTF close.
The uniqueness from this indicator comes from multiple areas:
1. A unique multi-timeframe algorithm detects gap fill zones and plots them on the chart.
2. Visual effects for both visual modes were hand crafted to provide a visually stunning and intuitive interface.
3. The algorithm to determine sentiment uses a unique blend of weight and sensitivity adjustment to create a plot with elastic upper and lower bounds based off historical volatility and price action.
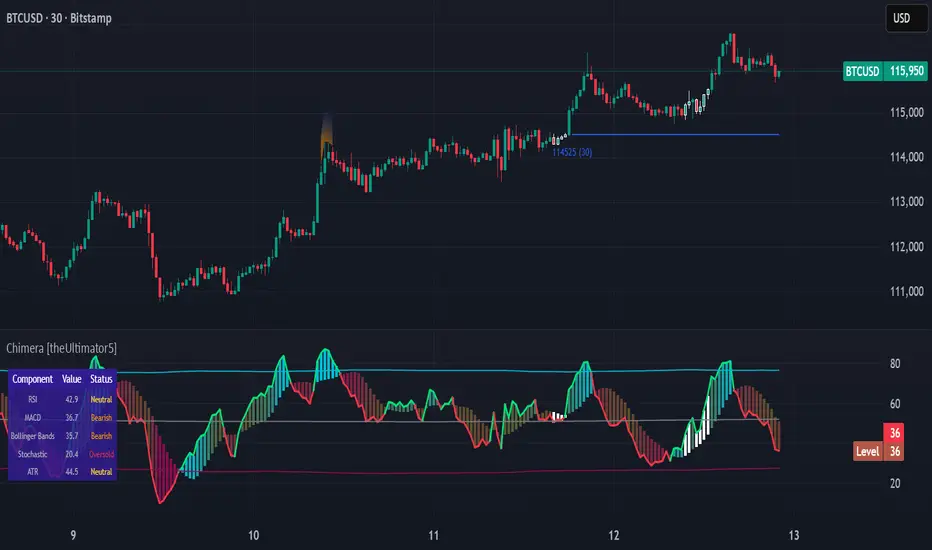
Hull Suite Strategy with Time Filter. it This script filter the initial false signal at the opening of market

Optimized SMC Dashboard - by MinkyJuiceSMC - all in one
all SMC confluences are included, fully automated and customisable
enjoy, made by MinkyJuice
No Turd Burglars, please
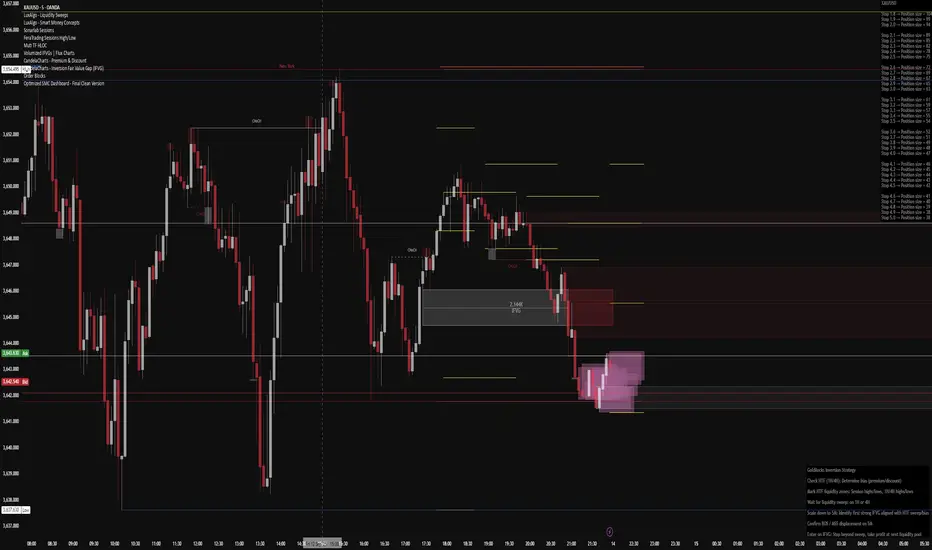
Volatility Momentum Score | Lyro RSVolatility Momentum Score | Lyro RS
Overview
The Volatility Momentum Score (VMS) combines price movement and volatility into a single, easy-to-read signal. Using z-scores, standard deviation bands, and flexible display modes, it helps traders identify trends, overbought/oversold conditions, and potential reversals quickly and effectively.
Key Features
Price + Volatility Blend
Tracks price action and volatility with separate z-scores and merges them into a unified momentum score.
Standard Deviation Bands
Upper and lower bands highlight extreme readings.
Adjustable multipliers allow for fine-tuning sensitivity.
Two Signal Modes
Trend Mode: Plots “Long” and “Short” signals when momentum crosses bands.
Reversion Mode: Colors the chart background when the score indicates stretched conditions.
Overbought & Oversold Alerts
▲ markers indicate oversold conditions.
▼ markers indicate overbought conditions.
Custom Colors
Four preset color themes or fully customizable bullish/bearish colors.
Clear Visuals
Dynamic line coloring based on momentum.
Candles recolored at signal points.
Background shading for quick visual assessment.
How It Works
Calculates z-scores for both price and volatility.
Blends the z-scores into a single average score.
Compares the score against dynamic upper and lower bands.
Triggers signals, markers, or background shading depending on the chosen display mode.
Practical Use
Ride trends: Follow Trend Mode signals to align with momentum.
Spot reversals: Watch ▲ and ▼ markers when markets are overextended.
Stay aware: Background shading highlights potentially overheated conditions.
Customization
Set lookback lengths for price, volatility, and bands.
Adjust band multipliers for more or less sensitive signals.
Choose between Trend or Reversion mode based on trading style.
Select color themes or create custom palettes.
⚠️ Disclaimer
This indicator is a technical analysis tool and does not guarantee results. It should be used alongside other methods and proper risk management. The creators are not responsible for any financial decisions based on its signals.

Fundamentals PanelFundamentals Panel Description
The Fundamentals Panel is a versatile Pine Script indicator that displays key financial metrics—Market Cap, P/E Ratio, P/S Ratio, and PEG Ratio—in a clean, customizable table on your TradingView chart. Designed for investors and traders, this tool brings essential company fundamentals directly to your chart, saving time and enhancing decision-making.
Quick Insights: View critical valuation metrics (Market Cap, P/E, P/S, PEG) at a glance without leaving your chart, ideal for fundamental analysis or screening stocks.
Customizable Display: Toggle each metric on or off via input settings to focus on what matters most to your strategy.
Adjustable Font Size: Choose from Small, Normal, or Large text sizes to ensure readability suits your chart setup and screen preferences.
Reliable Data: Pulls data directly from TradingView’s financial database, using diluted shares and trailing metrics for accuracy across most stocks.
Debugging Support: Includes hidden plots (visible in the Data Window) to verify raw data like shares outstanding, revenue, and PEG, helping you trust the numbers.
How It Works
The indicator fetches:
Market Cap: Calculated using diluted shares outstanding and current price.
P/E Ratio: Price divided by trailing twelve-month (TTM) diluted EPS.
P/S Ratio: Market cap divided by TTM total revenue.
PEG Ratio: Trailing PEG from TradingView’s data, with an additional calculated PEG for cross-checking.
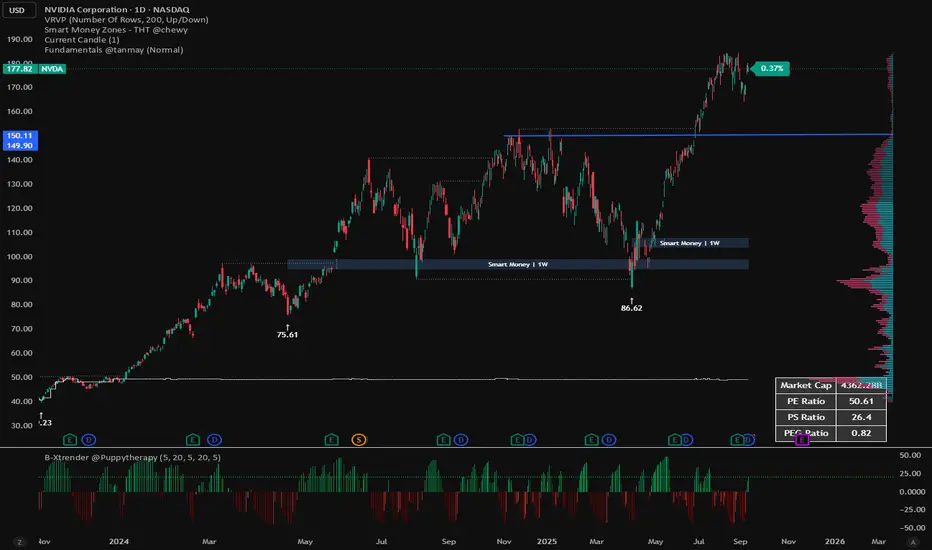
inside forex vip📌 SuperTrend
Based on:
ATR Period (default 10).
Multiplier ATR (default 3).
Calculates the trend direction (upward/downward).
Generates buy/sell signals:
Buy: Positive crossover with EMA color matching (bullish).
Sell: Negative crossover with EMA color matching (bearish).
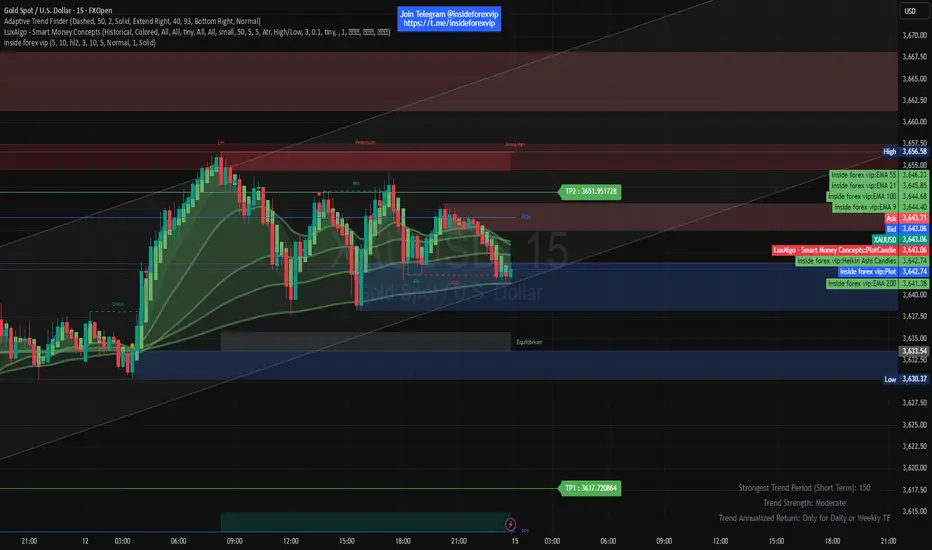
Smart Money Concepts with RSI/MA Signalit gives an alert when price is in bullish ob and rsi crossover SMA

GC Checklist Signals (All Timeframes, v6)GC (COMEX Gold) checklist strategy with a 3:1 reward-to-risk to your training bot. It enforces your rules:
Heiken Ashi chart logic for color, wicks, and doji detection
100-EMA filter (only buys above / sells below)
Market structure: higher-low above EMA for buys; lower-high below EMA for sells (simple pivot check)
Clean pullback: at least 2 opposite-color candles; clean = no top wicks (buys) / no bottom wicks (sells)
Entry: on high-volume doji (body ≤ ~12% of range and volume ≥ last 1–3 candles), as soon as it closes
Stops: sell = above doji high; buy = below doji low


AI+ Scalper [BigMoneyMazz Enhanced]Overview:
A professional-grade multi-factor trading indicator that combines trend, momentum, volatility, and volume analysis into a single composite oscillator. It provides clear visual buy/sell signals on your chart with automatic stop-loss and take-profit levels.
How It Works:
4-Way Market Analysis: Analyzes trend strength (ADX), momentum (your choice of 3 oscillators), volatility (ATR), and volume (OBV)
Smart Signal Generation: Only generates signals when multiple factors align (price above/below dynamic thresholds, trend confirmation, and sufficient volatility)
Visual Trading Plan: Plots clear LONG/SHORT labels on your chart with dashed lines showing exact stop-loss (red) and take-profit (green) levels
Live Dashboard: Real-time monitoring of all market conditions in a handy table
Key Features:
🎯 Clear Chart Signals: Green "LONG" and red "SHORT" labels with arrows
⚡ Risk Management: Automatic ATR-based stop-loss and take-profit levels
📊 Smart Dashboard: All key metrics in one view (ADX, Oscillator, Trend, Volume)
🔒 Non-Repainting: Uses only confirmed closing prices for reliable signals
⚙️ Fully Customizable: Adjust every aspect to your trading style
Recommended Settings for Day Trading:
Timeframe: 5-15 minutes
ATR Multiplier SL: 1.5 (tight stop)
ATR Multiplier TP: 3.0 (2:1 risk-reward)
Momentum Mode: Stochastic RSI (most responsive)
Use HTF Filter: ON (15-minute timeframe)
Latching Mode: ON (avoids whipsaws)
Recommended Settings for Swing Trading:
Timeframe: 1H-4H
ATR Multiplier SL: 2.0
ATR Multiplier TP: 4.0 (2:1 risk-reward)
Momentum Mode: Fisher RSI (smoother)
Use HTF Filter: ON (4H or Daily timeframe)
Latching Mode: ON
How to Use:
Wait for LONG/SHORT labels to appear on your chart
Enter trade when price touches your preferred entry level
Set stop-loss at the red dashed line
Set take-profit at the green dashed line
Use the dashboard to confirm market conditions (ADX > 25 = strong trend)
Signal Interpretation:
LONG ▲: Strong buy signal - trend bullish, oscillator above upper threshold
SHORT ▼: Strong sell signal - trend bearish, oscillator below lower threshold
EXIT: Close position (SL/TP hit)
Pro Tip: The dashboard is your best friend! Check that ADX is above 25 (strong trend) and volume is confirming before entering any trade.
This indicator works best as a confirmation tool alongside your existing strategy rather than a completely automated system. Always practice proper risk management!
CandelaCharts - Projections 📝 Overview
Projections turns a hand-picked swing window into clean, forward price levels. You pick a time range and an anchor (wick or body); the tool finds that window’s reference extremes (Level 0 & Level 1) and then projects directional extensions (e.g., −1, −2, −2.5, −4) in the chosen bias (Auto / Bullish / Bearish). It draws flat lines across the chart with optional labels so you can plan targets, fade zones, or continuation levels at a glance.
📦 Features
This section highlights the core capabilities you’ll rely on most.
Window-based engine — Define a start/end time; the script records open/high/low/close inside that window and builds levels from those extremes.
Two anchor styles — Project from Wick extremes (Hi/Lo) or Body extremes (max/min of OHLC at the high/low bars).
Directional bias — Auto (up if net up; doji resolves by wick dominance), or force Bullish/Bearish for one-sided extensions.
Default & Custom levels — Toggle pre-sets (−1/−2/−2.5/−4) or enter your own comma-separated list (decimals supported).
Readable drawings — Per-level colors (defaults) or unified bull/bear color (custom), with label size, line style, and width controls.
⚙️ Settings
Use these controls to define the window, pick the projection style, and customize the visuals.
Settings (Core)
From / To — Start and end timestamps of the capture window (everything is computed from this segment).
Bias — Auto / Bullish / Bearish. Guides which way negative levels extend (up for bull, down for bear).
Anchor — Wick uses Hi/Lo; Body uses the body extremes at the high/low bars.
Levels
Levels = Default — Enable any of −1, −2, −2.5, −4 and set each color.
Levels = Custom — Provide your own list (e.g., “−0.5, −1, −1.5, −3”) and pick Bullish/Bearish colors. (Custom uses one color per side.)
Style
Labels — Show/Hide the numeric level tag at the line’s right edge; choose label size.
Lines — Pick solid/dashed/dotted and line width.
⚡️ Showcase
Bearish Projection
Bullish Projection
📒 Usage
Follow these steps to set the window, generate levels, and turn them into a trade plan.
1) Mark the window — Set From/To around the swing you want to project (e.g., prior day, news impulse, weekly move).
2) Choose bias — Auto adapts; or lock Bullish/Bearish if you only want upside or downside projections.
3) Pick anchor — Wick = raw extremes; Body = more conservative reference. Body helps when single-print wicks distort levels.
4) Select levels — Toggle defaults or add a custom list. Negative values (−1, −2, …) extend beyond the reference extreme in the bias direction. (Level 0 and 1 are always drawn as the reference pair.)
5) Style it — Turn labels on, adjust size, and set line style/width for visibility on your timeframe.
6) Trade plan — Treat projections as reaction/continuation zones: scale out into −1/−2/−2.5, watch for fades back into the band, or ride continuation when price accepts beyond a level.
🚨 Alerts
There are no built-in alerts in this version.
⚠️ Disclaimer
Trading involves significant risk, and many participants may incur losses. The content on this site is not intended as financial advice and should not be interpreted as such. Decisions to buy, sell, hold, or trade securities, commodities, or other financial instruments carry inherent risks and are best made with guidance from qualified financial professionals. Past performance is not indicative of future results.

DZ/SZ - HFM by MamaRight-Empty Wick Zones (MTF) draws Supply/Demand zones from the remaining wick of adjacent opposite-color candles (Classic & Non-classic rules). Zones extend right only through empty space and stop at the first touching candle. Multi-TF scan (H1/H4/1D/1W/1M) with TF-colored boxes and labels showing Demand/Supply + H/L.
Demand (red → green, adjacent):
Classic: if the red candle’s lower wick is longer than the green’s → zone = (the “excess” red wick).
Non-classic: if the red’s lower wick is shorter or equal → zone = (use the longer green wick).
Supply (green → red, adjacent):
Classic: if the green candle’s upper wick is longer than the red’s → zone = (the “excess” green wick).
Non-classic: if the green’s upper wick is shorter or equal → zone = (use the longer red wick).
After a zone is created, the box extends right and terminates at the very first bar whose price range (body or wick) overlaps the zone → ensures the plotted area is genuinely right-empty.
What you see
Zone boxes with distinct colors per timeframe (e.g., H1/H4/1D/1W/1M).
Optional labels on each box: H4 Demand / H1 Supply, plus H/L prices of the zone.
Labels can sit at the left edge or follow the right edge of the box.
Inputs
Toggles: Demand Classic / Demand Non-classic / Supply Classic / Supply Non-classic.
Timeframes to scan: H1, H4, 1D, 1W, 1M.
Min zone thickness (price): minimum height of a zone (in price units).
Initial right extension (bars): initial box length; the script auto-cuts at the first touch.
Show labels / place labels at the right edge.
How to use (suggestion)
Use higher TF (e.g., 1D) for bias and lower TFs (H1/H4) for execution zones.
Keep only the rule set (Classic/Non-classic) that matches your playbook.
Treat zones as areas of interest—wait for your own confirmations (e.g., swing rejection, wick re-entry, structure shift, volume cues) and manage risk accordingly.
Notes
Because zones are sourced from higher TFs via request.security, the drawing can update intrabar; a zone is final once the source TF bar closes.
Min zone thickness uses price units (e.g., on XAUUSD, 1.00 ≈ $1).
This tool is an analytical aid, not financial advice or an entry/exit signal.
อินดิเคเตอร์ DZ/SZ - HFM by Mama ใช้หา Demand/Supply zone จาก “ไส้ที่เหลือ” ของ คู่แท่งสีตรงข้ามที่ติดกัน แล้ววาดเป็นกล่อง ยืดไปทางขวาเฉพาะช่วงที่ว่าง และ หยุดตรงแท่งแรกที่เข้ามาแตะโซน รองรับหลาย Timeframe (H1/H4/1D/1W/1M) พร้อมสีแยก TF และป้ายกำกับ Demand/Supply + H/L ของโซน
รายละเอียดการทำงาน (ไทย)
แนวคิดหลัก
Demand: เลือกคู่ แดง→เขียว ที่ “ติดกัน”
Classic: ถ้า ไส้ล่าง ของแท่งแดงยาวกว่าแท่งเขียว → โซน =
Non-classic: ถ้า ไส้ล่าง ของแท่งแดงสั้นกว่าหรือเท่าเขียว → โซน =
Supply: เลือกคู่ เขียว→แดง ที่ “ติดกัน”
Classic: ถ้า ไส้บน ของแท่งเขียวยาวกว่าแท่งแดง → โซน =
Non-classic: ถ้า ไส้บน ของแท่งเขียวสั้นกว่าหรือเท่าแดง → โซน =
เมื่อสร้างโซนแล้ว กล่องจะ ยืดทางขวา ไปเรื่อย ๆ และ หยุดทันทีเมื่อมีแท่งแรกที่ช่วงราคา (ไส้หรือตัวแท่ง) ทับซ้อนกับโซน ⇒ ได้ “พื้นที่ขวาว่าง” ตามโจทย์
สิ่งที่แสดงบนกราฟ
กล่องโซนสีตาม Timeframe (เช่น H1=ฟ้า, H4=เขียว, 1D=ส้ม, 1W=ม่วง, 1M=เทา)
Label ที่มุมกล่อง: H4 Demand / H1 Supply + ราคาของ High/Low ของโซน
(เลือกวาง ซ้าย หรือ ขอบขวา ของกล่องได้ในตั้งค่า)
ตัวเลือกสำคัญใน Settings
เปิด/ปิด: Demand Classic / Demand Non-classic / Supply Classic / Supply Non-classic
เลือก TF ที่จะสแกน: H1, H4, 1D, 1W, 1M
Min zone thickness (price): กำหนด “ความหนา” ขั้นต่ำของโซน (หน่วยเป็นราคา เช่น XAUUSD = ดอลลาร์)
Initial right extension (bars): ความยาวยืดเริ่มต้น (อินดี้จะตัดให้สั้นลงเองเมื่อมีแท่งมาแตะ)
แสดง Label บนโซน และ วาง Label ที่ขอบขวากล่อง
วิธีใช้แนะนำ
เลือก TF ที่ต้องการ (เช่น ให้ H1/H4 เป็นโซนเทรดละเอียด และ 1D ใช้กรองทิศ)
เปิดเฉพาะโหมด (Classic/Non-classic) ที่ตรงกับแนวคิดการเทรดของคุณ
ใช้โซนเป็นบริเวณ “สนใจ” แล้วรอพฤติกรรมราคา/สัญญาณยืนยันเสริม (เช่น สวิงกลับ, rejection wick, โวลลุ่ม, หรือโครงสร้างจบคลื่น)
หมายเหตุสำคัญ
อินดี้ใช้ข้อมูลข้าม TF; สัญญาณจาก TF สูง อาจเปลี่ยนระหว่างแท่งยังไม่ปิด (ลักษณะ intrabar update) โซนจะ “นิ่ง” เมื่อแท่งของ TF ต้นทาง ปิดแล้ว
หน่วยของ Min zone thickness เป็น หน่วยราคา ไม่ใช่ pips (XAUUSD: 1.00 = $1)
อินดี้ไม่ได้ให้สัญญาณเข้า–ออกอัตโนมัติ ควรใช้ร่วมกับแผนเทรดและการจัดการความเสี่ยง

WickDomits wickdom, thats all you need to know! it tells when the candle is in control and when its not

Big Player Buy/Sell SignalHow It Works:
Detects volume spikes over SMA of recent volume.
Signals a buy if there’s a green candle near a recent swing low on high volume (possible big player accumulation).
Signals a sell if there’s a red candle near a swing high on high volume (possible big player distribution).
This is a proxy, not a direct measure of institutional trades, but it often works surprisingly well in liquid markets like Nifty 50 or Bank Nifty.
If you want, I can make an advanced version that combines RSI, EMA, and first occurrence detection for higher accuracy in catching big player moves.

TPO Levels [VAH/POC/VAL] with Poor H/L, Single Prints & NPOCs### 🎯 Advanced Market Profile & Key Level Analysis
This script is a unique and comprehensive technical analysis tool designed to help traders understand market structure, value, and key liquidity levels using the principles of **Auction Market Theory** and **Market Profile**.
This script is unique (and shouldn't be censored) because :
It allows large history of levels to be displayed
Accurate as possible tick size
Doesn't draw a profile but only the actual levels
Supports multi-timeframe levels even on the daily mode giving macro context
There is no indicator out there that does it
While these concepts are universal, this indicator was built primarily for the dynamic, 24/7 nature of the **cryptocurrency market**. It helps you move beyond simple price action to understand *why* the market is moving, which is especially crucial in the volatile crypto space.
### ## 📊 The Concepts Behind the Calculations
To use this script effectively, it's important to understand the core concepts it is built upon. The entire script is self-contained and does not require other indicators.
* **What is Market Profile?**
Market Profile is a unique charting technique that organizes price and time data to reveal market structure. It's built from **Time Price Opportunities (TPOs)**, which are 30-minute periods of market activity. By stacking these TPOs, the script builds a distribution, showing which price levels were most accepted (heavily traded) and which were rejected (lightly traded) during a session.
* **What is the Value Area (VA)?**
The Value Area is the heart of the profile. It represents the price range where **70%** of the session's trading volume occurred. This is considered the "fair value" zone where both buyers and sellers were in general agreement.
* **Point of Control (POC):** The single price level with the most TPOs. This was the most accepted or "fairest" price of the session and acts as a gravitational line for price.
* **Value Area High (VAH):** The upper boundary of the 70% value zone.
* **Value Area Low (VAL):** The lower boundary of the 70% value zone.
VAH and VAL are dynamic support and resistance levels. Trading outside the previous session's value area can signal the start of a new trend.
***
### ## 📈 Key Features Explained
This script automatically calculates and displays the following critical market-generated information:
* **Multi-Timeframe Market Profile**
Automatically draws Daily, Weekly, and Monthly profiles, allowing you to analyze market structure across different time horizons. The script preserves up to 20 historical sessions to provide deep market context.
* **Naked Point of Control (nPOC)**
A "Naked" POC is a Point of Control from a previous session that has **not** been revisited by price. These levels often act as powerful magnets for price, representing areas of unfinished business that the market may seek to retest. The script tracks and displays Daily, Weekly, and Monthly nPOCs until they are touched.
* **Single Prints (Imbalance Zones)**
A Single Print is a price level where only one TPO traded during the session's development. This signifies a rapid, aggressive price move and an imbalanced market. These areas, like gaps in a traditional chart, are frequently revisited as the market seeks to "fill in" these thin parts of the profile.
* **Poor Structure (Unfinished Auctions)**
A **Poor High** or **Poor Low** occurs when the top or bottom of a profile is flat, with two or more TPOs at the extreme price. This suggests that the auction in that direction was weak and inconclusive. These weak structures often signal a high probability that price will eventually break that high or low.
***
### ## 💡 How to Use This Indicator
This tool is not a signal generator but an analytical framework to improve your trading decisions.
1. **Determine Market Context:** Start by asking: Is the current price trading *inside* or *outside* the previous session's Value Area?
* **Inside VA:** The market is in a state of balance or range-bound. Look for trades between the VAH and VAL.
* **Outside VA:** The market is in a state of imbalance and may be starting a trend. Look for continuation or acceptance of prices outside the prior value.
2. **Identify Key Levels:**
* Use historical **nPOCs** as potential profit targets or areas to watch for a price reaction.
* Treat historical **VAH** and **VAL** levels as significant support and resistance zones.
* Note where **Single Prints** are. These are often price magnets that may get "filled" in the future.
3. **Spot Weakness:**
* A **Poor High** suggests weak resistance that may be easily broken.
* A **Poor Low** suggests weak support, signaling a potential for a continued move lower if broken.
***
### ## ⚙️ Customization & Crypto Presets
The indicator is highly customizable, allowing you to change colors, transparency, the number of historical sessions, and more.
To help traders get started quickly, the indicator includes **built-in layout presets** specifically calibrated for major cryptocurrencies: ** BINANCE:BTCUSDT.P , BINANCE:ETHUSDT.P , and BINANCE:SOLUSDT.P **. These presets automatically adjust key visual parameters to better suit the unique price characteristics and volatility of each asset, providing an optimized view right out of the box.
***
### ## ⚠️ Disclaimer
This indicator is a tool for market analysis and should not be interpreted as direct buy or sell signals. It provides information based on historical price action, which does not guarantee future results. Trading involves significant risk, and you should always use proper risk management. This script is designed for use on standard chart types (e.g., Candlesticks, Bar) and may produce misleading information on non-standard charts.

order block new 113/// This work is licensed under a Attribution-NonCommercial-ShareAlike 4.0 International (CC BY-NC-SA 4.0) creativecommons.org
// © RUDYBANK INDICATOR - formerly know as RUDY INDICATOR
//@version=5
indicator("Price Action Concepts ", shorttitle = "RUDYINDICATOR-V1
- Price Action RUDYINDICATOR ", overlay = true, max_lines_count = 500, max_labels_count = 500, max_boxes_count = 500, max_bars_back = 500, max_polylines_count = 100)
//-----------------------------------------------------------------------------{
//Boolean set
//-----------------------------------------------------------------------------{
s_BOS = 0
s_CHoCH = 1
i_BOS = 2
i_CHoCH = 3
i_pp_CHoCH = 4
green_candle = 5
red_candle = 6
s_CHoCHP = 7
i_CHoCHP = 8
boolean =
array.from(
false
, false
, false
, false
, false
, false
, false
, false
, false
)
//-----------------------------------------------------------------------------{
// User inputs
//-----------------------------------------------------------------------------{
show_swing_ms = input.string ("All" , "Swing        " , inline = "1", group = "MARKET STRUCTURE" , options = )
show_internal_ms = input.string ("All" , "Internal     " , inline = "2", group = "MARKET STRUCTURE" , options = )
internal_r_lookback = input.int (5 , "" , inline = "2", group = "MARKET STRUCTURE" , minval = 2)
swing_r_lookback = input.int (50 , "" , inline = "1", group = "MARKET STRUCTURE" , minval = 2)
ms_mode = input.string ("Manual" , "Market Structure Mode" , inline = "a", group = "MARKET STRUCTURE" , tooltip = " Use selected lenght Use automatic lenght" ,options = )
show_mtf_str = input.bool (true , "MTF Scanner" , inline = "9", group = "MARKET STRUCTURE" , tooltip = "Display Multi-Timeframe Market Structure Trend Directions. Green = Bullish. Red = Bearish")
show_eql = input.bool (false , "Show EQH/EQL" , inline = "6", group = "MARKET STRUCTURE")
plotcandle_bool = input.bool (false , "Plotcandle" , inline = "3", group = "MARKET STRUCTURE" , tooltip = "Displays a cleaner colored candlestick chart in place of the default candles. (requires hiding the current ticker candles)")
barcolor_bool = input.bool (false , "Bar Color" , inline = "4", group = "MARKET STRUCTURE" , tooltip = "Color the candle bodies according to market strucutre trend")
i_ms_up_BOS = input.color (#089981 , "" , inline = "2", group = "MARKET STRUCTURE")
i_ms_dn_BOS = input.color (#f23645 , "" , inline = "2", group = "MARKET STRUCTURE")
s_ms_up_BOS = input.color (#089981 , "" , inline = "1", group = "MARKET STRUCTURE")
s_ms_dn_BOS = input.color (#f23645 , "" , inline = "1", group = "MARKET STRUCTURE")
lvl_daily = input.bool (false , "Day   " , inline = "1", group = "HIGHS & LOWS MTF")
lvl_weekly = input.bool (false , "Week " , inline = "2", group = "HIGHS & LOWS MTF")
lvl_monthly = input.bool (false , "Month" , inline = "3", group = "HIGHS & LOWS MTF")
lvl_yearly = input.bool (false , "Year  " , inline = "4", group = "HIGHS & LOWS MTF")
css_d = input.color (color.blue , "" , inline = "1", group = "HIGHS & LOWS MTF")
css_w = input.color (color.blue , "" , inline = "2", group = "HIGHS & LOWS MTF")
css_m = input.color (color.blue , "" , inline = "3", group = "HIGHS & LOWS MTF")
css_y = input.color (color.blue , "" , inline = "4", group = "HIGHS & LOWS MTF")
s_d = input.string ('⎯⎯⎯' , '' , inline = '1', group = 'HIGHS & LOWS MTF' , options = )
s_w = input.string ('⎯⎯⎯' , '' , inline = '2', group = 'HIGHS & LOWS MTF' , options = )
s_m = input.string ('⎯⎯⎯' , '' , inline = '3', group = 'HIGHS & LOWS MTF' , options = )
s_y = input.string ('⎯⎯⎯' , '' , inline = '4', group = 'HIGHS & LOWS MTF' , options = )
ob_show = input.bool (true , "Show Last    " , inline = "1", group = "VOLUMETRIC ORDER BLOCKS" , tooltip = "Display volumetric order blocks on the chart Ammount of volumetric order blocks to show")
ob_num = input.int (5 , "" , inline = "1", group = "VOLUMETRIC ORDER BLOCKS" , tooltip = "Orderblocks number", minval = 1, maxval = 10)
ob_metrics_show = input.bool (true , "Internal Buy/Sell Activity" , inline = "2", group = "VOLUMETRIC ORDER BLOCKS" , tooltip = "Display volume metrics that have formed the orderblock")
css_metric_up = input.color (color.new(#089981, 50) , "         " , inline = "2", group = "VOLUMETRIC ORDER BLOCKS")
css_metric_dn = input.color (color.new(#f23645 , 50) , "" , inline = "2", group = "VOLUMETRIC ORDER BLOCKS")
ob_swings = input.bool (false , "Swing Order Blocks" , inline = "a", group = "VOLUMETRIC ORDER BLOCKS" , tooltip = "Display swing volumetric order blocks")
css_swing_up = input.color (color.new(color.gray , 90) , "                 " , inline = "a", group = "VOLUMETRIC ORDER BLOCKS")
css_swing_dn = input.color (color.new(color.silver, 90) , "" , inline = "a", group = "VOLUMETRIC ORDER BLOCKS")
ob_filter = input.string ("None" , "Filtering             " , inline = "d", group = "VOLUMETRIC ORDER BLOCKS" , tooltip = "Filter out volumetric order blocks by BOS/CHoCH/CHoCH+", options = )
ob_mitigation = input.string ("Absolute" , "Mitigation           " , inline = "4", group = "VOLUMETRIC ORDER BLOCKS" , tooltip = "Trigger to remove volumetric order blocks", options = )
ob_pos = input.string ("Precise" , "Positioning          " , inline = "k", group = "VOLUMETRIC ORDER BLOCKS" , tooltip = "Position of the Order Block Cover the whole candle Cover half candle Adjust to volatility Same as Accurate but more precise", options = )
use_grayscale = input.bool (false , "Grayscale" , inline = "6", group = "VOLUMETRIC ORDER BLOCKS" , tooltip = "Use gray as basic order blocks color")
use_show_metric = input.bool (true , "Show Metrics" , inline = "7", group = "VOLUMETRIC ORDER BLOCKS" , tooltip = "Show volume associated with the orderblock and his relevance")
use_middle_line = input.bool (true , "Show Middle-Line" , inline = "8", group = "VOLUMETRIC ORDER BLOCKS" , tooltip = "Show mid-line order blocks")
use_overlap = input.bool (true , "Hide Overlap" , inline = "9", group = "VOLUMETRIC ORDER BLOCKS" , tooltip = "Hide overlapping order blocks")
use_overlap_method = input.string ("Previous" , "Overlap Method    " , inline = "Z", group = "VOLUMETRIC ORDER BLOCKS" , tooltip = " Preserve the most recent volumetric order blocks Preserve the previous volumetric order blocks", options = )
ob_bull_css = input.color (color.new(#089981 , 90) , "" , inline = "1", group = "VOLUMETRIC ORDER BLOCKS")
ob_bear_css = input.color (color.new(#f23645 , 90) , "" , inline = "1", group = "VOLUMETRIC ORDER BLOCKS")
show_acc_dist_zone = input.bool (false , "" , inline = "1", group = "Accumulation And Distribution")
zone_mode = input.string ("Fast" , "" , inline = "1", group = "Accumulation And Distribution" , tooltip = " Find small zone pattern formation Find bigger zone pattern formation" ,options = )
acc_css = input.color (color.new(#089981 , 60) , "" , inline = "1", group = "Accumulation And Distribution")
dist_css = input.color (color.new(#f23645 , 60) , "" , inline = "1", group = "Accumulation And Distribution")
show_lbl = input.bool (false , "Show swing point" , inline = "1", group = "High and Low" , tooltip = "Display swing point")
show_mtb = input.bool (false , "Show High/Low/Equilibrium" , inline = "2", group = "High and Low" , tooltip = "Display Strong/Weak High And Low and Equilibrium")
toplvl = input.color (color.red , "Premium Zone   " , inline = "3", group = "High and Low")
midlvl = input.color (color.gray , "Equilibrium Zone" , inline = "4", group = "High and Low")
btmlvl = input.color (#089981 , "Discount Zone    " , inline = "5", group = "High and Low")
fvg_enable = input.bool (false , "        " , inline = "1", group = "FAIR VALUE GAP" , tooltip = "Display fair value gap")
what_fvg = input.string ("FVG" , "" , inline = "1", group = "FAIR VALUE GAP" , tooltip = "Display fair value gap", options = )
fvg_num = input.int (5 , "Show Last  " , inline = "1a", group = "FAIR VALUE GAP" , tooltip = "Number of fvg to show")
fvg_upcss = input.color (color.new(#089981, 80) , "" , inline = "1", group = "FAIR VALUE GAP")
fvg_dncss = input.color (color.new(color.red , 80) , "" , inline = "1", group = "FAIR VALUE GAP")
fvg_extend = input.int (10 , "Extend FVG" , inline = "2", group = "FAIR VALUE GAP" , tooltip = "Extend the display of the FVG.")
fvg_src = input.string ("Close" , "Mitigation  " , inline = "3", group = "FAIR VALUE GAP" , tooltip = " Use the close of the body as trigger Use the extreme point of the body as trigger", options = )
fvg_tf = input.timeframe ("" , "Timeframe " , inline = "4", group = "FAIR VALUE GAP" , tooltip = "Timeframe of the fair value gap")
t = color.t (ob_bull_css)
invcol = color.new (color.white , 100)
//{----------------------------------------------------------------------------------------------------------------------------------------------}
//{----------------------------------------------------------------------------------------------------------------------------------------------}
//{----------------------------------------------------------------------------------------------------------------------------------------------}
//{----------------------------------------------------------------------------------------------------------------------------------------------}
//{ - UDT }
//{----------------------------------------------------------------------------------------------------------------------------------------------}
//{----------------------------------------------------------------------------------------------------------------------------------------------}
//{----------------------------------------------------------------------------------------------------------------------------------------------}
//{----------------------------------------------------------------------------------------------------------------------------------------------}
type bar
float o = open
float c = close
float h = high
float l = low
float v = volume
int n = bar_index
int t = time
type Zphl
line top
line bottom
label top_label
label bottom_label
bool stopcross
bool sbottomcross
bool itopcross
bool ibottomcross
string txtup
string txtdn
float topy
float bottomy
float topx
float bottomx
float tup
float tdn
int tupx
int tdnx
float itopy
float itopx
float ibottomy
float ibottomx
float uV
float dV
type FVG
box box
line ln
bool bull
float top
float btm
int left
int right
type ms
float p
int n
float l
type msDraw
int n
float p
color css
string txt
bool bull
type obC
float top
float btm
int left
float avg
float dV
float cV
int wM
int blVP
int brVP
int dir
float h
float l
int n
type obD
box ob
box eOB
box blB
box brB
line mL
type zone
chart.point points
float p
int c
int t
type hqlzone
box pbx
box ebx
box lbx
label plb
label elb
label lbl
type ehl
float pt
int t
float pb
int b
type pattern
string found = "None"
bool isfound = false
int period = 0
bool bull = false
type alerts
bool chochswing = false
bool chochplusswing = false
bool swingbos = false
bool chochplus = false
bool choch = false
bool bos = false
bool equal = false
bool ob = false
bool swingob = false
bool zone = false
bool fvg = false
bool obtouch = false
//{----------------------------------------------------------------------------------------------------------------------------------------------}
//{----------------------------------------------------------------------------------------------------------------------------------------------}
//{----------------------------------------------------------------------------------------------------------------------------------------------}
//{----------------------------------------------------------------------------------------------------------------------------------------------}
//{ - End }
//{----------------------------------------------------------------------------------------------------------------------------------------------}
//{----------------------------------------------------------------------------------------------------------------------------------------------}
//{----------------------------------------------------------------------------------------------------------------------------------------------}
//{----------------------------------------------------------------------------------------------------------------------------------------------}
//{----------------------------------------------------------------------------------------------------------------------------------------------}
//{----------------------------------------------------------------------------------------------------------------------------------------------}
//{----------------------------------------------------------------------------------------------------------------------------------------------}
//{----------------------------------------------------------------------------------------------------------------------------------------------}
//{ - General Setup }
//{----------------------------------------------------------------------------------------------------------------------------------------------}
//{----------------------------------------------------------------------------------------------------------------------------------------------}
//{----------------------------------------------------------------------------------------------------------------------------------------------}
//{----------------------------------------------------------------------------------------------------------------------------------------------}
bar b = bar.new()
var pattern p = pattern.new()
alerts blalert = alerts.new()
alerts bralert = alerts.new()
if p.isfound
p.period += 1
if p.period == 50
p.period := 0
p.found := "None"
p.isfound := false
p.bull := na
switch
b.c > b.o => boolean.set(green_candle, true)
b.c < b.o => boolean.set(red_candle , true)
f_zscore(src, lookback) =>
(src - ta.sma(src, lookback)) / ta.stdev(src, lookback)
var int iLen = internal_r_lookback
var int sLen = swing_r_lookback
vv = f_zscore(((close - close ) / close ) * 100,iLen)
if ms_mode == "Dynamic"
switch
vv >= 1.5 or vv <= -1.5 => iLen := 10
vv >= 1.6 or vv <= -1.6 => iLen := 9
vv >= 1.7 or vv <= -1.7 => iLen := 8
vv >= 1.8 or vv <= -1.8 => iLen := 7
vv >= 1.9 or vv <= -1.9 => iLen := 6
vv >= 2.0 or vv <= -2.0 => iLen := 5
=> iLen
var msline = array.new(0)
iH = ta.pivothigh(high, iLen, iLen)
sH = ta.pivothigh(high, sLen, sLen)
iL = ta.pivotlow (low , iLen, iLen)
sL = ta.pivotlow (low , sLen, sLen)
//{----------------------------------------------------------------------------------------------------------------------------------------------}
//{----------------------------------------------------------------------------------------------------------------------------------------------}
//{----------------------------------------------------------------------------------------------------------------------------------------------}
//{----------------------------------------------------------------------------------------------------------------------------------------------}
//{ - End }
//{----------------------------------------------------------------------------------------------------------------------------------------------}
//{----------------------------------------------------------------------------------------------------------------------------------------------}
//{----------------------------------------------------------------------------------------------------------------------------------------------}
//{----------------------------------------------------------------------------------------------------------------------------------------------}
//{----------------------------------------------------------------------------------------------------------------------------------------------}
//{----------------------------------------------------------------------------------------------------------------------------------------------}
//{----------------------------------------------------------------------------------------------------------------------------------------------}
//{----------------------------------------------------------------------------------------------------------------------------------------------}
//{ - ARRAYS }
//{----------------------------------------------------------------------------------------------------------------------------------------------}
//{----------------------------------------------------------------------------------------------------------------------------------------------}
//{----------------------------------------------------------------------------------------------------------------------------------------------}
//{----------------------------------------------------------------------------------------------------------------------------------------------}
hl () =>
= request.security(syminfo.tickerid , 'D' , hl() , lookahead = barmerge.lookahead_on)
= request.security(syminfo.tickerid , 'W' , hl() , lookahead = barmerge.lookahead_on)
= request.security(syminfo.tickerid , 'M' , hl() , lookahead = barmerge.lookahead_on)
= request.security(syminfo.tickerid , '12M', hl() , lookahead = barmerge.lookahead_on)
lstyle(style) =>
out = switch style
'⎯⎯⎯' => line.style_solid
'----' => line.style_dashed
'····' => line.style_dotted
mtfphl(h, l ,tf ,css, pdhl_style) =>
var line hl = line.new(
na
, na
, na
, na
, xloc = xloc.bar_time
, color = css
, style = lstyle(pdhl_style)
)
var line ll = line.new(
na
, na
, na
, na
, xloc = xloc.bar_time
, color = css
, style = lstyle(pdhl_style)
)
var label lbl = label.new(
na
, na
, xloc = xloc.bar_time
, text = str.format('P{0}L', tf)
, color = invcol
, textcolor = css
, size = size.small
, style = label.style_label_left
)
var label hlb = label.new(
na
, na
, xloc = xloc.bar_time
, text = str.format('P{0}H', tf)
, color = invcol
, textcolor = css
, size = size.small
, style = label.style_label_left
)
hy = ta.valuewhen(h != h , h , 1)
hx = ta.valuewhen(h == high , time , 1)
ly = ta.valuewhen(l != l , l , 1)
lx = ta.valuewhen(l == low , time , 1)
if barstate.islast
extension = time + (time - time ) * 50
line.set_xy1(hl , hx , hy)
line.set_xy2(hl , extension , hy)
label.set_xy(hlb, extension , hy)
line.set_xy1(ll , lx , ly)
line.set_xy2(ll , extension , ly)
label.set_xy(lbl, extension , ly)
if lvl_daily
mtfphl(pdh , pdl , 'D' , css_d, s_d)
if lvl_weekly
mtfphl(pwh , pwl , 'W' , css_w, s_w)
if lvl_monthly
mtfphl(pmh , pml, 'M' , css_m, s_m)
if lvl_yearly
mtfphl(pyh , pyl , '12M', css_y, s_y)
//{----------------------------------------------------------------------------------------------------------------------------------------------}
//{----------------------------------------------------------------------------------------------------------------------------------------------}
//{----------------------------------------------------------------------------------------------------------------------------------------------}
//{----------------------------------------------------------------------------------------------------------------------------------------------}
//{ - End }
//{----------------------------------------------------------------------------------------------------------------------------------------------}
//{----------------------------------------------------------------------------------------------------------------------------------------------}
//{----------------------------------------------------------------------------------------------------------------------------------------------}
//{----------------------------------------------------------------------------------------------------------------------------------------------}
//{----------------------------------------------------------------------------------------------------------------------------------------------}
//{----------------------------------------------------------------------------------------------------------------------------------------------}
//{----------------------------------------------------------------------------------------------------------------------------------------------}
//{----------------------------------------------------------------------------------------------------------------------------------------------}
//{ - Market Structure }
//{----------------------------------------------------------------------------------------------------------------------------------------------}
//{----------------------------------------------------------------------------------------------------------------------------------------------}
//{----------------------------------------------------------------------------------------------------------------------------------------------}
//{----------------------------------------------------------------------------------------------------------------------------------------------}
method darkcss(color css, float factor, bool bull) =>
blue = color.b(css) * (1 - factor)
red = color.r(css) * (1 - factor)
green = color.g(css) * (1 - factor)
color.rgb(red, green, blue, 0)
method f_line(msDraw d, size, style) =>
var line id = na
var label lbl = na
id := line.new(
d.n
, d.p
, b.n
, d.p
, color = d.css
, width = 1
, style = style
)
if msline.size() >= 250
line.delete(msline.shift())
msline.push(id)
lbl := label.new(
int(math.avg(d.n, b.n))
, d.p
, d.txt
, color = invcol
, textcolor = d.css
, style = d.bull ? label.style_label_down : label.style_label_up
, size = size
, text_font_family = font.family_monospace
)
structure(bool mtf) =>
msDraw drw = na
bool isdrw = false
bool isdrwS = false
var color css = na
var color icss = na
var int itrend = 0
var int trend = 0
bool bull_ob = false
bool bear_ob = false
bool s_bull_ob = false
bool s_bear_ob = false
n = bar_index
var ms up = ms.new(
array.new()
, array.new< int >()
, array.new()
)
var ms dn = ms.new(
array.new()
, array.new< int >()
, array.new()
)
var ms sup = ms.new(
array.new()
, array.new< int >()
, array.new()
)
var ms sdn = ms.new(
array.new()
, array.new< int >()
, array.new()
)
switch show_swing_ms
"All" => boolean.set(s_BOS , true ), boolean.set(s_CHoCH, true ) , boolean.set(s_CHoCHP, true )
"CHoCH" => boolean.set(s_BOS , false), boolean.set(s_CHoCH, true ) , boolean.set(s_CHoCHP, false )
"CHoCH+" => boolean.set(s_BOS , false), boolean.set(s_CHoCH, false) , boolean.set(s_CHoCHP, true )
"BOS" => boolean.set(s_BOS , true ), boolean.set(s_CHoCH, false) , boolean.set(s_CHoCHP, false )
"None" => boolean.set(s_BOS , false), boolean.set(s_CHoCH, false) , boolean.set(s_CHoCHP, false )
=> na
switch show_internal_ms
"All" => boolean.set(i_BOS, true ), boolean.set(i_CHoCH, true ), boolean.set(i_CHoCHP, true )
"CHoCH" => boolean.set(i_BOS, false), boolean.set(i_CHoCH, true ), boolean.set(i_CHoCHP, false)
"CHoCH+" => boolean.set(i_BOS, false), boolean.set(i_CHoCH, false ), boolean.set(i_CHoCHP, true )
"BOS" => boolean.set(i_BOS, true ), boolean.set(i_CHoCH, false ), boolean.set(i_CHoCHP, false)
"None" => boolean.set(i_BOS, false), boolean.set(i_CHoCH, false ), boolean.set(i_CHoCHP, false)
=> na
switch
iH =>
up.p.unshift(b.h )
up.l.unshift(b.h )
up.n.unshift(n )
iL =>
dn.p.unshift(b.l )
dn.l.unshift(b.l )
dn.n.unshift(n )
sL =>
sdn.p.unshift(b.l )
sdn.l.unshift(b.l )
sdn.n.unshift(n )
sH =>
sup.p.unshift(b.h )
sup.l.unshift(b.h )
sup.n.unshift(n )
// INTERNAL BULLISH STRUCTURE
if up.p.size() > 0 and dn.l.size() > 1
if ta.crossover(b.c, up.p.first())
bool CHoCH = na
string txt = na
if itrend < 0
CHoCH := true
switch
not CHoCH =>
txt := "BOS"
css := i_ms_up_BOS
blalert.bos := true
if boolean.get(i_BOS) and mtf == false and na(drw)
isdrw := true
drw := msDraw.new(
up.n.first()
, up.p.first()
, i_ms_up_BOS
, txt
, true
)
CHoCH =>
dn.l.first() > dn.l.get(1) ? blalert.chochplus : blalert.choch
txt := dn.l.first() > dn.l.get(1) ? "CHoCH+" : "CHoCH"
css := i_ms_up_BOS.darkcss(0.25, true)
if (dn.l.first() > dn.l.get(1) ? boolean.get(i_CHoCHP) : boolean.get(i_CHoCH)) and mtf == false and na(drw)
isdrw := true
drw := msDraw.new(
up.n.first()
, up.p.first()
, i_ms_up_BOS.darkcss(0.25, true)
, txt
, true
)
if mtf == false
switch
ob_filter == "None" => bull_ob := true
ob_filter == "BOS" and txt == "BOS" => bull_ob := true
ob_filter == "CHoCH" and txt == "CHoCH" => bull_ob := true
ob_filter == "CHoCH+" and txt == "CHoCH+" => bull_ob := true
itrend := 1
up.n.clear()
up.p.clear()
// INTERNAL BEARISH STRUCTURE
if dn.p.size() > 0 and up.l.size() > 1
if ta.crossunder(b.c, dn.p.first())
bool CHoCH = na
string txt = na
if itrend > 0
CHoCH := true
switch
not CHoCH =>
bralert.bos := true
txt := "BOS"
css := i_ms_dn_BOS
if boolean.get(i_BOS) and mtf == false and na(drw)
isdrw := true
drw := msDraw.new(
dn.n.first()
, dn.p.first()
, i_ms_dn_BOS
, txt
, false
)
CHoCH =>
if up.l.first() < up.l.get(1)
bralert.chochplus := true
else
bralert.choch := true
txt := up.l.first() < up.l.get(1) ? "CHoCH+" : "CHoCH"
css := i_ms_dn_BOS.darkcss(0.25, false)
if (up.l.first() < up.l.get(1) ? boolean.get(i_CHoCHP) : boolean.get(i_CHoCH)) and mtf == false and na(drw)
isdrw := true
drw := msDraw.new(
dn.n.first()
, dn.p.first()
, i_ms_dn_BOS.darkcss(0.25, false)
, txt
, false
)
if mtf == false
switch
ob_filter == "None" => bear_ob := true
ob_filter == "BOS" and txt == "BOS" => bear_ob := true
ob_filter == "CHoCH" and txt == "CHoCH" => bear_ob := true
ob_filter == "CHoCH+" and txt == "CHoCH+" => bear_ob := true
itrend := -1
dn.n.clear()
dn.p.clear()
// SWING BULLISH STRUCTURE
if sup.p.size() > 0 and sdn.l.size() > 1
if ta.crossover(b.c, sup.p.first())
bool CHoCH = na
string txt = na
if trend < 0
CHoCH := true
switch
not CHoCH =>
blalert.swingbos := true
txt := "BOS"
icss := s_ms_up_BOS
if boolean.get(s_BOS) and mtf == false and na(drw)
isdrwS := true
drw := msDraw.new(
sup.n.first()
, sup.p.first()
, s_ms_up_BOS
, txt
, true
)
CHoCH =>
if sdn.l.first() > sdn.l.get(1)
blalert.chochplusswing := true
else
blalert.chochswing := true
txt := sdn.l.first() > sdn.l.get(1) ? "CHoCH+" : "CHoCH"
icss := s_ms_up_BOS.darkcss(0.25, true)
if (sdn.l.first() > sdn.l.get(1) ? boolean.get(s_CHoCHP) : boolean.get(s_CHoCH)) and mtf == false and na(drw)
isdrwS := true
drw := msDraw.new(
sup.n.first()
, sup.p.first()
, s_ms_up_BOS.darkcss(0.25, true)
, txt
, true
)
if mtf == false
switch
ob_filter == "None" => s_bull_ob := true
ob_filter == "BOS" and txt == "BOS" => s_bull_ob := true
ob_filter == "CHoCH" and txt == "CHoCH" => s_bull_ob := true
ob_filter == "CHoCH+" and txt == "CHoCH+" => s_bull_ob := true
trend := 1
sup.n.clear()
sup.p.clear()
// SWING BEARISH STRUCTURE
if sdn.p.size() > 0 and sup.l.size() > 1
if ta.crossunder(b.c, sdn.p.first())
bool CHoCH = na
string txt = na
if trend > 0
CHoCH := true
switch
not CHoCH =>
bralert.swingbos := true
txt := "BOS"
icss := s_ms_dn_BOS
if boolean.get(s_BOS) and mtf == false and na(drw)
isdrwS := true
drw := msDraw.new(
sdn.n.first()
, sdn.p.first()
, s_ms_dn_BOS
, txt
, false
)
CHoCH =>
if sup.l.first() < sup.l.get(1)
bralert.chochplusswing := true
else
bralert.chochswing := true
txt := sup.l.first() < sup.l.get(1) ? "CHoCH+" : "CHoCH"
icss := s_ms_dn_BOS.darkcss(0.25, false)
if (sup.l.first() < sup.l.get(1) ? boolean.get(s_CHoCHP) : boolean.get(s_CHoCH)) and mtf == false and na(drw)
isdrwS := true
drw := msDraw.new(
sdn.n.first()
, sdn.p.first()
, s_ms_dn_BOS.darkcss(0.25, false)
, txt
, false
)
if mtf == false
switch
ob_filter == "None" => s_bear_ob := true
ob_filter == "BOS" and txt == "BOS" => s_bear_ob := true
ob_filter == "CHoCH" and txt == "CHoCH" => s_bear_ob := true
ob_filter == "CHoCH+" and txt == "CHoCH+" => s_bear_ob := true
trend := -1
sdn.n.clear()
sdn.p.clear()
= structure(false)
if isdrw
f_line(drw, size.small, line.style_dashed)
if isdrwS
f_line(drw, size.small, line.style_solid)
= request.security("", "15" , structure(true))
= request.security("", "60" , structure(true))
= request.security("", "240" , structure(true))
= request.security("", "1440" , structure(true))
if show_mtf_str
var tab = table.new(position = position.top_right, columns = 10, rows = 10, bgcolor = na, frame_color = color.rgb(54, 58, 69, 0), frame_width = 1, border_color = color.rgb(54, 58, 69, 100), border_width = 1)
table.cell(tab, 0, 1, text = "15" , text_color = color.silver, text_halign = text.align_center, text_size = size.normal, bgcolor = chart.bg_color, text_font_family = font.family_monospace, width = 2)
table.cell(tab, 0, 2, text = "1H" , text_color = color.silver, text_halign = text.align_center, text_size = size.normal, bgcolor = chart.bg_color, text_font_family = font.family_monospace, width = 2)
table.cell(tab, 0, 3, text = "4H" , text_color = color.silver, text_halign = text.align_center, text_size = size.normal, bgcolor = chart.bg_color, text_font_family = font.family_monospace, width = 2)
table.cell(tab, 0, 4, text = "1D" , text_color = color.silver, text_halign = text.align_center, text_size = size.normal, bgcolor = chart.bg_color, text_font_family = font.family_monospace, width = 2)
table.cell(tab, 1, 1, text = itrend15 == 1 ? "BULLISH" : itrend15 == -1 ? "BEARISH" : na , text_halign = text.align_center, text_size = size.normal, text_color = itrend15 == 1 ? i_ms_up_BOS.darkcss(-0.25, true) : itrend15 == -1 ? i_ms_dn_BOS.darkcss(0.25, false) : color.gray, bgcolor = chart.bg_color, text_font_family = font.family_monospace)
table.cell(tab, 1, 2, text = itrend1H == 1 ? "BULLISH" : itrend1H == -1 ? "BEARISH" : na , text_halign = text.align_center, text_size = size.normal, text_color = itrend1H == 1 ? i_ms_up_BOS.darkcss(-0.25, true) : itrend1H == -1 ? i_ms_dn_BOS.darkcss(0.25, false) : color.gray, bgcolor = chart.bg_color, text_font_family = font.family_monospace)
table.cell(tab, 1, 3, text = itrend4H == 1 ? "BULLISH" : itrend4H == -1 ? "BEARISH" : na , text_halign = text.align_center, text_size = size.normal, text_color = itrend4H == 1 ? i_ms_up_BOS.darkcss(-0.25, true) : itrend4H == -1 ? i_ms_dn_BOS.darkcss(0.25, false) : color.gray, bgcolor = chart.bg_color, text_font_family = font.family_monospace)
table.cell(tab, 1, 4, text = itrend1D == 1 ? "BULLISH" : itrend1D == -1 ? "BEARISH" : na , text_halign = text.align_center, text_size = size.normal, text_color = itrend1D == 1 ? i_ms_up_BOS.darkcss(-0.25, true) : itrend1D == -1 ? i_ms_dn_BOS.darkcss(0.25, false) : color.gray, bgcolor = chart.bg_color, text_font_family = font.family_monospace)
table.cell(tab, 0, 5, text = "Detected Pattern", text_halign = text.align_center, text_size = size.normal, text_color = color.silver, bgcolor = chart.bg_color, text_font_family = font.family_monospace)
table.cell(tab, 0, 6, text = p.found, text_halign = text.align_center, text_size = size.normal, text_color = na(p.bull) ? color.white : p.bull ? i_ms_up_BOS.darkcss(-0.25, true) : p.bull == false ? i_ms_dn_BOS.darkcss(0.25, false) : na, bgcolor = chart.bg_color, text_font_family = font.family_monospace)
table.merge_cells(tab, 0, 5, 1, 5)
table.merge_cells(tab, 0, 6, 1, 6)
//{----------------------------------------------------------------------------------------------------------------------------------------------}
//{----------------------------------------------------------------------------------------------------------------------------------------------}
//{----------------------------------------------------------------------------------------------------------------------------------------------}
//{----------------------------------------------------------------------------------------------------------------------------------------------}
//{ - End }
//{----------------------------------------------------------------------------------------------------------------------------------------------}
//{----------------------------------------------------------------------------------------------------------------------------------------------}
//{----------------------------------------------------------------------------------------------------------------------------------------------}
//{----------------------------------------------------------------------------------------------------------------------------------------------}
//{----------------------------------------------------------------------------------------------------------------------------------------------}
//{----------------------------------------------------------------------------------------------------------------------------------------------}
//{----------------------------------------------------------------------------------------------------------------------------------------------}
//{----------------------------------------------------------------------------------------------------------------------------------------------}
//{ - Strong/Weak High/Low And Equilibrium }
//{----------------------------------------------------------------------------------------------------------------------------------------------}
//{----------------------------------------------------------------------------------------------------------------------------------------------}
//{----------------------------------------------------------------------------------------------------------------------------------------------}
//{----------------------------------------------------------------------------------------------------------------------------------------------}
var phl = Zphl.new(
na
, na
, label.new(na , na , color = invcol , textcolor = i_ms_dn_BOS , style = label.style_label_down , size = size.tiny , text = "")
, label.new(na , na , color = invcol , textcolor = i_ms_up_BOS , style = label.style_label_up , size = size.tiny , text = "")
, true
, true
, true
, true
, ""
, ""
, 0
, 0
, 0
, 0
, high
, low
, 0
, 0
, 0
, 0
, 0
, 0
, na
, na
)
zhl(len)=>
upper = ta.highest(len)
lower = ta.lowest(len)
var float out = 0
out := b.h > upper ? 0 : b.l < lower ? 1 : out
top = out == 0 and out != 0 ? b.h : 0
btm = out == 1 and out != 1 ? b.l : 0
= zhl(sLen)
= zhl(iLen)
upphl(trend) =>
var label lbl = label.new(
na
, na
, color = invcol
, textcolor = toplvl
, style = label.style_label_down
, size = size.small
)
if top
phl.stopcross := true
phl.txtup := top > phl.topy ? "HH" : "HL"
if show_lbl
topl = label.new(
b.n - swing_r_lookback
, top
, phl.txtup
, color = invcol
, textcolor = toplvl
, style = label.style_label_down
, size = size.small
)
line.delete(phl.top )
phl.top := line.new(
b.n - sLen
, top
, b.n
, top
, color = toplvl)
phl.topy := top
phl.topx := b.n - sLen
phl.tup := top
phl.tupx := b.n - sLen
if itop
phl.itopcross := true
phl.itopy := itop
phl.itopx := b.n - iLen
phl.tup := math.max(high, phl.tup)
phl.tupx := phl.tup == high ? b.n : phl.tupx
phl.uV := phl.tup != phl.tup ? b.v : phl.uV
if barstate.islast
line.set_xy1(
phl.top
, phl.tupx
, phl.tup
)
line.set_xy2(
phl.top
, b.n + 50
, phl.tup
)
label.set_x(
lbl
, b.n + 50
)
label.set_y(
lbl
, phl.tup
)
dist = math.abs(phl.uV / (phl.uV + phl.dV)) * 100
label.set_text (lbl, trend < 0
? "Strong High | " + str.tostring(phl.uV, format.volume) + " (" + str.tostring(math.round(dist,0)) + "%)"
: "Weak High | " + str.tostring(phl.uV, format.volume) + " (" + str.tostring(math.round(dist,0)) + "%)")
dnphl(trend) =>
var label lbl = label.new(
na
, na
, color = invcol
, textcolor = btmlvl
, style = label.style_label_up
, size = size.small
)
if btm
phl.sbottomcross := true
phl.txtdn := btm > phl.bottomy ? "LH" : "LL"
if show_lbl
btml = label.new(
b.n - swing_r_lookback
, btm, phl.txtdn
, color = invcol
, textcolor = btmlvl
, style = label.style_label_up
, size = size.small
)
line.delete(phl.bottom )
phl.bottom := line.new(
b.n - sLen
, btm
, b.n
, btm
, color = btmlvl
)
phl.bottomy := btm
phl.bottomx := b.n - sLen
phl.tdn := btm
phl.tdnx := b.n - sLen
if ibtm
phl.ibottomcross := true
phl.ibottomy := ibtm
phl.ibottomx := b.n - iLen
phl.tdn := math.min(low, phl.tdn)
phl.tdnx := phl.tdn == low ? b.n : phl.tdnx
phl.dV := phl.tdn != phl.tdn ? b.v : phl.dV
if barstate.islast
line.set_xy1(
phl.bottom
, phl.tdnx
, phl.tdn
)
line.set_xy2(
phl.bottom
, b.n + 50
, phl.tdn
)
label.set_x(
lbl
, b.n + 50
)
label.set_y(
lbl
, phl.tdn
)
dist = math.abs(phl.dV / (phl.uV + phl.dV)) * 100
label.set_text (lbl, trend > 0
? "Strong Low | " + str.tostring(phl.dV, format.volume) + " (" + str.tostring(math.round(dist,0)) + "%)"
: "Weak Low | " + str.tostring(phl.uV, format.volume) + " (" + str.tostring(math.round(dist,0)) + "%)")
midphl() =>
avg = math.avg(phl.bottom.get_y2(), phl.top.get_y2())
var line l = line.new(
y1 = avg
, y2 = avg
, x1 = b.n - sLen
, x2 = b.n + 50
, color = midlvl
, style = line.style_solid
)
var label lbl = label.new(
x = b.n + 50
, y = avg
, text = "Equilibrium"
, style = label.style_label_left
, color = invcol
, textcolor = midlvl
, size = size.small
)
if barstate.islast
more = (phl.bottom.get_x1() + phl.bottom.get_x2()) > (phl.top.get_x1() + phl.top.get_x2()) ? phl.top.get_x1() : phl.bottom.get_x1()
line.set_xy1(l , more , avg)
line.set_xy2(l , b.n + 50, avg)
label.set_x (lbl , b.n + 50 )
label.set_y (lbl , avg )
dist = math.abs((l.get_y2() - close) / close) * 100
label.set_text (lbl, "Equilibrium (" + str.tostring(math.round(dist,0)) + "%)")
hqlzone() =>
if barstate.islast
var hqlzone dZone = hqlzone.new(
box.new(
na
, na
, na
, na
, bgcolor = color.new(toplvl, 70)
, border_color = na
)
, box.new(
na
, na
, na
, na
, bgcolor = color.new(midlvl, 70)
, border_color = na
)
, box.new(
na
, na
, na
, na
, bgcolor = color.new(btmlvl, 70)
, border_color = na
)
, label.new(na, na, text = "Premium" , color = invcol, textcolor = toplvl, style = label.style_label_down, size = size.small)
, label.new(na, na, text = "Equilibrium", color = invcol, textcolor = midlvl, style = label.style_label_left, size = size.small)
, label.new(na, na, text = "Discount" , color = invcol, textcolor = btmlvl, style = label.style_label_up , size = size.small)
)
dZone.pbx.set_lefttop(int(math.max(phl.topx, phl.bottomx)) , phl.tup)
dZone.pbx.set_rightbottom(b.n + 50 , 0.95 * phl.tup + 0.05 * phl.tdn)
dZone.ebx.set_lefttop(int(math.max(phl.topx, phl.bottomx)), 0.525 * phl.tup + 0.475 * phl.tdn)
dZone.ebx.set_rightbottom(b.n + 50 , 0.525 * phl.tdn + 0.475 * phl.tup)
dZone.lbx.set_lefttop(int(math.max(phl.topx, phl.bottomx)), 0.95 * phl.tdn + 0.05 * phl.tup)
dZone.lbx.set_rightbottom(b.n + 50 , phl.tdn)
dZone.plb.set_xy( int(math.avg(math.max(phl.topx, phl.bottomx), int(b.n + 50))) , phl.tup)
dZone.elb.set_xy( int(b.n + 50) , math.avg(phl.tup, phl.tdn))
dZone.lbl.set_xy( int(math.avg(math.max(phl.topx, phl.bottomx), int(b.n + 50))) , phl.tdn)
if show_mtb
upphl (trend)
dnphl (trend)
hqlzone()
//{----------------------------------------------------------------------------------------------------------------------------------------------}
//{----------------------------------------------------------------------------------------------------------------------------------------------}
//{----------------------------------------------------------------------------------------------------------------------------------------------}
//{----------------------------------------------------------------------------------------------------------------------------------------------}
//{ - End }
//{----------------------------------------------------------------------------------------------------------------------------------------------}
//{----------------------------------------------------------------------------------------------------------------------------------------------}
//{----------------------------------------------------------------------------------------------------------------------------------------------}
//{----------------------------------------------------------------------------------------------------------------------------------------------}
//{----------------------------------------------------------------------------------------------------------------------------------------------}
//{----------------------------------------------------------------------------------------------------------------------------------------------}
//{----------------------------------------------------------------------------------------------------------------------------------------------}
//{----------------------------------------------------------------------------------------------------------------------------------------------}
//{ - Volumetric Order Block }
//{----------------------------------------------------------------------------------------------------------------------------------------------}
//{----------------------------------------------------------------------------------------------------------------------------------------------}
//{----------------------------------------------------------------------------------------------------------------------------------------------}
//{----------------------------------------------------------------------------------------------------------------------------------------------}
method eB(box b, bool ext, color css, bool swing) =>
b.unshift(
box.new(
na
, na
, na
, na
, xloc = xloc.bar_time
, text_font_family = font.family_monospace
, extend = ext ? extend.right : extend.none
, border_color = swing ? color.new(css, 0) : color.new(color.white,100)
, bgcolor = css
, border_width = 1
)
)
method eL(line l, bool ext, bool solid, color css) =>
l.unshift(
line.new(
na
, na
, na
, na
, width = 1
, color = css
, xloc = xloc.bar_time
, extend = ext ? extend.right : extend.none
, style = solid ? line.style_solid : line.style_dashed
)
)
method drawVOB(bool cdn, bool bull, color css, int loc, bool swing) =>
= request.security(
syminfo.tickerid
, ""
,
, lookahead = barmerge.lookahead_off
)
var obC obj = obC.new(
array.new()
, array.new()
, array.new< int >()
, array.new()
, array.new()
, array.new()
, array.new< int >()
, array.new< int >()
, array.new< int >()
, array.new< int >()
, array.new()
, array.new()
, array.new< int >()
)
var obD draw = obD.new(
array.new()
, array.new()
, array.new()
, array.new()
, array.new()
)
if barstate.isfirst
for i = 0 to ob_num - 1
draw.mL .eL(false, false, use_grayscale ? color.new(color.gray, 0) : color.new(css,0))
draw.ob .eB(false, use_grayscale ? color.new(color.gray, 90) : css, swing)
draw.blB.eB(false, css_metric_up , swing)
draw.brB.eB(false, css_metric_dn , swing)
draw.eOB.eB(true , use_grayscale ? color.new(color.gray, 90) : css, swing)
float pos = ob_pos == "Full"
? (bull ? high : low)
: ob_pos == "Middle"
? ohlc4
: ob_pos == "Accurate"
? hl2
: hl2
if cdn
obj.h.clear()
obj.l.clear()
obj.n.clear()
for i = 0 to math.abs((loc - b.n)) - 1
obj.h.push(hH )
obj.l.push(lL )
obj.n.push(b.t )
// obj.h.reverse()
// obj.l.reverse()
int iU = obj.l.indexof(obj.l.min()) + 1
int iD = obj.h.indexof(obj.h.max()) + 1
obj.dir.unshift(
bull
? (b.c > b.o ? 1 : -1)
: (b.c > b.o ? 1 : -1)
)
obj.top.unshift(
bull
? pos
: obj.h.max()
)
obj.btm.unshift(
bull
? obj.l.min()
: pos
)
obj.left.unshift(
bull
? obj.n.get(obj.l.indexof(obj.l.min()))
: obj.n.get(obj.h.indexof(obj.h.max()))
)
obj.avg.unshift(
math.avg(obj.top.first(), obj.btm.first())
)
obj.cV.unshift(
bull
? b.v
: b.v
)
if ob_pos == "Precise"
switch bull
true =>
if obj.avg.get(0) < (b.c < b.o ? b.c : b.o ) and obj.top.get(0) > hlcc4
obj.top.set(0, obj.avg.get(0))
obj.avg.set(0, math.avg(obj.top.first(), obj.btm.first()))
false =>
if obj.avg.get(0) > (b.c < b.o ? b.o : b.c ) and obj.btm.get(0) < hlcc4
obj.btm.set(0, obj.avg.get(0))
obj.avg.set(0, math.avg(obj.top.first(), obj.btm.first()))
obj.blVP.unshift ( 0 )
obj.brVP.unshift ( 0 )
obj.wM .unshift ( 1 )
if use_overlap
int rmP = use_overlap_method == "Recent" ? 1 : 0
if obj.avg.size() > 1
if bull
? obj.btm.first() < obj.top.get(1)
: obj.top.first() > obj.btm.get(1)
obj.wM .remove(rmP)
obj.cV .remove(rmP)
obj.dir .remove(rmP)
obj.top .remove(rmP)
obj.avg .remove(rmP)
obj.btm .remove(rmP)
obj.left .remove(rmP)
obj.blVP .remove(rmP)
obj.brVP .remove(rmP)
if barstate.isconfirmed
for x = 0 to ob_num - 1
tg = switch ob_mitigation
"Middle" => obj.avg
"Absolute" => bull ? obj.btm : obj.top
for in tg
if (bull ? cC < pt : cC > pt)
obj.wM .remove(idx)
obj.cV .remove(idx)
obj.dir .remove(idx)
obj.top .remove(idx)
obj.avg .remove(idx)
obj.btm .remove(idx)
obj.left .remove(idx)
obj.blVP .remove(idx)
obj.brVP .remove(idx)
if barstate.islast
if obj.avg.size() > 0
// Alert
if bull
? ta.crossunder(low , obj.top.get(0))
: ta.crossover (high, obj.btm.get(0))
switch bull
true => blalert.obtouch := true
false => bralert.obtouch := true
float tV = 0
obj.dV.clear()
seq = math.min(ob_num - 1, obj.avg.size() - 1)
for j = 0 to seq
tV += obj.cV.get(j)
if j == seq
for y = 0 to seq
obj.dV.unshift(
math.floor(
(obj.cV.get(y) / tV) * 100)
)
obj.dV.reverse()
for i = 0 to math.min(ob_num - 1, obj.avg.size() - 1)
dmL = draw.mL .get(i)
dOB = draw.ob .get(i)
dblB = draw.blB.get(i)
dbrB = draw.brB.get(i)
deOB = draw.eOB.get(i)
dOB.set_lefttop (obj.left .get(i) , obj.top.get(i))
deOB.set_lefttop (b.t , obj.top.get(i))
dOB.set_rightbottom (b.t , obj.btm.get(i))
deOB.set_rightbottom(b.t + (b.t - b.t ) * 100 , obj.btm.get(i))
if use_middle_line
dmL.set_xy1(obj.left.get(i), obj.avg.get(i))
dmL.set_xy2(b.t , obj.avg.get(i))
if ob_metrics_show
dblB.set_lefttop (obj.left.get(i), obj.top.get(i))
dbrB.set_lefttop (obj.left.get(i), obj.avg.get(i))
dblB.set_rightbottom(obj.left.get(i), obj.avg.get(i))
dbrB.set_rightbottom(obj.left.get(i), obj.btm.get(i))
rpBL = dblB.get_right()
rpBR = dbrB.get_right()
dbrB.set_right(rpBR + (b.t - b.t ) * obj.brVP.get(i))
dblB.set_right(rpBL + (b.t - b.t ) * obj.blVP.get(i))
if use_show_metric
txt = switch
obj.cV.get(i) >= 1000000000 => str.tostring(math.round(obj.cV.get(i) / 1000000000,3)) + "B"
obj.cV.get(i) >= 1000000 => str.tostring(math.round(obj.cV.get(i) / 1000000,3)) + "M"
obj.cV.get(i) >= 1000 => str.tostring(math.round(obj.cV.get(i) / 1000,3)) + "K"
obj.cV.get(i) < 1000 => str.tostring(math.round(obj.cV.get(i)))
deOB.set_text(
str.tostring(
txt + " (" + str.tostring(obj.dV.get(i)) + "%)")
)
deOB.set_text_size (size.auto)
deOB.set_text_halign(text.align_left)
deOB.set_text_color (use_grayscale ? color.silver : color.new(css, 0))
if ob_metrics_show and barstate.isconfirmed
if obj.wM.size() > 0
for i = 0 to obj.avg.size() - 1
switch obj.dir.get(i)
1 =>
switch obj.wM.get(i)
1 => obj.blVP.set(i, obj.blVP.get(i) + 1), obj.wM.set(i, 2)
2 => obj.blVP.set(i, obj.blVP.get(i) + 1), obj.wM.set(i, 3)
3 => obj.brVP.set(i, obj.brVP.get(i) + 1), obj.wM.set(i, 1)
-1 =>
switch obj.wM.get(i)
1 => obj.brVP.set(i, obj.brVP.get(i) + 1), obj.wM.set(i, 2)
2 => obj.brVP.set(i, obj.brVP.get(i) + 1), obj.wM.set(i, 3)
3 => obj.blVP.set(i, obj.blVP.get(i) + 1), obj.wM.set(i, 1)
var hN = array.new(1, b.n)
var lN = array.new(1, b.n)
var hS = array.new(1, b.n)
var lS = array.new(1, b.n)
if iH
hN.pop()
hN.unshift(int(b.n ))
if iL
lN.pop()
lN.unshift(int(b.n ))
if sH
hS.pop()
hS.unshift(int(b.n ))
if sL
lS.pop()
lS.unshift(int(b.n ))
if ob_show
bull_ob.drawVOB(true , ob_bull_css, hN.first(), false)
bear_ob.drawVOB(false, ob_bear_css, lN.first(), false)
if ob_swings
s_bull_ob.drawVOB(true , css_swing_up, hS.first(), true)
s_bear_ob.drawVOB(false, css_swing_dn, lS.first(), true)
if bull_ob
blalert.ob := true
if bear_ob
bralert.ob := true
if s_bull_ob
blalert.swingob := true
if s_bear_ob
blalert.swingob := true
//{----------------------------------------------------------------------------------------------------------------------------------------------}
//{----------------------------------------------------------------------------------------------------------------------------------------------}
//{----------------------------------------------------------------------------------------------------------------------------------------------}
//{----------------------------------------------------------------------------------------------------------------------------------------------}
//{ - End }
//{----------------------------------------------------------------------------------------------------------------------------------------------}
//{----------------------------------------------------------------------------------------------------------------------------------------------}
//{----------------------------------------------------------------------------------------------------------------------------------------------}
//{----------------------------------------------------------------------------------------------------------------------------------------------}
//{----------------------------------------------------------------------------------------------------------------------------------------------}
//{----------------------------------------------------------------------------------------------------------------------------------------------}
//{----------------------------------------------------------------------------------------------------------------------------------------------}
//{----------------------------------------------------------------------------------------------------------------------------------------------}
//{ - FVG | VI | OG }
//{----------------------------------------------------------------------------------------------------------------------------------------------}
//{----------------------------------------------------------------------------------------------------------------------------------------------}
//{----------------------------------------------------------------------------------------------------------------------------------------------}
//{----------------------------------------------------------------------------------------------------------------------------------------------}
ghl() => request.security(syminfo.tickerid, fvg_tf, [high , low , close , open ])
tfG() => request.security(syminfo.tickerid, fvg_tf, )
cG(bool bull) =>
= ghl()
= tfG()
var FVG draw = FVG.new(
array.new()
, array.new()
)
var FVG cords = array.new()
float pup = na
float pdn = na
bool cdn = na
int pos = 2
cc = timeframe.change(fvg_tf)
if barstate.isfirst
for i = 0 to fvg_num - 1
draw.box.unshift(box.new (na, na, na, na, border_color = color.new(color.white, 100), xloc = xloc.bar_time))
draw.ln.unshift (line.new(na, na, na, na, xloc = xloc.bar_time, width = 1, style = line.style_solid))
switch what_fvg
"FVG" =>
pup := bull ? gl : l
pdn := bull ? h : gh
cdn := bull ? gl > h and cc : gh < l and cc
pos := 2
"VI" =>
pup := bull
? (gc > go
? go
: gc)
: (gc > go
? go
: gc )
pdn := bull
? (gc > go
? gc
: go )
: (gc > go
? gc
: go)
cdn := bull
? go > gc and gh >
