Daily & Weekly ConfluenceDaily & Weekly Confluence is a precision momentum-alignment indicator built on Stochastic RSI, designed to highlight high-probability bullish conditions when lower-timeframe momentum aligns with higher-timeframe structure. It combines live Stoch RSI signals with a forward-shifted momentum path and a robust daily/weekly confirmation system to help traders anticipate and confirm trend transitions with clarity and discipline.
Why this indicator matters
Momentum signals are most effective when they agree across timeframes. Daily & Weekly Confluence filters noise by requiring alignment between daily and weekly Stoch RSI behavior, allowing traders to focus on setups that occur within a supportive higher-timeframe context rather than reacting to isolated signals.
What the indicator shows
1. Live Stochastic RSI (%K / %D)
The indicator plots real-time Stoch RSI values for the active chart timeframe, including standard overbought and oversold reference levels. These lines represent current momentum conditions and form the basis for all signal logic.
2. Forward-shifted Stoch RSI path
A user-defined Stoch RSI pattern window is sampled from the past and drawn forward on the chart. This path visually maps how momentum previously evolved and where similar momentum behavior may re-emerge. Optional normalization keeps the path scaled to recent conditions for consistent visual interpretation.
3. Momentum cross visualization
When %K and %D intersect within the forward-shifted path, the indicator can display:
Color-cycling vertical reference lines
Small directional arrows at the crossing point
A single highlighted label marking the next upcoming cross
These visuals are designed to keep attention on momentum inflection zones, not clutter.
Multi-timeframe signal logic
Weekly signals
The indicator independently computes weekly Stoch RSI values and detects:
Confirmed bullish crosses
Near-cross conditions based on distance and slope
Daily signals
Daily bullish crosses and near-cross conditions are detected using the same logic but on the daily timeframe.
Weekly context filter (optional)
Daily signals can be restricted so they only trigger when weekly momentum is already bullish or has recently turned bullish. This alignment filter significantly reduces counter-trend signals.
Dual confirmation
When daily and weekly bullish crosses occur together, the indicator flags a high-confidence confluence event.
Alerts built for real trading
Preconfigured alert conditions include:
Weekly bullish confirmed
Weekly bullish near-cross
Daily bullish confirmed
Daily bullish near-cross
Daily signals with weekly confirmation required
Dual daily + weekly confirmation
Alerts can be configured to trigger only on confirmed bar closes for cleaner execution timing.
How to use it effectively
Use weekly signals to define directional bias
Use daily signals for timing within that bias
Treat “near-cross” alerts as early warnings, not entries
Give the highest weight to dual confirmed alignment events
This indicator is best suited for swing traders, position traders, and systematic momentum strategies that prioritize structure, confirmation, and discipline over reactive entries.
Индикаторы и стратегии

Daily High Low XAUUSD by RizalIndikator ini untuk mengetahui high low daily chart XAUUSD di timeframe 4h


Relative Strength Index, Divergences, color and more lines.Modified RSI technical indicator with divergences. Additional colors and more lines have been added.

Volume Weighted ATRThis script implements a Volume‑Weighted Average True Range (VWATR) indicator, a variation of ATR that incorporates trading volume into the volatility calculation. Instead of treating all price movements equally, it amplifies true range during high‑volume periods and dampens it during low‑volume periods, producing a volatility measure that adapts to liquidity conditions. The script begins by allowing the user to choose a lookback length and a smoothing method, offering RMA, SMA, EMA, or WMA for flexibility in how responsive the indicator should be.
The core of the calculation starts with the standard true range, which captures the most meaningful price movement of each bar. This true range is then multiplied by volume, creating a volume‑weighted true range that gives more importance to bars where market participation is higher. To ensure consistency, the script defines a custom moving‑average function that applies the selected smoothing method to any input series. This function is used twice: once to smooth the volume‑weighted true range and once to smooth volume itself.
The final VWATR value is obtained by dividing the smoothed volume‑weighted true range by the smoothed volume. Mathematically, this produces a volume‑weighted mean of true range, making the indicator more sensitive to volatility expansions that occur with strong participation and less reactive to low‑volume noise. The script concludes by plotting this VWATR line, giving traders a clean, adaptive measure of volatility that can be used for regime detection, breakout confirmation, or dynamic stop sizing

ATR Based SL & TP Targets from Entry (Long/Short)ATR-based target helper for manual trade planning.
Plots a single entry level plus ATR-based stop loss and take-profit targets on the price scale. The script uses a standard ATR (default 14) and lets you select the position side (Long or Short). For Long positions, it places the stop loss 1× ATR below the entry and take-profit levels at 1, 2, 3, and 4× ATR above. For Short positions, it mirrors this logic, placing the stop 1× ATR above the entry and targets 1–4× ATR below. You can adjust the entry price and ATR multipliers from the settings, and all levels update instantly, giving a clean visual of your risk and reward targets on the price scale.
-------------------
Tip:
After entry, and after I set my SL & TP levels, I hide the indicator until it's needed again.

Dollar Edge 2Y📊 Fed vs ECB Edge – 2Y
This indicator tracks the 2-year government bond yield spread between the United States and Germany (US 2Y − DE 2Y).
The 2Y spread is a direct proxy for short-term monetary policy expectations, reflecting the relative stance of the Federal Reserve vs the European Central Bank.
📈 Rising spread → USD rate advantage
📉 Falling spread → EUR relief
Designed to provide macro context for EURUSD, FX flows, and carry trade analysis.
Best used alongside technical analysis — not as a standalone trading signal.

Wavelet Transformation - BASIC Suite ********************************************************************************
* TECHNICAL DOCUMENTATION: ULTIMATE WAVELET SUITE
* Indicator Name: Ultimate Wavelet Suite (db4, Sym, Coif, Morlet, Mex)
* Author: wojlucz
*
* 1. PROJECT OVERVIEW
* The Ultimate Wavelet Suite is a high-fidelity Digital Signal Processing (DSP)
* tool designed to solve the "Lag vs. Noise" dilemma. By utilizing Discrete
* Wavelet Transform (DWT) principles, it filters market noise while maintaining
* a significantly lower phase shift (lag) compared to SMA or EMA.
*
* 2. MATHEMATICAL FRAMEWORK
* This suite implements a Stationary Wavelet Transform (SWT) approach using
* the "à trous" algorithm.
* - CONVOLUTION ENGINE: Filters price using specific wavelet kernels.
* - MULTI-RESOLUTION ANALYSIS (MRA): Increases filter "stride" across levels A1-A4.
* - CDV BOUNDARY METHOD: Folds weights of future coefficients back onto the current
* bar to ensure NO-REPAINTING at the live edge.
*
* 3. WAVELET FAMILIES
* - Daubechies 4 (db4): Industry standard for denoising and trend stability.
* - Symlet 4: Near-symmetric version of db4, reducing phase distortion.
* - Coiflet 1: Engineered for maximum approximation accuracy.
* - Mexican Hat: Best for detecting cycle peaks, troughs, and exhaustion.
* - Morlet: Harmonic-style wavelet, ideal for sideways/ranging markets.
*
* 4. CONFIGURATION GUIDE
* - Level A1/A2: Scalping, fast noise reduction.
* - Level A3/A4: Swing Trading, macro trend identification.

Static H-LineDraw simple horizontal line with static value. The purpose is that indicator stays on the chart when switching instruments (via alerts log, for example).

True ADR% (Range/Close) / ATR / LoD dist. / Market CapHi guys
Couldn't find the script of my dreams and therefore adapted some existing ones I found from the users MikeC (AKA TheScrutiniser) & armerschlucker.
Notes on formulas used in this script:
// ADR% is calculated using the standard definition: 100 * SMA(High - Low, N) / Close
// (average daily range in points over N daily bars, normalized by the current daily close).
// ATR is standard Wilder ATR: ta.atr(N) computed on daily bars.
// LoD dist. is the distance from current close to today’s low, expressed as a % of daily ATR:
// 100 * (Close - Low) / ATR.
// All three metrics are forced to daily bars via request.security(..., "D", ...), so they stay consistent
// regardless of the chart timeframe.
Hope it helps. Please provide feedback in case I made errors.

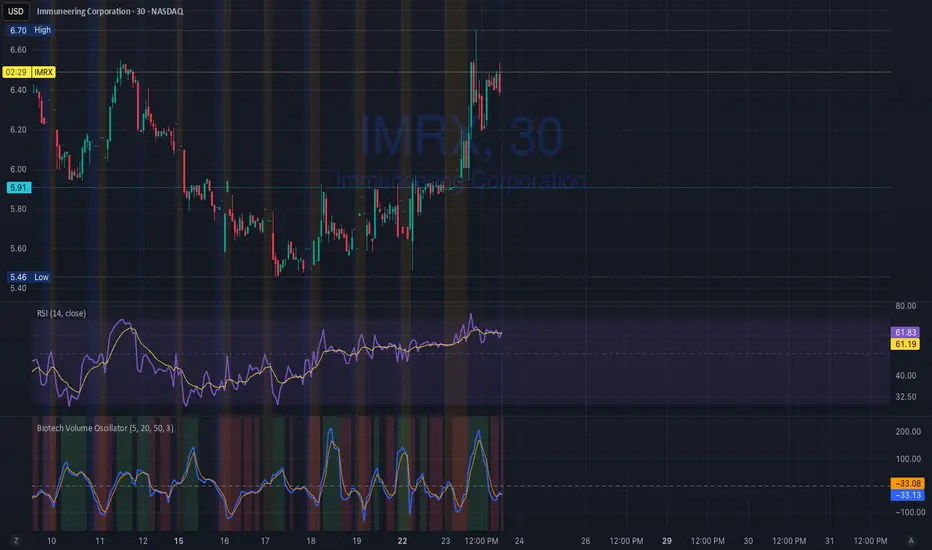
Biotech Volume Oscillator
This oscillator is percentage-based, not raw volume.
Key Levels (Rules of Thumb)
Above +25 → abnormal participation (real interest)
+10 to +25 → constructive, but not decisive
Around 0 → drift / float
Below –25 → participation drying up
These levels work well for:
Small-cap biotech
Catalyst setups
Pre-data ramps
How You’d Use This With RSI (Your Exact Setup)
Bullish / Valid Move
RSI above 50
RSI purple > yellow
Biotech Volume Osc above +10 and rising
➡️ Move has sponsorship
Fake / Suspect Move
Price up
RSI flat or diverging
Volume Osc near 0 or falling
➡️ Float + headline + thin liquidity
Distribution Signal (Very Useful)
Price makes higher high
RSI fails to confirm
Volume Osc rolls over from +25
➡️ Selling into strength
➡️ Excellent context for sell orders like your 7.75
Position Avg Line + P/L Table - SightLine LabsPosition Avg – SLL is a lightweight position-tracking indicator designed to display a persistent average price level on the chart along with a real-time position summary table.
This script is non-trading and does not generate signals, entries, or exits. It is intended strictly for position awareness and visual reference.
What this indicator does:
Plots a persistent horizontal average price line (dashed by default)
Displays a live position statistics table showing:
Shares owned
Average price
Current price
Unrealized profit/loss in dollars
Unrealized profit/loss in percent
Updates automatically as price changes
Works across all timeframes
Does not depend on broker integration or strategy logic
Key features:
Average Price Line:
User-defined average price input
Persistent across the entire chart
Adjustable color and width
Visibility toggle
Position Table:
Six selectable table positions:
Top Left, Top Center, Top Right, Bottom Left, Bottom Center, Bottom Right
Adjustable text size (Tiny through Huge)
Optional table background fill
Optional inner grid lines
Optional outer frame border
Independent color control for:
Header background
Header text
Value text
Positive and negative P/L values
Chart Overlay Options:
Optional chart background tint
Does not modify the global chart theme
Inputs overview:
Position Settings:
Shares Owned
Average Price
Visual Settings:
Show or hide average price line
Line color and width
Table Settings:
Table position
Table text size
Color Settings:
Header background and text colors
Value text color
Positive and negative P/L colors
Optional table background, grid, and frame colors
How to use:
Add the indicator to a chart
Open the settings panel
Enter the number of shares and the average price
Adjust table position, size, and colors as desired
Use the average price line and table as a visual reference for trade and risk management
Notes and limitations:
This indicator does not place trades
It does not connect to any broker
All values are manually entered
Unrealized P/L is calculated using the chart’s current price
Commissions, fees, and slippage are not included
Disclaimer:
This script is provided for educational and informational purposes only. It does not constitute financial advice, investment recommendations, or trade signals. All trading decisions are the sole responsibility of the user.
Developed by SightLine Labs.


Laughing Grid Radar
// ═══ Row 9: 底部装饰线 ═══
table.cell(panel, 0, 9, "▄▄▄▄▄▄▄▄▄▄▄▄▄▄▄▄▄▄▄", bgcolor=c_void, text_color=c_neon_pink, text_halign=text.align_center, text_size=size.tiny)
table.merge_cells(panel, 0, 9, 1, 9)

High-Probability Scalper (Market Open)Market open is where volatility is real, spreads are tight, and momentum shows itself early. This scalping strategy is built specifically to operate during that window, filtering out low-quality signals that usually appear later in the session.
Instead of trading all day, the logic is restricted to the first 90 minutes after market open, where continuation moves and fast pullbacks are more reliable.
What This Strategy Does
This script looks for short-term momentum alignment using:
Fast vs slow EMA structure
RSI confirmation to avoid chasing extremes
ATR-based risk control
Session-based filtering to trade only when volume matters
It’s designed for intraday scalping, not swing trading.
Core Trading Logic
1. Market Open Filter
Trades are allowed only between 09:30 – 11:00 exchange time.
This avoids low-liquidity chop and focuses on the period where most breakouts and reversals form.
2. Trend Confirmation
Bullish bias: 9 EMA crosses above 21 EMA
Bearish bias: 9 EMA crosses below 21 EMA
This keeps trades aligned with short-term direction instead of random entries.
3. Momentum Check (RSI)
RSI is used as a quality filter, not as an overbought/oversold signal.
Long trades only when RSI is strong but not extended
Short trades only when RSI shows weakness without exhaustion
This removes late entries and reduces whipsaws.
Entries & Exits
Entries
Executed only on confirmed candles
No intrabar repainting
One position at a time
Risk Management
Stop-loss based on ATR
Take-profit calculated using a fixed risk–reward ratio
Same structure for both long and short trades
This keeps risk consistent across different symbols and volatility levels.
Why This Strategy Works Better at Market Open
Volume is highest
False breakouts are fewer
EMA crosses have follow-through
RSI behaves more cleanly
By not trading all day, the strategy avoids most of the noise that kills scalpers.
Best Use Cases
Index futures
High-liquidity stocks
Major crypto pairs during active sessions
1m to 5m timeframes
What This Strategy Is NOT
Not a martingale
Not grid-based
Not designed for ranging markets
Not a “set and forget” system
It’s a controlled scalping template meant for disciplined execution.
How to Use It Properly
Test on multiple symbols
Adjust ATR length for volatility
Tune RSI ranges per market
Always forward-test before live alerts
Final Note
This strategy focuses on structure, timing, and risk, not indicator stacking.
If you trade the open, this gives you a clear framework instead of emotional entries.
If you want:
Alerts
Session customization
News filters
Partial exits
You can extend this logic without breaking the core system.

ChromaFlows Momentum Index | LUPENIndicator Guide: ChromaFlows Momentum Index
Overview
The ChromaFlows Momentum Index is a next-generation momentum oscillator designed to filter out market noise and visualize pure trend strength. Unlike traditional indicators that often give conflicting signals, ChromaFlows uses a Consensus Algorithm. It simultaneously analyzes three distinct engines—RSI, Fast Stochastic, and Slow Stochastic—and only lights up when they all agree on the market direction.
The result is a fluid, glowing "Wave" that provides an immediate visual read on market sentiment:
Green Glow: Strong Bullish Consensus (Safe to buy/hold).
Red Glow: Strong Bearish Consensus (Safe to sell/short).
Gray/Neutral: Indecision or Choppy Market (Stay out or tread carefully).
Key Visual Components
1. The Gradient Wave (Main Oscillator)
This is the heartbeat of the indicator. It is usually based on the Slow Stochastic (customizable in settings) but its color is determined by the Consensus Logic.
How to read it: The higher the wave, the more overbought; the lower, the more oversold. However, pay attention to the Glow Intensity. A bright, solid color indicates all underlying indicators are aligned.
2. The SMI Line (Gold Line)
Overlaid on the wave is the SMI (Stochastic Momentum Index) Blau line. This acts as a fast-moving "Signal Line".
Usage: Watch for how this line interacts with the main wave. It leads price action and often signals reversals before they happen.
3. Signal Arrows (Triangles on the Wave)
▲ Cyan Triangle: SMI Crossover UP. This occurs when the Main Wave crosses above the SMI Signal line. This is a potential Long Entry.
▼ Magenta Triangle: SMI Crossover DOWN. This occurs when the Main Wave crosses below the SMI Signal line. This is a potential Short Entry.
4. Hull Trend Markers (Circles/Shapes at Edges)
Located at the very top and bottom of the indicator panel are the Hull Moving Average (HMA) filters.
Bottom Blue/Green Marker: The longer-term Hull Trend is UP.
Top Orange/Red Marker: The longer-term Hull Trend is DOWN.
How to Trade Strategy
✅ The "Flow" Setup (High Probability)
This strategy focuses on taking trades with the momentum consensus.
Wait for the Glow: Look for the Wave to turn Neon Green (Bullish) or Neon Red (Bearish). This confirms momentum is present.
Check the Filter: Ensure the Hull Trend Marker (at the top/bottom) matches the wave color (e.g., Blue marker + Green Wave).
The Trigger: Enter when a Triangle Signal Arrow appears in the direction of the color.
Example: Wave is Green + Cyan Triangle appears = STRONG BUY.
⚠️ The "Reversal" Setup (Aggressive)
Divergence: Price makes a new high, but the ChromaFlows Wave makes a lower high.
Color Shift: The wave changes from Green to Gray (Neutral), indicating momentum is dying.
The Trigger: Wait for a Magenta Triangle (Cross Down) to confirm the reversal.
⛔ The "No-Trade" Zone
When the Wave is Gray and hovering near the zero line, the markets are ranging or the indicators are conflicting. It is statistically safer to stand aside until the "ChromaFlow" (Green or Red color) returns.
Settings Configuration
Wave Source: Choose which oscillator drives the main wave (Default: Stochastic_2).
Consensus Sensitivity: Adjust the periods of the RSI and Stochastics to make the "Glow" appear faster (more signals) or slower (more filtering).
Visuals: All colors are fully customizable via Hex codes to match your chart theme.

Adaptive ML Trailing Stop [BOSWaves]Adaptive ML Trailing Stop – Regime-Aware Risk Control with KAMA Adaptation and Pattern-Based Intelligence
Overview
Adaptive ML Trailing Stop is a regime-sensitive trailing stop and risk control system that adjusts stop placement dynamically as market behavior shifts, using efficiency-based smoothing and pattern-informed biasing.
Instead of operating with fixed ATR offsets or rigid trailing rules, stop distance, responsiveness, and directional treatment are continuously recalculated using market efficiency, volatility conditions, and historical pattern resemblance.
This creates a live trailing structure that responds immediately to regime change - contracting during orderly directional movement, relaxing during rotational conditions, and applying probabilistic refinement when pattern confidence is present.
Price is therefore assessed relative to adaptive, condition-aware trailing boundaries rather than static stop levels.
Conceptual Framework
Adaptive ML Trailing Stop is founded on the idea that effective risk control depends on regime context rather than price location alone.
Conventional trailing mechanisms apply constant volatility multipliers, which often results in trend suppression or delayed exits. This framework replaces static logic with adaptive behavior shaped by efficiency state and observed historical outcomes.
Three core principles guide the design:
Stop distance should adjust in proportion to market efficiency.
Smoothing behavior must respond to regime changes.
Trailing logic benefits from probabilistic context instead of fixed rules.
This shifts trailing stops from rigid exit tools into adaptive, regime-responsive risk boundaries.
Theoretical Foundation
The indicator combines adaptive averaging techniques, volatility-based distance modeling, and similarity-weighted pattern analysis.
Kaufman’s Adaptive Moving Average (KAMA) is used to quantify directional efficiency, allowing smoothing intensity and stop behavior to scale with trend quality. Average True Range (ATR) defines the volatility reference, while a K-Nearest Neighbors (KNN) process evaluates historical price patterns to introduce directional weighting when appropriate.
Three internal systems operate in tandem:
KAMA Efficiency Engine : Evaluates directional efficiency to distinguish structured trends from range conditions and modulate smoothing and stop behavior.
Adaptive ATR Stop Engine : Expands or contracts ATR-derived stop distance based on efficiency, tightening during strong trends and widening in low-efficiency environments.
KNN Pattern Influence Layer : Applies distance-weighted historical pattern outcomes to subtly influence stop placement on both sides.
This design allows stop behavior to evolve with market context rather than reacting mechanically to price changes.
How It Works
Adaptive ML Trailing Stop evaluates price through a sequence of adaptive processes:
Efficiency-Based Regime Identification : KAMA efficiency determines whether conditions favor trend continuation or rotational movement, influencing stop sensitivity.
Volatility-Responsive Scaling : ATR-based stop distance adjusts automatically as efficiency rises or falls.
Pattern-Weighted Adjustment : KNN compares recent price sequences to historical analogs, applying confidence-based bias to stop positioning.
Adaptive Stop Smoothing : Long and short stop levels are smoothed using KAMA logic to maintain structural stability while remaining responsive.
Directional Trailing Enforcement : Stops advance only in the direction of the prevailing regime, preserving invalidation structure.
Gradient Distance Visualization : Gradient fills reflect the relative distance between price and the active stop.
Controlled Interaction Markers : Diamond markers highlight meaningful stop interactions, filtered through cooldown logic to reduce clustering.
Together, these elements form a continuously adapting trailing stop system rather than a fixed exit mechanism.
Interpretation
Adaptive ML Trailing Stop should be interpreted as a dynamic risk envelope:
Long Stop (Green) : Acts as the downside invalidation level during bullish regimes, tightening as efficiency improves.
Short Stop (Red) : Serves as the upside invalidation level during bearish regimes, adjusting width based on efficiency and volatility.
Trend State Changes : Regime flips occur only after confirmed stop breaches, filtering temporary price spikes.
Gradient Depth : Deeper gradient penetration indicates increased extension from the stop rather than imminent reversal.
Pattern Influence : KNN weighting affects stop behavior only when historical agreement is strong and remains neutral otherwise.
Distance, efficiency, and context outweigh isolated price interactions.
Signal Logic & Visual Cues
Adaptive ML Trailing Stop presents two primary visual signals:
Trend Transition Circles : Display when price crosses the opposing trailing stop, confirming a regime change rather than anticipating one.
Stop Interaction Diamonds : Indicate controlled contact with the active stop, subject to cooldown filtering to avoid excessive signals.
Alert generation is limited to confirmed trend transitions to maintain clarity.
Strategy Integration
Adaptive ML Trailing Stop fits within trend-following and risk-managed trading approaches:
Dynamic Risk Framing : Use adaptive stops as evolving invalidation levels instead of fixed exits.
Directional Alignment : Base execution on confirmed regime state rather than speculative reversals.
Efficiency-Based Tolerance : Allow greater price fluctuation during inefficient movement while enforcing tighter control during clean trends.
Pattern-Guided Refinement : Let KNN influence adjust sensitivity without overriding core structure.
Multi-Timeframe Context : Apply higher-timeframe efficiency states to inform lower-timeframe stop responsiveness.
Technical Implementation Details
Core Engine : KAMA-based efficiency measurement with adaptive smoothing
Volatility Model : ATR-derived stop distance scaled by regime
Machine Learning Layer : Distance-weighted KNN with confidence modulation
Visualization : Directional trailing stops with layered gradient fills
Signal Logic : Regime-based transitions and controlled interaction markers
Performance Profile : Optimized for real-time chart execution
Optimal Application Parameters
Timeframe Guidance:
1 - 5 min : Tight adaptive trailing for short-term momentum control
15 - 60 min : Structured intraday trend supervision
4H - Daily : Higher-timeframe regime monitoring
Suggested Baseline Configuration:
KAMA Length : 20
Fast/Slow Periods : 15 / 50
ATR Period : 21
Base ATR Multiplier : 2.5
Adaptive Strength : 1.0
KNN Neighbors : 7
KNN Influence : 0.2
These suggested parameters should be used as a baseline; their effectiveness depends on the asset volatility, liquidity, and preferred entry frequency, so fine-tuning is expected for optimal performance.
Parameter Calibration Notes
Use the following adjustments to refine behavior without altering the core logic:
Excessive chop or overreaction : Increase KAMA Length, Slow Period, and ATR Period to reinforce regime filtering.
Stops feel overly permissive : Reduce the Base ATR Multiplier to tighten invalidation boundaries.
Frequent false regime shifts : Increase KNN Neighbors to demand stronger historical agreement.
Delayed adaptation : Decrease KAMA Length and Fast Period to improve responsiveness during regime change.
Adjustments should be incremental and evaluated over multiple market cycles rather than isolated sessions.
Performance Characteristics
High Effectiveness:
Markets exhibiting sustained directional efficiency
Instruments with recurring structural behavior
Trend-oriented, risk-managed strategies
Reduced Effectiveness:
Highly erratic or event-driven price action
Illiquid markets with unreliable volatility readings
Integration Guidelines
Confluence : Combine with BOSWaves structure or trend indicators
Discipline : Follow adaptive stop behavior rather than forcing exits
Risk Framing : Treat stops as adaptive boundaries, not forecasts
Regime Awareness : Always interpret stop behavior within efficiency context
Disclaimer
Adaptive ML Trailing Stop is a professional-grade adaptive risk and regime management tool. It does not forecast price movement and does not guarantee profitability. Results depend on market conditions, parameter selection, and disciplined execution. BOSWaves recommends deploying this indicator within a broader analytical framework that incorporates structure, volatility, and contextual risk management.

SD-Range Oscillator | QuantEdgeBSD-Range Oscillator | QuantEdgeB
🔍 Overview
SD-Range Oscillator | QuantEdgeB (SDRO) is a normalized momentum oscillator that compresses a low-lag trend core into a 0–100 style range using standard-deviation (SD) bands. It builds a smooth baseline from a fast triple-smoothed average, wraps it with ±2×SD volatility bounds, then normalizes the core value inside that envelope. Clear Long/Short regimes trigger when the normalized value crosses user-defined thresholds, with optional labels, regime-colored candles, and intuitive filled zones.
✨ Key Features
1.⚡ Low-Lag Core (Triple-Smooth Engine)
- Uses a fast, low-lag triple-smoothed average as the oscillator’s primary signal input.
- Helps keep momentum readings responsive while filtering noise.
2. 📏 SD Volatility Envelope (±2×SD)
- Builds a volatility channel around a smoothed baseline using standard deviation.
- Automatically adapts to changing market turbulence.
3. 🧮 Normalized Range Output
- Converts the core signal into a normalized value by mapping it between the upper/lower SD bounds.
- Makes readings consistent across assets and timeframes.
4. 🎯 Threshold-Based Regimes
- Long when the normalized value exceeds the Long threshold.
- Short when it falls below the Short threshold.
- Includes an additional safety filter to reduce “forced” longs when price is already extended near the upper envelope.
5. 🎨 Visual Clarity & Zones
- Regime-colored oscillator line and candles.
- Filled SD bands around the baseline for quick volatility context.
- Optional highlight fills between the oscillator and thresholds to show active long/short phases.
- Extra OB/OS background zones for quick overextension awareness.
6. 🔔 Signals & Alerts
- Optional “Long/Short” labels on confirmed regime flips.
- Alert conditions fire on long/short regime crossovers.
💼 Use Cases
• Momentum Confirmation: Validate breakouts by requiring SDRO to hold above the Long threshold.
• Mean-Reversion Awareness: Watch for extreme normalized readings near upper/lower bounds.
• Regime Filtering: Use SDRO state (Long/Short/Neutral) to filter trades from other systems.
• Cross-Market Comparison: Normalization makes it easier to compare momentum across different tickers.
🎯 For Who
• Trend traders who want a clean momentum filter with adaptive volatility context.
• System builders needing a simple regime variable (1 / -1 / neutral) to gate entries.
• Discretionary traders who like visual confirmation (fills, candle coloring, threshold zones).
• Multi-asset traders who benefit from normalized, comparable oscillator readings.
⚙️ Default Settings
• TEMA Period: 7
• Base Length (SMMA): 25
• Long Threshold: 55
• Short Threshold: 45
• SD Multiplier: 2× (fixed in code)
• Color Mode: Alpha
• Color Transparency: 60
• Labels: Off by default
📌 Conclusion
SD-Range Oscillator | QuantEdgeB blends a low-lag triple-smoothed core with an adaptive SD envelope to produce a normalized, easy-to-read momentum signal. With clear threshold regimes, volatility-aware context, and strong visuals (fills + candle coloring), SDRO helps separate meaningful momentum shifts from noise across any asset or timeframe.
🔹 Disclaimer: Past performance is not indicative of future results. Always backtest and align settings with your risk tolerance and objectives before live trading.
🔹 Strategic Advice: Always backtest, optimize, and align parameters with your trading objectives and risk tolerance before live trading.

Momentum Echo Oscillator [Community Edition]Concept: The Momentum Echo Oscillator (MEO) is a modern take on classical momentum oscillators. Most indicators only look at the "now". MEO introduces the concept of Momentum Echoes—historical momentum harmonics that are weighted and blended back into the current price velocity.
Why use MEO? Standard momentum tools (like ROC or RSI) can be very "jittery" or noisy. By integrating historical echoes, MEO provides a smoother, more rhythmic representation of price flow, making it easier to spot genuine trend reversals.
Key Elements:
Primary Momentum: The immediate speed of price.
Echo Harmonics: Two adjustable lookback points that act as a "memory" for the indicator, filtering out false breakouts.
Dynamic Histogram: Visualizes the gap between the Echo Engine and the Trigger Line, highlighting acceleration and deceleration.
Settings:
Echo Weight: Adjust how much "memory" you want the indicator to have.
Smoothing: Clean up the signals for higher timeframes.
This is an open-source tool for the TradingView community. Enjoy!

ICT ORB Killzones by MaxN (15 / 30m)Trading session London, Asia, New York
orb 15/30 min selectable breakout zones with buy/sell signals

ICT ORB Killzones by MaxN (15 / 30m)Trading session open/close with first 15/30 min orbs
will just have to adjust time zones to your current time line
GMT +0
I use
Asia 23.00 - 06.00
London 07.00 - 16.00
New York 12.00 - 22.00
