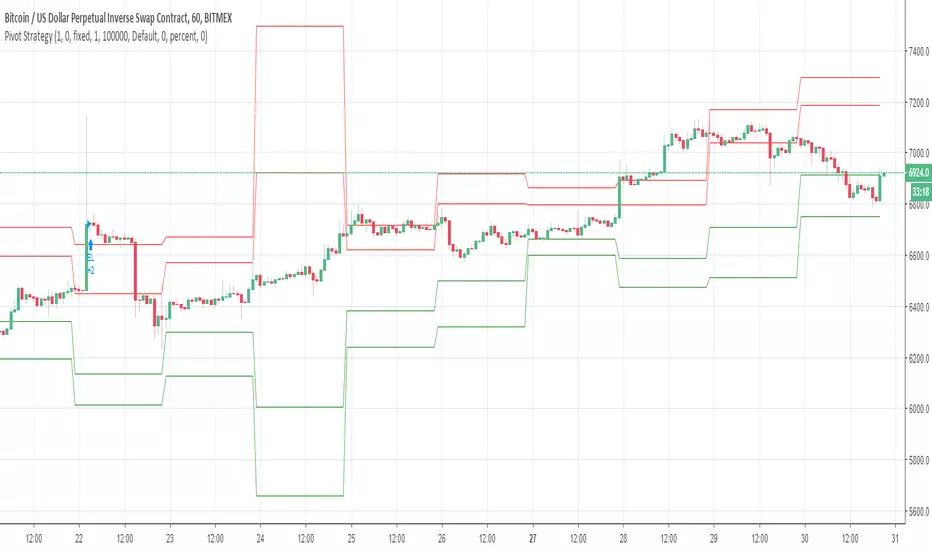
pivot point strategy(lirshah)The pivot point levels are composed of a pivot point, two higher resistance levels known as R1 and R2, and two lower pivot point supports known as S1 and S2.
Each resistance level is considered a pivot point.
this strategy gives signals based on valid pivot points( reactionary price level) and it has a good results on the variety of pairs in different markets.
Точки разворота

PP SupRes ChannelPivot points version of our channel strategy, incorporating any or all of the standard PPs commonly available.
V42: Released for debugging. Added passcode due to TV policy change regarding invite-only scripts (sorry...check for a public indicator-only version to be released soon).

Strategy - Bobo's Pivot ATR SwingHi there, welcome to my pivot ATR swing bot. I put this out there with source code hidden to see what ideas others have to use it. Also if there are any coders of trading systems out there who wanted to work with me to put this into a form that could trade automatically we could both use... I'd welcome that kind of collaboration and will happily share the underlying rules of this and the more highly developed version that isn't public.
But as it is, the signals are free for all, use them as you wish and at your own risk. If you want to discuss the code, strategy or ideas, I'm around fairly regularly just message.
The bot is fairly simple design that will give you signals for long and short intraday/week on equity futures / CFDs / ETFs. You'll see it backtests fairly well on an hourly SPX500 chart as configured. You will need to set up certain parameters to account for any different timeframes and markets you wish to trade. For me it's most effective pick out a few good swing trades per week in equity futures. However part of the idea of putting this in the public domain is to see if other people will have good but different ideas how to use it. Please share with me if so :).
The basic concept is a series of 3 lines that define the area and movement we wish to trade. The daily pivot is the central line (blue). We are looking to capture reversions to this middle line from extremes (red and green). Therefore the bot will signal exit at the close of every candle that has passed through the pivot.
Entry is decided by the outer bands around the blue line. Red is the top band, green the bottom. As configured, these are simply placed a daily ATR value apart, centred around the pivot. You can change this quite a lot though, so let's go through the settings:
Pivot Timeframe - simple, a daily pivot is calculated from the previous day's values (high + low + close)/3 . BUt the same calculation can be applied to any length candle, day, minute, month or whatever. This makes the middle target line more or less responsive to recent price action.
ATR Band Timeframe - When we calculate the average range, we need to know what candle length makes up our series. Daily candles is the default, but you can change that here.
ATR Lookback - When we calculate the average range, we need to know how many instances of the timeframe (day, minute, hour etc) we look back to create an average. The lower the lookback value, the more the width of the bands (the distance from pivot) will change quickly based on the volatility of previous candles. The higher the lookback value, the more stable the band width will be to recent volatility.
ATR divisor - The ATR value above is divided by this value, before being added or subtracted to the pivot to create the red and green lines. Default value is 2, and this means the distance from the red band to the green band will be equal to 1 ATR, as calculated according to the parameters above. Setting this to 1 would mean that each band is one ATR away from pivot (ie the bands got wider apart). Set this to 4, and it means that it is only 1/2 an ATR from green to red.
Take Profit / Stop Loss. - We know what a stop and profit target are, but worth nothing that a 0 value disables stop loss or profit targets. The bot will still close positions when crossing pivot.
Also, note the mintick value of the instrument you apply this to. For example for the CFD chart SPX500 the mintick value is 0.1. So a 100 value for stop loss = 10 points on SPX500. but if you were to trade the same thing basically, but the emini future ES, the mintick value is 0.25. So for a 10 point stop on the ES chart, you would need a value of 40 in this bot. US30 and YM have convenient mintick values of 1. Currencies can be a bit of a nightmare :).


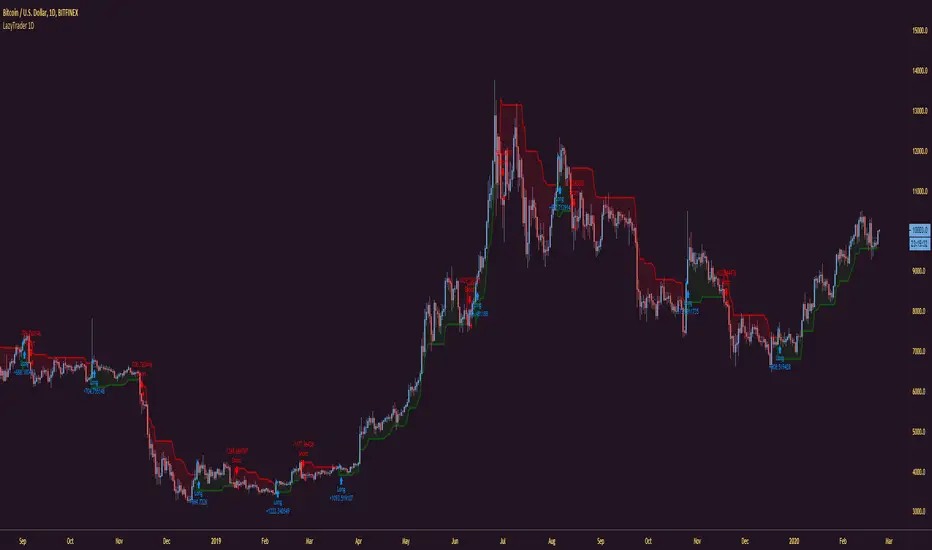
LazyTrader - BacktestingAs requested, here is a quick and basic strategy version of Lazy Trader for those who wish to play around with backtesting.
I normally only use Lazy Trader with BTC on the daily chart but because I'm getting lots of people message me asking if it can be used on lower time frames and with other pairs, I've got the demo chart / screenshot showing an example of just that. Not as good in my opinion, but yes it does work with any time frame and pair.
You can find the original as well as all of our other scripts on our profile page here : www.tradingview.com
LevelTradeV2. Indicator give to us min. and max. levels This indicator is designed to work on short-term and long-term periods.
It provides levels of resistance and support for the two options.
1) purple levels - minimum and maximum price for the shadows of candles.
2) red and green levels - over the body of a candle.
added a moving average and a profit calculator fully customizable.

Pivot StrategyThis strategy utilises pivot points to mark support and resistance levels and trades on them.

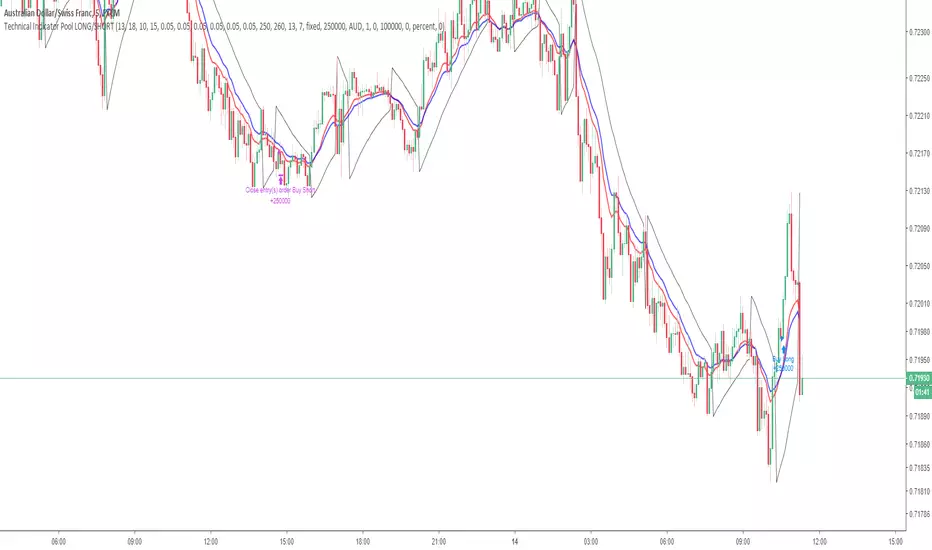
Technical Indicator PoolThis is for Bundle holders who want to use the Technical Indicator Pool for scalping binary options.
Understanding the Technical Indicator Pool
The Technical Indicator Pool is a strategy that operates on the premise that when many technical indicators project the same sentiment, they are concurrently more precise. The technical indicator pool contains five indicators
1. Small MACD Moving Average (SFMA) (10,15)
2. Large MACD Moving Average (LFMA) (13,18)
3. Parabolic Stop and Reverse (PSAR) (0.05, 0.05, 0.05)
4. Relative Strength Index (RSI) (14, 70, 30)
5. H/L Pivot (13)
When all five indicators project the same sentiment within a defined period (known as BarPeriod), an order is placed in the direction of sentiment.
Note:
Due to the nature of the indicator pool, such as the moving averages within the MACD and RSI as well as the High/Low Pivot, false positives may occur before the bar has closed within the time stamp.
This point of reference is to be used in combination with an arsenal of trading tools and should not be used as direct investment advice.
Option strategies should always include stop losses.
This strategy operates using a lot size of 2.5.
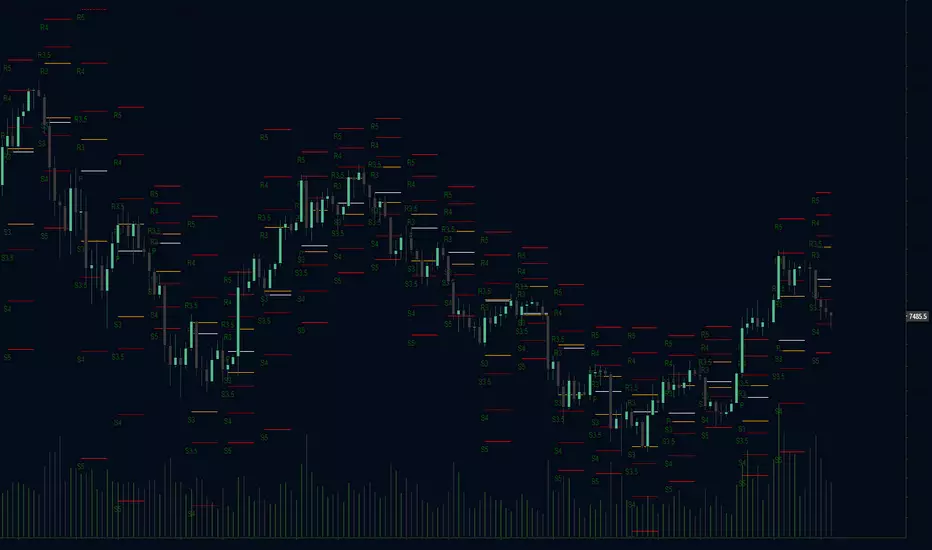
Fibonacci Camarilla Pivot Points Strategy Prototype
Camarilla pivot points with level 5 and another level 3 based on 1.618 added
Option to toggle regular Camarilla or Fibonacci based Camarilla pivot points
Option to toggle labels, candle overlay, levels, and more
Camarilla pivot points have greatly interested me due to the extremely choppy nature of the cryptocurrency market when it isn't going through a bull run. Camarilla pivot points aren't traditional pivots; the hlc3 of the previous candle close is the basis for each level, as the inventor felt that mean reversion to that previous value was likely.

Rahul's PRSThis is a test script to run pivot reversal indicator on a chart and also make it put orders based in the indicated results
Dane: RSI MACD StrategyRSI / MACD Divergence Strategy . Published for customer verification and acceptance. Unfortunately, access can only be provided to the customer.
For those interested in custom development services, please visit the backtest-rookies (.com) website for more information.
Features
RSI & Price divergence detection
Open a trade window when trade conditions are met
Enter the trade on confirmation
Stop losses / take profit custom levels based of daily pivot values

Entries and Exits (plus alerts)Simple breakout strategy that can be used for most equities, FOREX and cryptocurrencies. Inputs can be customized to suit your trading style and can be applied to any time frame chart. Comes with matching alert indicator which is useful for autotrading or just simply never missing a trade for manual trading. Please message me for access. Happy trading!
Buy&Sell Bitmex StrategyConfigured algo into TradingView through a Python upgrade 2.0.
A scalper/swingtrader indicator on the following timeframes:
- 1H
- 4H
diff (a look different on things) only work in this way if you use graph 1-5 min (longer graph less accurate )
and if you use pyramide system in setting of 10 order max and each order 100 dollar (each order 10% of equity )
its just to show a concept

High and Low Levels Backtest This script shows a high and low period value.
Width - width of lines
SelectPeriod - Day or Week or Month and etc.
LookBack - Shift levels 0 - current period, 1 - previous and etc.
You can change long to short in the Input Settings
WARNING:
- For purpose educate only
- This script to change bars colors.

Floor Pivot Points Backtest The name ‘Floor-Trader Pivot,’ came from the fact that Pivot points can
be calculated quickly, on the fly using price data from the previous day
as an input. Although time-frames of less than a day can be used, Pivots are
commonly plotted on the Daily Chart; using price data from the previous day’s
trading activity.
You can change long to short in the Input Settings
WARNING:
- For purpose educate only
- This script to change bars colors.
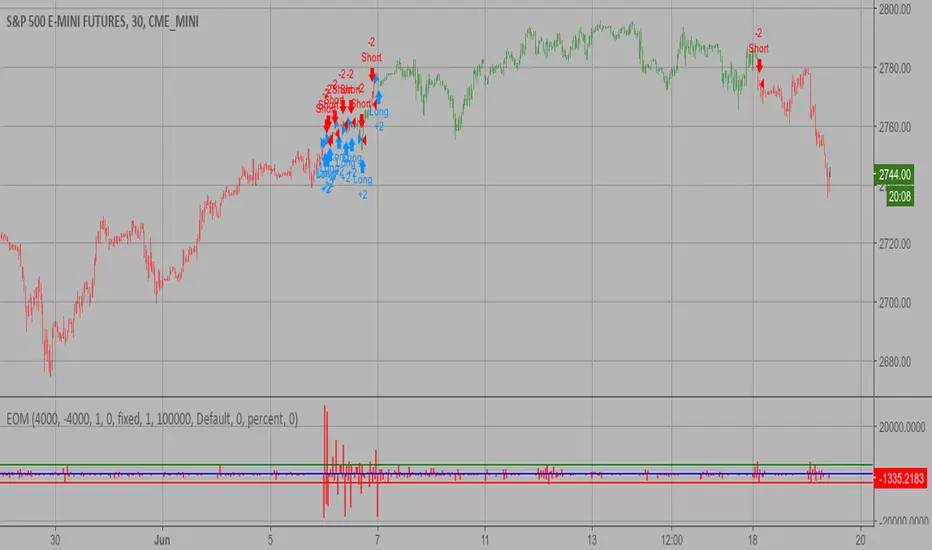
Ease of Movement (EOM) Backtest This indicator gauges the magnitude of price and volume movement.
The indicator returns both positive and negative values where a
positive value means the market has moved up from yesterday's value
and a negative value means the market has moved down. A large positive
or large negative value indicates a large move in price and/or lighter
volume. A small positive or small negative value indicates a small move
in price and/or heavier volume.
A positive or negative numeric value. A positive value means the market
has moved up from yesterday's value, whereas, a negative value means the
market has moved down.
You can change long to short in the Input Settings
WARNING:
- For purpose educate only
- This script to change bars colors.
Short Term StrategyMy Short Term Strategy,
works best on low time frames (3min - 5 min).
But keep an eye on low TR, as it will tend to trend too much.
As always, keep it safe.
Ciao!

Dynamic Pivot Point Backtest This Pivot points is calculated on the current day.
Pivot points simply took the high, low, and closing price from the previous period and
divided by 3 to find the pivot. From this pivot, traders would then base their
calculations for three support, and three resistance levels. The calculation for the most
basic flavor of pivot points, known as ‘floor-trader pivots’, along with their support and
resistance levels.
You can change long to short in the Input Settings
WARNING:
- For purpose educate only
- This script to change bars colors.


