DCA Percent SignalOverview
The DCA Percent Signal Indicator generates buy and sell signals based on percentage drops from all-time highs and percentage gains from lowest lows since ATH. This indicator is designed for pyramiding strategies where each signal represents a configurable percentage of equity allocation.
Definitions
DCA (Dollar-Cost Averaging): An investment strategy where you invest a fixed amount at regular intervals, regardless of price fluctuations. This indicator generates signals for a DCA-style pyramiding approach.
Gann Bar Types: Classification system for price bars based on their relationship to the previous bar:
Up Bar: High > previous high AND low ≥ previous low
Down Bar: High ≤ previous high AND low < previous low
Inside Bar: High ≤ previous high AND low ≥ previous low
Outside Bar: High > previous high AND low < previous low
ATH (All-Time High): The highest price level reached during the entire chart period
ATL (All-Time Low): The lowest price level reached since the most recent ATH
Pyramiding: A trading strategy that adds to positions on favorable price movements
Look-Ahead Bias: Using future information that wouldn't be available in real-time trading
Default Properties
Signal Thresholds:
Buy Threshold: 10% (triggers every 10% drop from ATH)
Sell Threshold: 30% (triggers every 30% gain from lowest low since ATH)
Price Sources:
ATH Tracking: High (ATH detection)
ATL Tracking: Low (low detection)
Buy Signal Source: Low (buy signals)
Sell Signal Source: High (sell signals)
Filter Options:
Apply Gann Filter: False (disabled by default)
Buy Sets ATL: False (disabled by default)
Display Options:
Show Buy/Sell Signals: True
Show Reference Lines: True
Show Info Table: False
Show Bar Type: False
How It Works
Buy Signals: Trigger every 10% drop from the all-time highest price reached
Sell Signals: Trigger every 30% increase from the lowest low since the most recent all-time high
Smart Tracking: Uses configurable price sources for signal generation
Key Features
Configurable Thresholds: Adjustable buy/sell percentage thresholds (default: 10%/30%)
Separate Price Sources: Independent sources for ATH tracking, ATL tracking, and signal triggers
Configurable Signals: Uses low for buy signals and high for sell signals by default
Optional Gann Filter: Apply Gann bar analysis for additional signal filtering
Optional Buy Sets ATL: Option to set ATL reference point when buy signals occur
Visual Debug: Detailed labels showing signal parameters and values
Usage Instructions
Apply to Chart: Use on any timeframe (recommended: 1D or higher for better signal quality)
Risk Management: Adjust thresholds based on your risk tolerance and market volatility
Signal Analysis: Monitor debug labels for detailed signal information and validation
Signal Logic
Buy signals are blocked when ATH increases to prevent buying at peaks
Sell signals are blocked when ATL decreases to prevent selling at lows
This ensures signals only trigger on subsequent bars, not the same bar that establishes new reference points
Buy Signals:
Calculate drop percentage from ATH to buy signal source
Trigger when drop reaches threshold increments (10%, 20%, 30%, etc.)
Always blocked on ATH bars to prevent buying at peaks
Optional: Also blocked on up/outside bars when Gann filter enabled
Sell Signals:
Calculate gain percentage from lowest low to sell signal source
Trigger when gain reaches threshold increments (30%, 60%, 90%, etc.)
Always blocked when ATL decreases to prevent selling at lows
Optional: Also blocked on down bars when Gann filter enabled
Limitations
Designed for trending markets; may generate many signals in sideways/ranging markets
Requires sufficient price movement to be effective
Not suitable for scalping or very short timeframes
Implementation Notes
Signals use optimistic price sources (low for buys, high for sells), these can be configured to be more conservative
Gann filter provides additional signal filtering based on bar types
Debug information available in data window for real-time analysis
Detailed labels on each signal show ATH, lowest low, buy level, sell level, and drop/gain percentages
Public

FBMAEN:
TradingView indicator for FBMA strategy
People oftem ask: “Dmitry, BABA, TSLA, AAPL flies like a rocket! Well, what are we buying!?” - And I say no, the price does not act like a straight rocket upwards or downwards, instead it breathes, inhales moving away from the moving average and exhales returning to it, so we will wait for the first pullback and buy exactly at the value of the moving average.
Your new paradigm: wait for the stock to pull back to the moving average rather than chasing the price
And one more thing... Remember, you don't want to buy a stock when it's going down, you'll start to have doubts. it's against human nature to go long when the price is falling, but that's why this strategy works so well. We buy on the price rollback (pullback to the moving average), but we DO IT WHILE FOLLOWING THE TREND.
The biggest consequence of this strategy, my author's FBMA strategy and this is a game changer (results are in the comments).
So, let's dive into FBMA indicator settings:
Main settings
ATR Period — Period of intergrated ATR Indicator(shows ATR in a small dashboard);
Settings of Moving Averages
Sign Moving Averages? — shows values of moving averages near their lines on the chart;
Fix MAs' signatures overlapping? — automatically MAs' signatures overlapping (specifically for SMAs and EMAs!) ;
Fix MAs' signatures overlapping between SMAs and EMAs? — automatically group overlapping between EMAs' and SMAs' signatures;
Min distance between MAs' signatures (in % of ATR) — minimal distance between MAs' signatures that indicator will push away MAs' signatures from each other if they are overlapped;
Dashboard
Dashboard position — position of dashboard on the chart ( 9 options ).
Settings of MAs
Source;
Period;
Option for showing EMA and/or SMA of chosen period and source;
Line colour ;
Signature colour .
Addons
Show data by selected timeframe? — shows difference of current price opening and opening a "timeframe" time ago;
Shows MAs only if asset has grown by selected growth % in selected timeframe?
Growth, % — percent, which asset has to gain in order for MAs to be plotted;
Timeframe — frequency with which price's current and previous opening are being will be compared;
Show analog MAs' signatures? — shows MAs' value in a small table;
Show cloud between 1st and 2nd MAs? — shows cloud for both EMAs and SMAs simultaneously).
Price Action
This settings are intuitively understandable
Feel free to leave your questions or suggestions in the comments!
* Price Action-section was taken from ChrisMoody's CM_Price_Action and rebuilt.
RU:
Индикатор TradingView для стратегии ПООС
Мне часто пишут в личку: “Дмитрий, BABA, TSLA , AAPL летит ракетой! Ну что покупаем!?”- А я говорю нет, цена не летит по прямой ракетой вверх, она дышит, делает вдохи отдаляясь от скользящей и выдохи возвращаясь к ней, поэтому мы дождёмся первого пуллбэка и купим точно на значении скользящей
Ваша новая парадигма: ждать акцию на пуллбэке к скользящей по тренду, а не гнаться за ценой
И ещё… Помните, вы не захотите покупать акцию в момент, когда она падает, вы начнете сомневаться т.к. это против человеческой природы заходить в лонг при падении цены, но именно поэтому эта стратегия работает так эффективно, т.к. мы покупаем на откате цены (пуллбэке к скользящей), но ПО ТРЕНДУ
Самое большее следствие из этой стратегии, моя авторская стратегия ПООС и это гейм-чейнджер (результаты в комментариях).
Итак, давайте посмотрим сами настройки индикатора:
Основные настройки
ATR Period — период интегрированного индикатора ATR (показывает ATR на небольшой панели);
Настройки скользящих средних
Sign Moving Averages? — показывает значения скользящих средних рядом с их линиями на графике;
Исправить перекрытие сигнатур МА? — автоматически сигнатуры СС перекрываются (специально для SMA и EMA!) ;
Исправить перекрытие сигнатур МА между SMA и EMA? — автоматически группировать перекрытие между сигнатурами EMA и SMA;
Минимальное расстояние между сигнатурами скользящих средних (в % от ATR) — минимальное расстояние между сигнатурами скользящих средних, при котором индикатор будет отталкивать сигнатуры скользящих средних друг от друга, если они перекрываются;
Панель управления
Dashboard position — положение таблицы на графике ( 9 вариантов ).
Настройки МА
Source;
Период;
Опция отображения EMA и/или SMA выбранного периода и source;
Цвет линии ;
Цвет подписи .
Дополнения
Показать данные по выбранному таймфрейму? — показывает разницу текущей цены открытия и цены открытия в прошлом, по времени равному величины параметра "Таймфрейм";
Показывает MA только в том случае, если актив вырос на выбранный % роста за выбранный период времени?
Прирост, % — процент, на который актив должен набраться, чтобы скользящие средние были построены;
Таймфрейм — частота, с которой будет сравниваться текущее и предыдущее открытие цены;
Показать сигнатуры аналоговых МА? — показывает значение МА в небольшой таблице;
Показать облако между 1-й и 2-й скользящими средними? — показывает облако для EMA и SMA одновременно).
Price Action
Эти настройки будут интуитивно понятны
Оставляете свои вопросы и предложения в комментариях, всё учтём!
* Price Action-section was taken from ChrisMoody's CM_Price_Action and rebuilt.

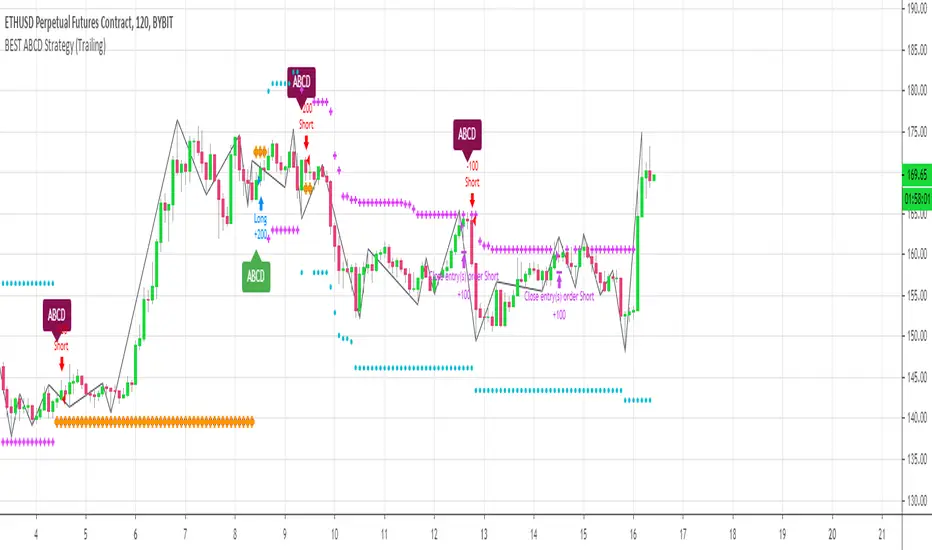
[Daveatt] BEST ABCD Pattern Strategy (Trailing SL + TP)Hello traders
This is the strategy version of my ABCD pattern. I added the Trailing Stop and Trailing Profit upon a follower request
I - Concept
I present to you, ladies and gentlemen, the first screener for harmonic patterns .
Starting with an ACBD pattern screener this time!!
I used the calculations from Ricardo Santo's script
In short, he's using fractals (regular or Bill Williams ) for the pattern calculations. A masterpiece !!!
II - Definitions
The ABCD pattern ( AB=CD ) is one of the classic chart patterns which is repeated over and over again.
The ABCD pattern shows perfect harmony between price and time.
The Williams Fractal is an indicator, developed by Bill Williams , that aims to detect reversal points (highs and lows) and marks them with arrows.
Up fractals and down fractals have specific shapes. The Williams Fractal indicator helps users determine in which direction price will develop
💎Strategy filters💎
I included some cool backtest filters:
- Trailing stop with trigger concept coming from this Trailing Stop Strategy
- Trailing profit with trigger coming from this Trailing Profit Strategy
Last words
It works for all asset classes (Forex, crypto, indices, etc...) and does not repaint
All the BEST
Dave