Hashrate to Securities RatioTMcV
HashSecRatio Original
January,30,2021
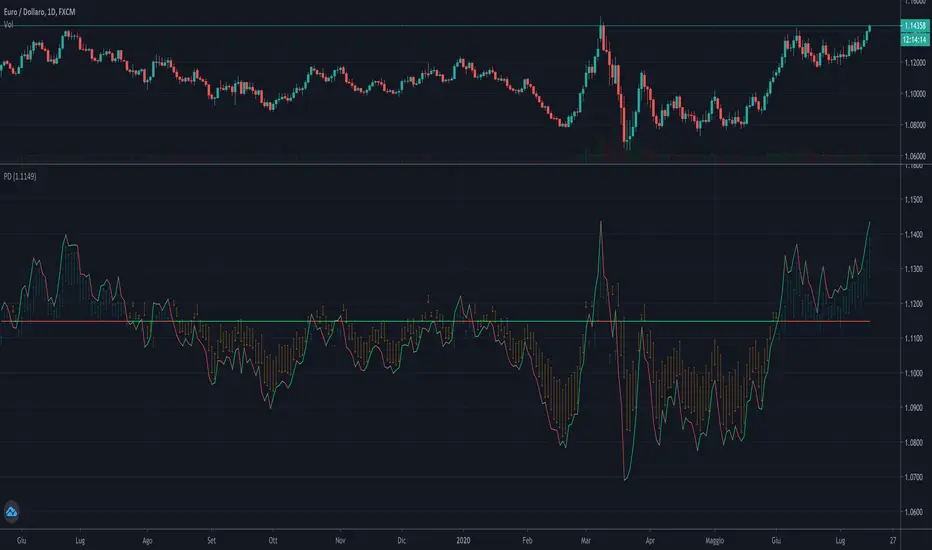
The Hashrate to securities ratio is a study to get a view on data flowing through the blockchain and can be applied to any asset available in Tradingview.
This indicator illustrates asset performance vs the moving average of BTC hash rate and accurately highlights price trend tops and bottoms allowing for excellent entry points in long and short trades highlighting overbought and oversold conditions in custom timeframes.
I will allow protected access for a short period of time to gather public opinion after that access will be limited to paid only.
For now if you would like to use this script please leave a comment and add to your favorite scripts.
Ratio

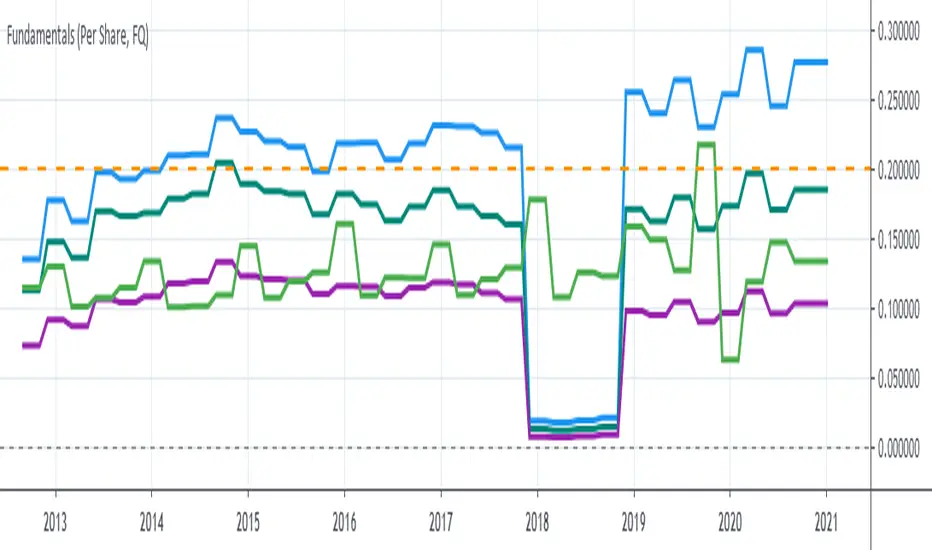
P1 FundamentalsP1 is because to me, this is a priority 1 indicator, so I have P1 and P2 indicators ordered on the favorite list.
What can you check on the selection pane?
On “period”, you can show the data related to:
the fiscal quarters
or the fiscal years.
You can select a pack of financial data that I have organized in sections:
Revenue & earnings
EPS & DPS (EPS, EPS estimate, DPS and dividend payout ratio )
Debt (total debt, total equity and cash & equivalents)
Returns (ROE, ROIC, ROA and R&D revenue to ratio)
I recommend to just select one of them, in other case the chart is a mess.
Any feedback on the code is welcome!!
GBTC premium as a percentage of the bitcoin pricePlots the GBTC premium as a percentage of the bitcoin price at the close. It also includes the annual management fee (2% at the moment). It accrues on a daily, weekly or monthly basis depending on the chart resolution. (intraday not supported) The amount of bitcoin per gbtc share and the annual fee may be changed by Grayscale in the future. Those values can be easily update in the script settings.

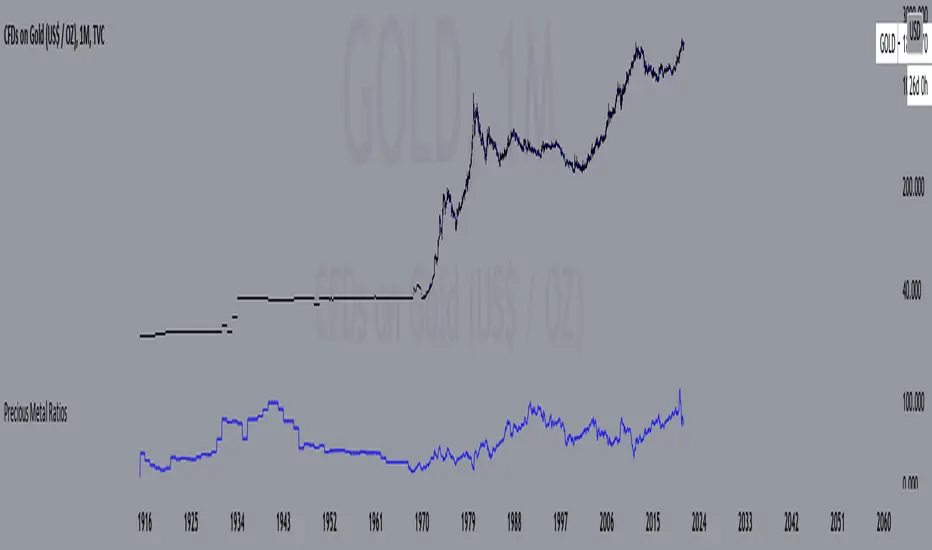
Precious Metal RatiosThis is a script that shows the ratios of precious metals, including Gold, Silver, Platinum, Palladium, Copper, Aluminum, and Steel.
You can choose your desired base currency and quote currency. The default ratio is Gold/Silver, where Gold is the base currency and Silver is the quote.
To use, just select your current timeframe from the menu.
Includes an option for repainting -- default value is true, meaning the script will repaint the current bar.
False = Not Repainting = Value for the current bar is not repainted, but all past values are offset by 1 bar.
True = Repainting = Value for the current bar is repainted, but all past values are correct and not offset by 1 bar.
In both cases, all of the historical values are correct, it is just a matter of whether you prefer the current bar to be realistically painted and the historical bars offset by 1, or the current bar to be repainted and the historical data to match their respective price bars.
As explained by TradingView,`f_security()` is for coders who want to offer their users a repainting/no-repainting version of the HTF data.
FAIR P/E BASED ON INTEREST RATESJust a different way to view S&P 500 valuations versus the standard look of looking at raw PE. Current yield of the 10 Year Bonds are used to calculate a fair value for the SPX.
This is a methodology that Buffett uses to measure value.
Recommend turning off most plots and just plotting PE and/or PE10 percent difference only.
The "slope and intercept" inputs should be left alone unless you recalculate them with updated data.
The "current PE and PE10" inputs can be found here: www.multpl.com This is a daily estimated value.
The full calculated value is released once per month, and is what Quandl has. Change these numbers if you want today's updated values.
Once you have the study set up the way you want, I recommend saving the defaults (bottom left corner in the settings screen).

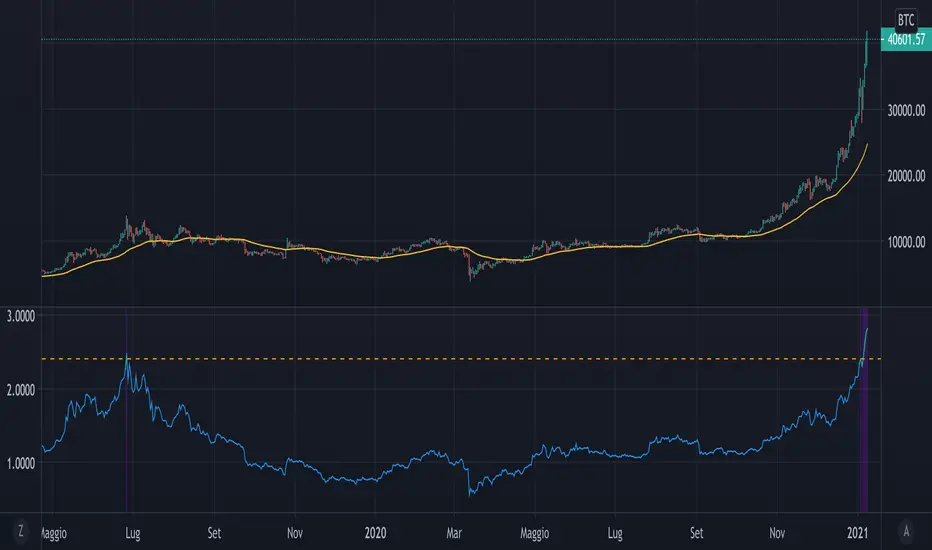
Mayer MultipleThe script implements a custom version of the Mayer multiple and it may be useful for analyzing the price of Bitcoin in a historical context.
Note n.1: Mayer multiple does not tell whether to buy, sell or hold, but highlights the best long-term area when the bitcoin price is below a threshold value (2.4).
Note n.2: the threshold value (2.4) has been determined in the past by simulations performed.
The script user may decide whether to use the shown graph or another graph for the calculation of the Mayer multiple.
The script is very easy to use and it is possible to change the following parameters:
the period of SMA (default value is 200)
the threshold (default value 2.4)
Show or not the sell area
Use or not the shown graph to calculate the Mayer multiple (default value is true)
name of exchange to use for calculation of the Mayer multiple (default value is BNC)
name of chart to use for calculation of the Mayer multiple (default value is BLX)
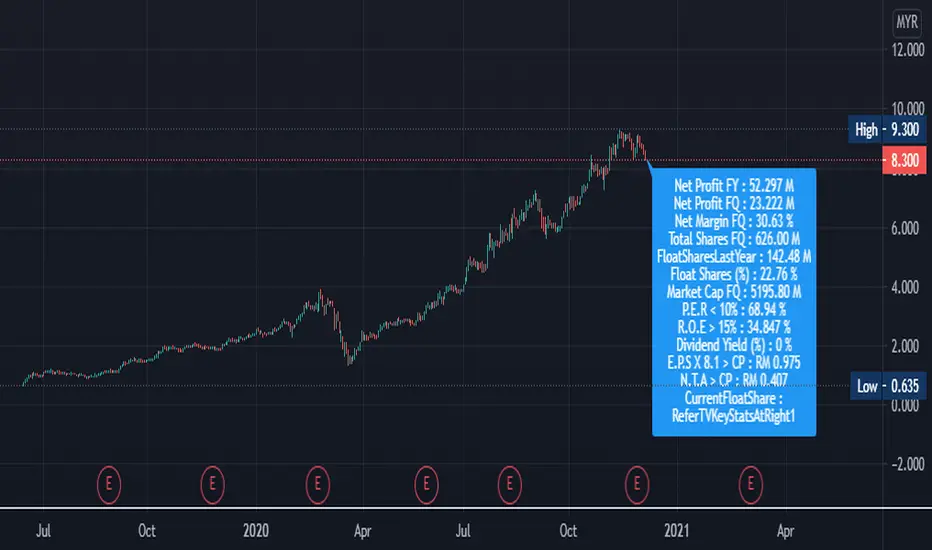
5 Magic Numbers + Extra DataAdditional Float Public Shares Percentage%.
Easily getting data and making decision
"FQ = FQ means the financial year of Latest Quarter Report Data"
"FY = FY means the financial year of Latest Last Year Data"
"TTM = TTM means the financial year of Latest past 12 consecutive months of a company’s performance data"
Net Profit Y : FY
Net Profit Qcurrent : FQ
Net Margin Q (%) : FQ
Total Shares : FQ
Float Public shares : FY
Market Cap : Current Value
P.E.R < 10% : FY
R.O.E Cap > 15% :FY
Dividend Yield (%) :FY
E.P.S X 8.1 < Current Price ( RM ) :TTM
N.T.A < Current Price ( RM ) :FQ
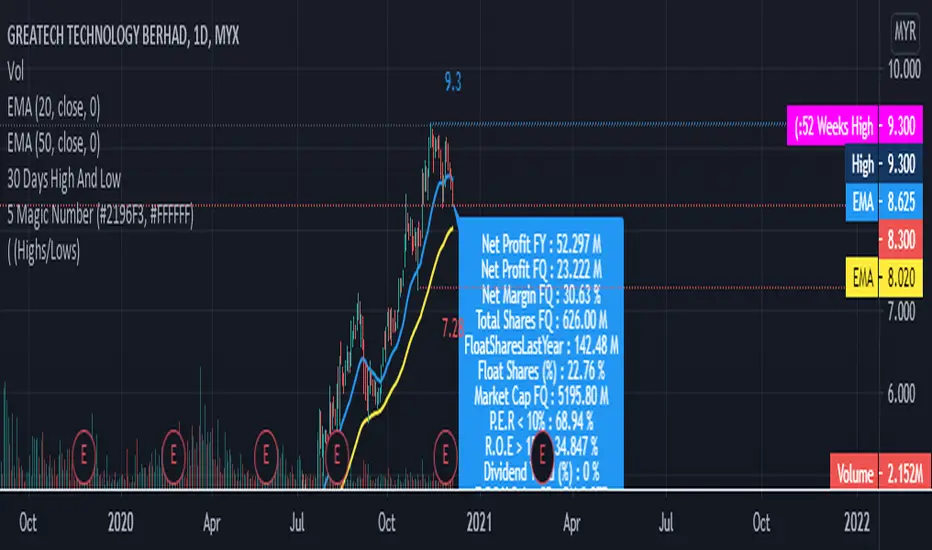
5 Magic Numbers CB7This script is actually 5 magic numbers and other data that being extract from TradingView itself for Bursa Market. Make it easy for us to read the data. Hopefully we can succeed together in our Trading Life
Real Value by AxbofReal Value is a measure of what an asset is worth. This measure is arrived at by means of an objective calculation or complex financial model, rather than using the currently trading market price of that asset.
In financial analysis this calculation method is used in conjunction with the work of identifying, as nearly as possible, the underlying value of a company and its cash flow.
By performing a calculation of the company's financials, however, the findings might show that the company is undervalued.
In the end, however, any such estimation is at least partly subjective. The analyst compares the value derived by this model to the asset's current market price to determine whether the asset is overvalued or undervalued.
In financial analysis, Real value by Axbof is the calculation of an asset's worth based on a financial model.
investors should keep in mind that the Real Price Calculation Result is only an estimate.
TÜRKÇE
Yatırımcı olarak sizler, bu indikatör tarafından hesaplanan değeri, hissenin aşırı değerli mi yoksa düşük değerli mi olduğunu belirlemek için varlığın cari piyasa fiyatı ile karşılaştırmak için kullanabilirsiniz.
Şirketin Net Varlık Değeri Hesaplanmakta (Kısa, Uzun Vadeli Borçlar ve Aktifler ile)
ardından Şirketin Ödenmiş Sermayesi ile oranının hesaplanması ile oluşturulan bir modelidir.
Hesaplanan Bu Değer, bir varlığın değerinin gerçek içsel ölçüsüdür. Bu ölçüme, o varlığın hali hazırda işlem gören piyasa fiyatını kullanmak yerine objektif bir hesaplama (mali ve finansal değerler) yoluyla ulaştım.
Finansal analizde bu İçsel Değer hesaplama yöntemi, bir şirketin temel değerini ve nakit akışını mümkün olduğu kadar yakın bir şekilde belirleme çalışmasıyla bağlantılı olarak kullanılır.
Bununla birlikte, şirketin mali durumunun bir hesaplamasını yaparak, bulgular şirketin değerinin düşük veya yüksek olduğunu gösterebilir.
Yatırımcılar, İçsel Hesaplama Sonucunun yalnızca bir tahmin olduğunu unutmamalıdır.

Rise from All Time LowThis very simple script lets you see how much the asset rose from the All Time Low (ATL).
First, the ATL is calculated and plotted. Then, we measure the distance from ATL and current bar close.
Two labels are plotted :
ATL label
Current close label with rise and rise
It can be useful for penny stocks trading when you want to buy lows but must see how much the price rose last bars to improve entries.
For example, SQBG is actually "only" at x 1.85 from ATL (not an advice in investment) :
If you have ideas to complete or improve this script, let me know in comments ;)

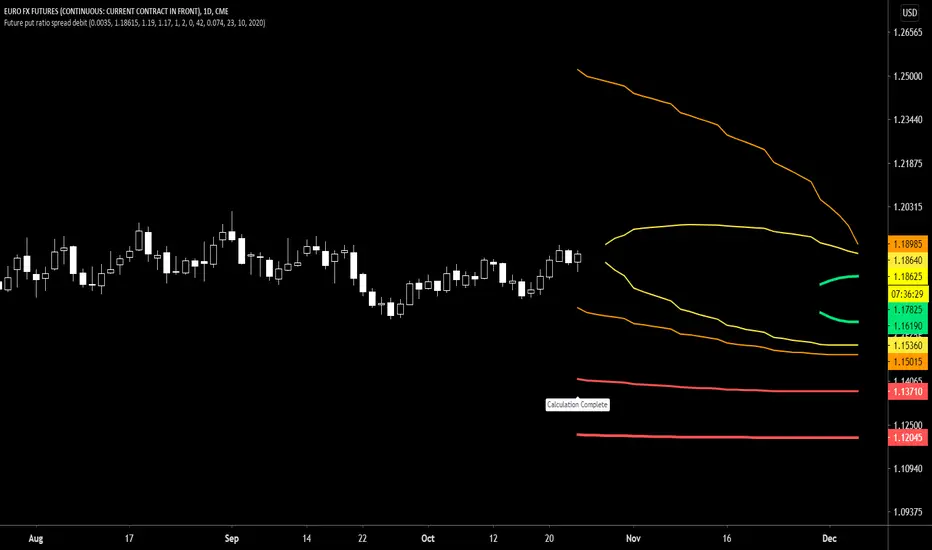
Future put ratio spread debit indicatorFuture Put ratio spread debit indicator developed by Chobotaru Brothers.
You need to have basic knowledge in option trading to use this indicator!
This spread is a DEBIT SPREAD.
The indicator shows P&L lines of the options strategy. Use only for futures since the mathematical model of options for Future instruments is different from stocks. Plus, the days' representation in futures is also different from stocks (stocks have fewer days than futures ).
***Each strategy in options is based on different mathematical equations, use this indicator only for the strategy in the headline.***
What does the indicator do?
The indicator is based on the Black-Scholes model, which uses partial differential equations to determine the option pricing. Due to options non-linear behavior, it is hard to visualize the option price. The indicator calculates the solutions of the Black-Scholes equation and plots them on the chart so traders can view how the option pricing will behave.
How the indicator does it?
The indicator uses five values (four dominants and one less dominant) to solve the Black-Scholes equation. The values are stock price, the strike price of the option, time to expiration, risk-free interest rate, and implied volatility .
How the indicator help the users?
-View the risks and rewards so you can know the profit targets in advance which means you can compare different options in different strikes.
-View the volatility change impact so you can know the risk and the P&L changes in case of a change in the volatility over the life of the option before you enter the trade.
-View the passage of time impact so you can know where and when you could realize a profit.
-Multi-timeframes so you can stay on the same chart (Daily and below).
All these features are to help the user improve his analysis while trading options.
How to use it?
The user needs to obtain from the “option chain” the following inputs:
-Debit paid: The debit paid for one unit of options strategy. Minimum value: 0.00001.
-Instrument price when entered spread: the stock price when you enter the options strategy.
-Upper strike price: the upper strike price of the options strategy.
-Lower strike price: the lower strike price of the options strategy.
- Upper Strike numbers of puts . This number has to be less than the number of puts that were sold.
- Lower Strike number of puts . This number has to be greater than the number of puts that were bought.
-Interest rate: find the risk-free interest rate from the U.S. DEPARTMENT OF THE TREASURY. Example: for 2% interest rate, input: 0.02.
-Days to expire: how many days until the option expires.
-Volatility: the implied volatility of the option bought/sold. Example: for 45% implied volatility , input: 0.45.
-Day of entry: A calendar day of the month that the option bought/sold.
-Month of entry: Calendar month the option bought/sold.
-Year of entry: Calendar year the option bought/sold.
After entering all the inputs, press Ok and you should see “Calculation Complete” on the chart.
The user should not change the entry date and days to expire inputs as time passes after he entered the trade.
How to access the indicator?
Use the link below to obtain access to the indicator
Future put ratio spread credit indicatorFuture Put ratio spread credit indicator developed by Chobotaru Brothers.
You need to have basic knowledge in option trading to use this indicator!
This spread is a CREDIT SPREAD.
The indicator shows P&L lines of the options strategy. Use only for futures since the mathematical model of options for Future instruments is different from stocks. Plus, the days' representation in futures is also different from stocks (stocks have fewer days than futures ).
***Each strategy in options is based on different mathematical equations, use this indicator only for the strategy in the headline.***
What does the indicator do?
The indicator is based on the Black-Scholes model, which uses partial differential equations to determine the option pricing. Due to options non-linear behavior, it is hard to visualize the option price. The indicator calculates the solutions of the Black-Scholes equation and plots them on the chart so traders can view how the option pricing will behave.
How the indicator does it?
The indicator uses five values (four dominants and one less dominant) to solve the Black-Scholes equation. The values are stock price, the strike price of the option, time to expiration, risk-free interest rate, and implied volatility .
How the indicator help the users?
-View the risks and rewards so you can know the profit targets in advance which means you can compare different options in different strikes.
-View the volatility change impact so you can know the risk and the P&L changes in case of a change in the volatility over the life of the option before you enter the trade.
-View the passage of time impact so you can know where and when you could realize a profit.
-Multi-timeframes so you can stay on the same chart (Daily and below).
All these features are to help the user improve his analysis while trading options.
How to use it?
The user needs to obtain from the “option chain” the following inputs:
-Credit received: The credit received for one unit of options strategy. Minimum value: 0.00001.
-Instrument price when entered spread: the stock price when you enter the options strategy.
-Upper strike price: the upper strike price of the options strategy.
-Lower strike price: the lower strike price of the options strategy.
- Upper Strike numbers of puts . This number has to be less than the number of puts that were sold.
- Lower Strike number of puts . This number has to be greater than the number of puts that were bought.
-Interest rate: find the risk-free interest rate from the U.S. DEPARTMENT OF THE TREASURY. Example: for 2% interest rate, input: 0.02.
-Days to expire: how many days until the option expires.
-Volatility: the implied volatility of the option bought/sold. Example: for 45% implied volatility , input: 0.45.
-Day of entry: A calendar day of the month that the option bought/sold.
-Month of entry: Calendar month the option bought/sold.
-Year of entry: Calendar year the option bought/sold.
After entering all the inputs, press Ok and you should see “Calculation Complete” on the chart.
The user should not change the entry date and days to expire inputs as time passes after he entered the trade.
How to access the indicator?
Use the link below to obtain access to the indicator

Future call ratio spread debit indicatorFuture Call ratio spread debit indicator developed by Chobotaru Brothers.
You need to have basic knowledge in option trading to use this indicator!
This spread is a DEBIT SPREAD.
The indicator shows P&L lines of the options strategy. Use only for stocks since the mathematical model of options for Future instruments is different from futures . Plus, the days' representation in futures is also different from stocks (stocks have fewer days than futures ).
***Each strategy in options is based on different mathematical equations, use this indicator only for the strategy in the headline.***
What does the indicator do?
The indicator is based on the Black-Scholes model, which uses partial differential equations to determine the option pricing. Due to options non-linear behavior, it is hard to visualize the option price. The indicator calculates the solutions of the Black-Scholes equation and plots them on the chart so traders can view how the option pricing will behave.
How the indicator does it?
The indicator uses five values (four dominants and one less dominant) to solve the Black-Scholes equation. The values are stock price, the strike price of the option, time to expiration, risk-free interest rate, and implied volatility .
How the indicator help the users?
-View the risks and rewards so you can know the profit targets in advance which means you can compare different options in different strikes.
-View the volatility change impact so you can know the risk and the P&L changes in case of a change in the volatility over the life of the option before you enter the trade.
-View the passage of time impact so you can know where and when you could realize a profit.
-Multi-timeframes so you can stay on the same chart (Daily and below).
All these features are to help the user improve his analysis while trading options.
How to use it?
The user needs to obtain from the “option chain” the following inputs:
-Debit paid: The debit paid for one unit of options strategy. Minimum value: 0.00001.
-Instrument price when entered spread: the stock price when you enter the options strategy.
-Upper strike price: the upper strike price of the options strategy.
-Lower strike price: the lower strike price of the options strategy.
- Upper Strike numbers of calls . This number has to be greater than the number of calls that were bought.
- Lower Strike number of calls . This number has to be less than the number of calls that were sold.
-Interest rate: find the risk-free interest rate from the U.S. DEPARTMENT OF THE TREASURY. Example: for 2% interest rate, input: 0.02.
-Days to expire: how many days until the option expires.
-Volatility: the implied volatility of the option bought/sold. Example: for 45% implied volatility , input: 0.45.
-Day of entry: A calendar day of the month that the option bought/sold.
-Month of entry: Calendar month the option bought/sold.
-Year of entry: Calendar year the option bought/sold.
After entering all the inputs, press Ok and you should see “Calculation Complete” on the chart.
The user should not change the entry date and days to expire inputs as time passes after he entered the trade.
How to access the indicator?
Use the link below to obtain access to the indicator

Future Call ratio spread credit indicatorFuture Call ratio spread credit indicator developed by Chobotaru Brothers.
You need to have basic knowledge in option trading to use this indicator!
This spread is a CREDIT SPREAD.
The indicator shows P&L lines of the options strategy. Use only for futures since the mathematical model of options for Future instruments is different from stocks. Plus, the days' representation in futures is also different from stocks (stocks have fewer days than futures ).
***Each strategy in options is based on different mathematical equations, use this indicator only for the strategy in the headline.***
What does the indicator do?
The indicator is based on the Black-Scholes model, which uses partial differential equations to determine the option pricing. Due to options non-linear behavior, it is hard to visualize the option price. The indicator calculates the solutions of the Black-Scholes equation and plots them on the chart so traders can view how the option pricing will behave.
How the indicator does it?
The indicator uses five values (four dominants and one less dominant) to solve the Black-Scholes equation. The values are stock price, the strike price of the option, time to expiration, risk-free interest rate, and implied volatility .
How the indicator help the users?
-View the risks and rewards so you can know the profit targets in advance which means you can compare different options in different strikes.
-View the volatility change impact so you can know the risk and the P&L changes in case of a change in the volatility over the life of the option before you enter the trade.
-View the passage of time impact so you can know where and when you could realize a profit.
-Multi-timeframes so you can stay on the same chart (Daily and below).
All these features are to help the user improve his analysis while trading options.
How to use it?
The user needs to obtain from the “option chain” the following inputs:
-Credit received: The credit received for one unit of options strategy. Minimum value: 0.00001.
-Instrument price when entered spread: the stock price when you enter the options strategy.
-Upper strike price: the upper strike price of the options strategy.
-Lower strike price: the lower strike price of the options strategy.
- Upper Strike numbers of calls . This number has to be greater than the number of calls that were bought.
- Lower Strike number of calls . This number has to be less than the number of calls that were sold.
-Interest rate: find the risk-free interest rate from the U.S. DEPARTMENT OF THE TREASURY. Example: for 2% interest rate, input: 0.02.
-Days to expire: how many days until the option expires.
-Volatility: the implied volatility of the option bought/sold. Example: for 45% implied volatility , input: 0.45.
-Day of entry: A calendar day of the month that the option bought/sold.
-Month of entry: Calendar month the option bought/sold.
-Year of entry: Calendar year the option bought/sold.
After entering all the inputs, press Ok and you should see “Calculation Complete” on the chart.
The user should not change the entry date and days to expire inputs as time passes after he entered the trade.
How to access the indicator?
Use the link below to obtain access to the indicator

Ratio Between Two SymbolsThis scripts displays the ratio of any two symbols. The ratio is shown on a second chart.
A multiplier may be added to the ratio, and moving average is calculated.

Position CalculatorThis script calculates how much cryptos or dollars you have to bet with 4 variables : Risk Loss , Leverage, Entry and Stop Loss.
When you want to open a position, just complete the parameters and the script will tell you how much you have to bet in dollars or cryptos units, depending the way you're trading.
Note : don't foreget that you have to pay fees on exchanges whose are not included here, specially with high leverage trades.

Fast ROI checker 50% Gann RetracementThis script is based on the Gann's 50% Retracement rule.
First, the ATH (All Time High) and ATL (All Time Low) are calculated; then, the 50% retracement level is found.
With this 50% level, we'll calculate the maximum price entry to keep a ROI which is set in the parameters.
For exemple, I only want to buy assets which can make a x16 before the 50% retracement , the script will calculate the maximum entry to respect this ROI .
If the Max entry price is above the ATL , the line will be green; if not, the line will be red.
To faster the search in the watchlist, when the price is between the Max Entry line and the ATL line, the background is painted in green.
It's not an investment strategy, you have to find your proper indicators to make purchases.
Enjoy !

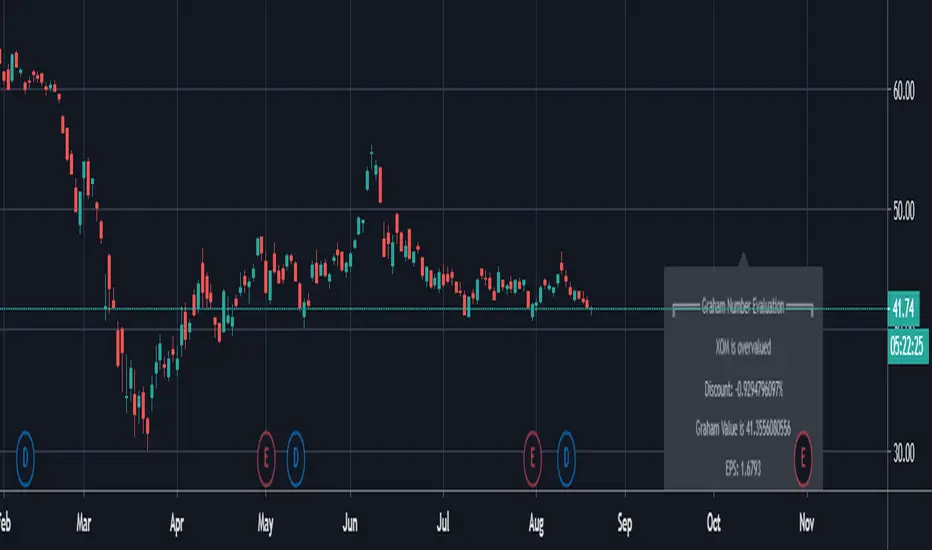
Graham FormulaThis is an Tradingview implementation of the Grahams Formula as described in Benjamin Grahams book "The Intelligent Investor".
In theory this can be used to screen for over- and undervalued stocks, however as Graham himself notes, you should look into other fundamentals when using them in conjunction with Grahams formula.
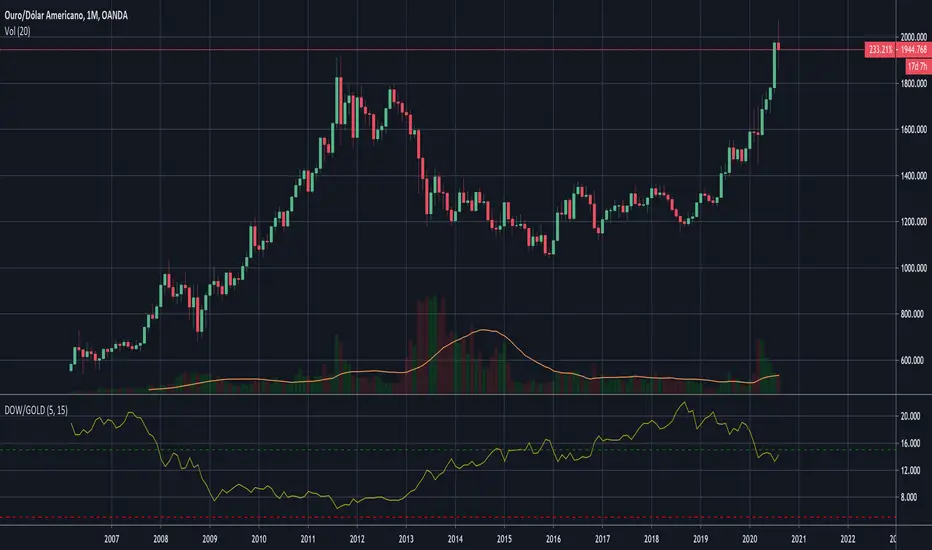
Dow to Gold RatioDisplays as an indicator the Dow to Gold Ratio.
Rules of this long-term trade:
The Dow-to-Gold ratio is guide for when to get in and out of stocks. When the ratio goes below 5, we buy equal shares in the Dow Jones Industrial Average index (the Dow). When the ratio goes above 15, we sell the Dow and buy gold.
In other words, when the entire Dow can be bought for five ounces of gold, we buy stocks. When it takes 15 ounces or more to buy the Dow, we sell stocks and buy gold.
Over the past 100 years, you would have made a total of six trades based on this strategy.
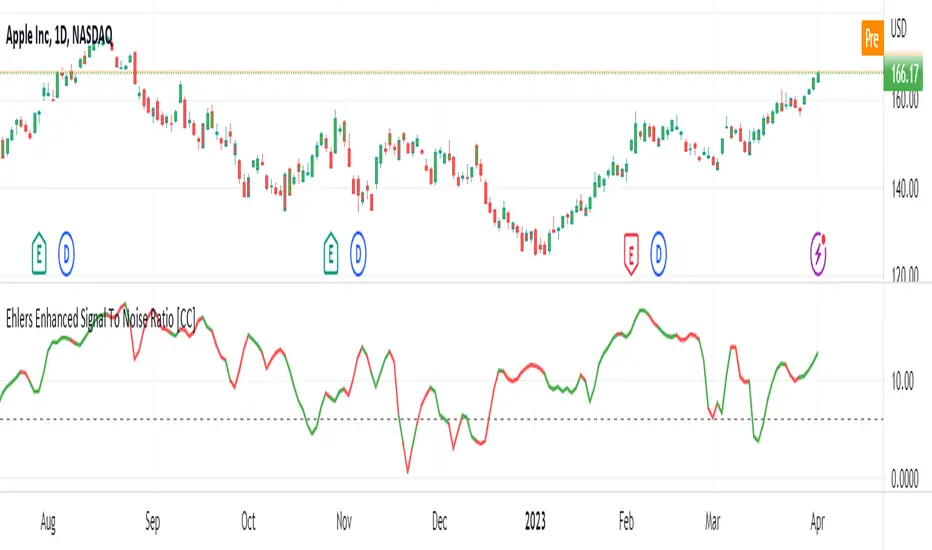
Ehlers Enhanced Signal To Noise Ratio [CC]The Enhanced Signal To Noise Ratio was created by John Ehlers (Rocket Science For Traders pgs 87-88) and this is my favorite Ehlers Signal To Noise Ratio indicator. Scalpers like to use this indicator because when it is above the dotted line then the stock is trending and not trading sideways. Buy when the indicator line is green and sell when it is red.
Let me know when you want to see me publish other indicators or if you want something custom done!
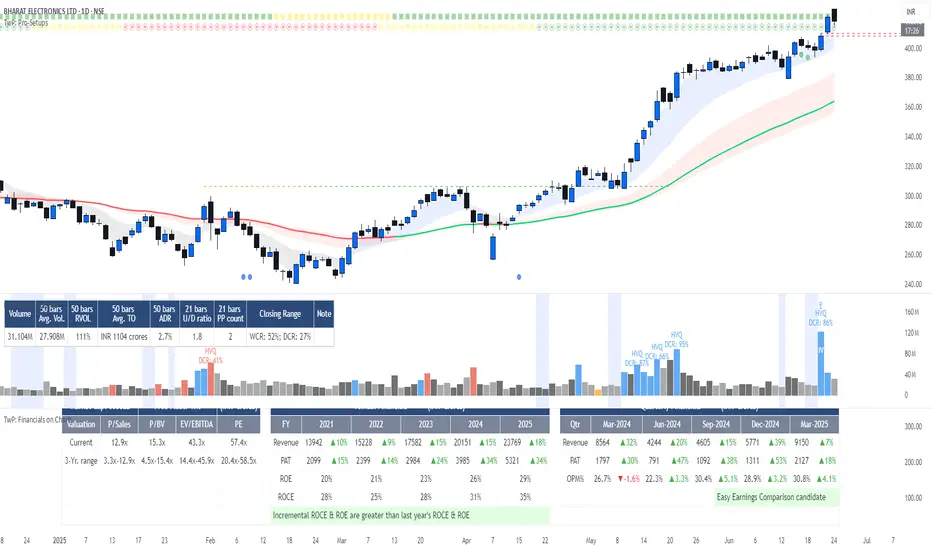
TwP: Financials on ChartsWith this indicator, you can see the following on a chart:
> An Info Panel , with the financial snapshot of the company, such as its market capitalization, annual & quarterly financials, Y/Y growth numbers, profitability margins, RoE & RoCE, and valuation ratios.
> EBITDA and PAT margins over a period of time.
> RoE and RoCE ratios over a period of time.
> Valuation multiples over a period of time.
> A comparison of margins, return ratios, and valuation multiples with any peer-group company .
Info Panel
This gives a quick snapshot of the financials of the company, which includes annual & quarterly Revenue, EBITDA, PAT, margins with Y/Y changes, Debt-Equity ratio, ROE, ROCE, and valuation multiples.
Profitability & Return Ratios
You can view quarterly as well as annual EBITDA & PAT margins and annual RoE, RoCE. You can choose to see these ratios either only for the company or can also add a peer company to compare.
Valuation Ratios
You can view TTM valuation ratios such as EV/Sales, EV/EBITDA, P/BV & P/E multiples. You can choose to see these valuation multiples either only for the company or can also add a peer company to compare.
LotSizeCalc_v1 (EUR)Hey there,
here I like to publish my first TradingView Script for the Indicator "LotSizeCalc" which calculates the LotSize for the currency '€' for e.g. the MT4-App depending on the following parameters:
- Stop Loss in pips (example: 30 pips)
- Account Balance in EUR (example: 500€)
- Risk in % (example: 1%)
It is very similar to the MyFxBook Calculator on their website, where you can compare the results for the lotsize.
You receive the calculated value next to the indicator, and - for mobile device - it also shows a label with the calculated lotsize (which you can deacivate via settings if you like).
The indicator works for the included common foreign Forex pairs (AUD, CAD, CHF, JPY, JPY, GBP, NZD, USD) in order to calculate the risk to a EUR-Trading Account.
Actually, the Script allows in general some adaptations due to your trading system. This one is the most basic version.
Happy pips and I wish you safe and risk-calculated trading!
Marcel :)
