5min Williams Fractals scalping (3commas)Another strategy I'm learning Pine Script on. It is inspired by a MoneyZG youtube strategy called "Easy 5 Minute Scalping Strategy (Simple to Follow Scalping Trading Strategy)".
Again this is a one order per trade strategy compatible with the 3commas bot (works also with the free 3commas subscription). This strategy is based on the signals from Williams Fractals, taking the signals in reverse - red triangle indicates a bottom and hence we go long. The green triangle indicates a top so we go short. By default these signals are only accepted if they occur between the two Emas. However, you can also turn this off and when a WF signal comes in, only the current price has to be between the Emas. Stop loss is set to the current Ema slow and the take profit is a multiple of the distance to the slow ema.
Like previously I have added different filters as well as the ability to view essential things like the WF signal and Emas. I hope the script will help you to be more successful and if so it would be great if you could share here your setups, or tips on what would be good to refine to make it an even a more profitable strategy. Kind of a community approach so that we help each other out :).
Instructions for the 3commas connector:
1. First, you need to prepare 3commas Long/Short bots that will only listen to custom TV signals.
2. Inputs for the 3commas bot can be found at the end of the user inputs.
3. Once you have entered the required details into the inputs, turn on 3commas comments. They should appear on the chart (looks messy).
4. Now you can add the alert where you should paste the 3commas Webhook URL: 3commas.io
5. For the alert message text insert the placeholder {{strategy.order.comment}} and delete the rest.
6. Once the alert is saved, you can turn off those 3commas comments to have a clearer chart.
7. With a new alert, the bot and trade should launch.
In the near future I would like to publish more scripts that will carry similar elements as the first two, incl. compatibility with 3commas (I don't have access to another bot system). I will choose some strategies myself, but I will also be glad for some tips on what strategy would be good to do and is still missing here on Tradingview (short youtube videos or brief strategy manuals would be great).
Thanks and keep it up
PS: My screen values starting at Long Target Profit and ending at Pullback NOT greater than: 1.5; 1.5; 0; ON; 1; 2; OFF; 17; 36; ON; 0.05; ON; Chart; 14; 46; 50; 48.5; 51; OFF; 1; ON; 4; 2.
Индекс относительной силы (RSI)

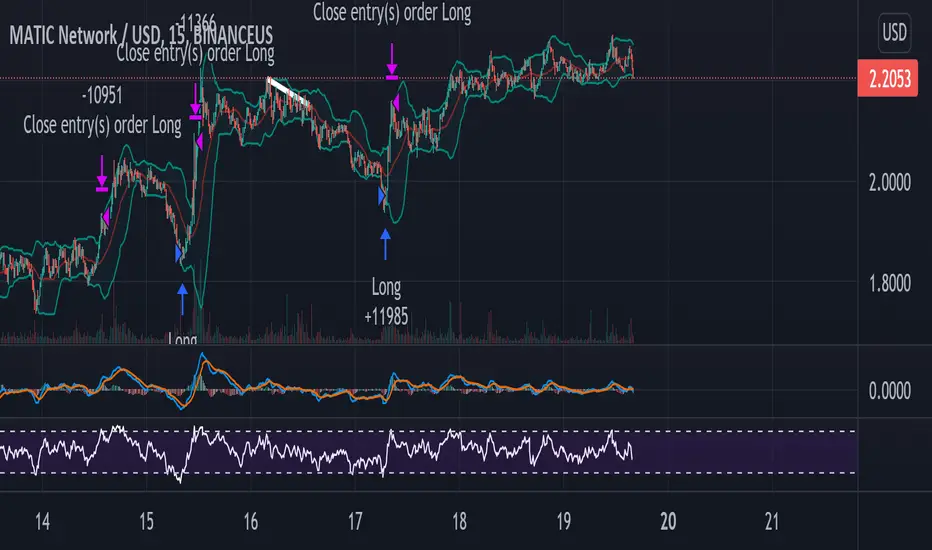
MATIC/USD 1H Bot for 3commas (works w/o 3commas too)This is a MATIC/USD or USDT specific implementation of my BNB/USD 1 hour bot. It should work out of the gate correctly for MATIC, at least based on what has been happening with it for the past seven weeks. You can fiddle with the following settings using the gear icon:
Fast and slow MACD length
The decision to use RSI thresholds as requirements for buys and/or sells, as well as the chart timeframe to use for that (make sure you use the same timeframe as your chart or a higher timeframe. You don't want to use a 1m RSI on a one hour chart but you can use a 4 hour RSI on a 1 hour chart with no issues.)
Buy and/or sell RSI threshold limits
Trailing stop loss %
Start date (for backtesting, I usually leave mine with 1-2 months trailing as those are usually better indicators than how they would have performed over the past few years)
Stress levels
Moving Average length and type
Linear regression amount
The gist of this bot is that it will use a smoothed EMA to make informed buys and sells. The smoothing prevents most noise from affecting your orders. It also allows you to set a trailing stop loss. If you don't want to use this feature set the value to 100 and it will effectively disable it.
Finally, you can disable RSI threshold point visibility. This won't affect bot operation, it just makes it cleaner to look at on your chart. Disabling RSI buys or sells will also disable visibility.
This bot takes a shotgun strategy to buys and sells. It makes a lot of buys and the majority of them are closed with little to no movement up or down. However, the ones that are profitable make a LOT as you will see once you start testing.
I make the full version of these bots available (though the script is protected) so users can test them, however if you want to use it with 3commas you will need access to the full script. Message me if you want the code and we can figure something out.

Multiple Timeframe RSI Bot for 3commas (works w/o 3commas too)Overview
A few days ago I wrote a new RSI-based strategy. The idea was that you could set up buy and sell RSI thresholds and when RSI crossed that threshold it would make a buy or a sell depending on which one it hit. It worked very well on multiple coins that I tested. I then started to think that maybe there was a better way to execute this concept using multiple timeframe RSIs and this bot represents that idea. It is better and more versatile than the previous bot in every single way. In fact at this point I think this is my most elegant bot to date. It's not as flashy as my other scipts but it is an extremely reliable performer and comes with lower risk than some of my other more outlandish automated trading ideas.
Concept
This script monitors the RSI of all timeframes you have picked in settings and displays chosen values on your chart. It defaults to 5m, 15m and 30m enabled with the rest of the timeframe options disabled and it will only show the RSI chart of timeframes you are currently using. You can specify one or more (in any combination) from the following list:
1m
5m
15m
30m
1h
4h
1d
1w
On each bar it checks each timeframe's RSI value to see if it is is lower (for a buy) or higher (for a sell) than the respective threshold you have picked in settings for that timeframe. On any given bar if enough of your used RSI values are above or below their respective thresholds to be equal to or greater than your set Number of Thresholds for Buy value a buy or sell is executed. In other words, when the number of total (different timeframed) RSI buy thresholds currently met is equal to or greater than the Number of Thresholds for a Buy value you set in settings, a buy is placed. Similarly, when the total number of differently timeframed RSI sell thresholds currently hit is equal to or greater than the total sell threshold you have in settings, a sell is placed.
I have had the best results using 5m, 15 and 30m together with the total threshold value for both buys and sells set to three which is what I left as the default. However, there are limitless ways to use this and I'm sure that over the coming months I will come up with some more creative ways to use it. Please experiment a bit and if you feel like sharing you can comment on this page as to what you find works best.
Like all my scripts this includes a date backtester. I have the start date set to Nov 1, 2021 because I feel you should never backtest a new strategy on older data if you don't specifically have a reason to do it. You likely won't get reliable results, hence the date selector.
Settings
Number of Thresholds for Buy
This is a global setting. You can use any positive whole number here that is one or greater. If it is set to one, one or more of the RSI thresholds you have selected for each chart timeframe will need to be lower than the RSI threshold value you have set for that particular timeframe's settings and once that happens the bot will buy. For example, if I have this value set to (1) and I am using a 5m, 15m and 30m chart, a buy will be placed on the first bar that any of these RSIs drop to below the respective value you have set for them in settings. If I have it set to two in the same scenario, I will need at least two RSI values to be below their respective thresholds. Since each RSI value is set separately you have a ton of creative options here. I refer to the number of currently met RSI buy thresholds per bar as 'buy count' going forward in this document. The buy count resets to zero each bar which means they will all need to be met on the same bar. You will need to make sure this setting is equal to or less than the number of differently timeframed RSIs you are using or it won't ever buy. For example, if you are using only a 5m and 15m RSI but I have the Number of Thresholds for Buy set to three it will never make a buy because you will have at max two thresholds met.
Number of Thresholds for Sell
This is the same concept above except for sells obviously. I chose to make these independent for maximum flexibility but you can obviously use the same value for both if you'd like. I refer to the number of currently met RSI sell thresholds as 'sell count' for the rest of this document. You will need to make sure this number is equal to or less than the number of differently timeframed RSIs you are using or you will potentially get a buy but never a sell. Use the backtester to figure this out or message me if you get stuck.
Display Multi RSI Table?
This will show you all of the available RSI settings that are currently in play. Note that only timeframes which are equal to or higher than your current TradingView chart timeframe will be accurate. This is due to the fact that these values are looked up once per bar, so if you are set to a 1h chart you won't get 5m values every 5m, instead getting the 5m RSI once per hour. For best results set your chart to the lowest timeframe that you have enabled from the options below this.
Use XX RSI?
This turns a particular timeframe's RSI off and on. If you turn it off it will disappear from the chart and its thresholds won't be applied to the strategy.
XX RSI Length
You can set the RSI length for each timeframe you want to use separately. The default value is 14.
XX RSI Buy / Sell Threshold
These are all also set separately for each timeframe. Any time XX timeframe's RSI is below the Buy Threshold for that timeframe it will increase the buy count by +1 for that bar. Since the count resets to zero each bar, you will need to have at least your Number of Thresholds for Buy worth of RSI values below their respective thresholds on any given bar for a buy to happen. The opposite is true for sells.
Usage
For each timeframe you pick you will also need to set a buy and a sell threshold. I have the defaults set to 30 and 70 which is pretty standard but you should experiment and see what works best for you. Each individual timeframe has its own buy and sell threshold which makes this script about as customizable as you want it to be.
Set your chart to the lowest timeframe that you are using, ie if you are using 1h, 4h and 1d use a 1h chart. If you are using 5m, 15m and 30m use a 5m chart. You need to do this because it will only refresh each RSI on the interval your chart is set to, so if you have 5m, 15m and 30m but use a 1h chart the strategy will basically lose most of its effectiveness because there should be twelve different 5m RSI values in each hour but you will only recalculate once every hour since your chart is set to one hour, and will therefore only get one 5m value, one 15m value and one 30m value per 1h bar. If you don't understand this just trust me and set it to the lowest timeframe you are currently using.
I didn't put a stop loss in this version but I will in the next update.
I think that's about it! If you have questions please ask. I give access to this script away for free for testing but in order to use it with 3commas you will need the entire script. Message me if you want it and we can figure something out.

TTMW : Trend-Following HLR V1.2Authored by Kuntanut - To The Milky Way
HLR Strategy :
HLR Strategy is developed from the HLR Indicator. HLR Strategy is the trend-following strategy, bases on the logic to follow the long position when the market is considered to entry the overbought area which means the assets is in the investor interested, and the fear-of-missing-out might be occurred, and the price will be driven to the moon.
The calculation of the HLR is modified from RSI indicator, the sources of high and low is replaced the close source in calculation. The EMA, WMA is replaced the RMA in the method of the calculation.
Entry Condition : The HLR indicator crosses the overbought area.
Close Condition : The HLR indicator crosses the oversold area.
* The Strategy is modified to use in 1D Timeframe.

RSI-based strategy for MATIC on 3commas - uses a 15m chartI looked all over TradingView and could not find a script that specifically does this so I wrote one. It's not complicated but it works pretty well. Essentially the concept is that you specify two RSI values: a buying threshold and selling threshold. The indicator will make buys based on RSI crossing your buy threshold and sells based on it crossing your sell threshold.
You can change the actual RSI parameters though I have found it works best with the default settings I have listed. It is set for a 15m MATIC chart but you can use it with anything on any time period but you will need to modify the thresholds and check the backtester if you use it on anything other than a 15m MATIC chart.
There is also a date range selector so you can test it over a specific time period. I typically use the past 1-2 months to get a good feel for if the settings I have picked work well in current market conditions.
It also functions as a regular RSI indicator so if you use this you probably don't need to apply any other RSI indicators to your chart.
I have made the indicator usable so that you can test it out manually to verify that it works as expected and if you want access to the script itself (to enable automated trading on 3commas) please message me and we can work something out.
In the future I might add some extra settings to this like a smoothed EMA so you can make more discerning buys, it depends on how many people contact me for the full script.
3RSI 3CCI BB 5orders DCA strategy+This strategy is just an attempt to find the indicator values for the trading bot service that I use (link in profile). Due to the use of the “request.security” function in the code, the indicators can be redrawn, but this is not important in history. The strategy used only 5 orders for the "DCA" - bot, located at the same distance in the price overlap range. I only use this strategy when trading in pairs against bitcoin.
Эта стратегия – просто попытка подобрать значения индикаторов для сервиса торговых ботов, который я использую (ссылка в профиле). Из-за использования в коде функции «request.security» возможна перерисовка индикаторов, но на истории это не важно. В стратегии использовано всего 5 ордеров для «DCA» - бота, находящихся на одинаковом расстоянии в диапазоне перекрытия цены. Я использую данную стратегию только при торговле в парах к биткоину.

Zendog V3 backtest DCA bot 3commasMAJOR UPDATE:
- Update to Pinescript v5
- MAJOR refactor for the logic of how orders are placed. BO order is placed when the condition is first encountered and we are not in a deal.
The extra SO orders (if based on price movement) are all placed on the next candle after BO order, instead of each being placed one after another.
Take profit (if percentage) and Stop loss are placed on the first candle after BO order because if BO and TP are on the same candle TV does not execute properly.
These changes should improve strategy accuracy when multiple prices are hit by the same candle.
- NEW FEATURE: Support to Stop deal using an external indicator (i.e. stop long deal when RSI > 80)
- NEW FEATURE: Support to trigger Safety orders using an external indicator (i.e. trigger each additional SO when RSI < 10, regardless of price movement)
The price movement logic may be implemented in the indicator that plots start / end signals. The SO size is calculated using the configuration of steps.
- NEW FEATURE: Safety order command for 3commas bot. This is implemented using Add funds in the quote currency (for pair BTCUSDT the quote currency is USDT)
The SO size is calculated using the configuration of steps, for exact order size (and price) use the built-in Steps table.
- NEW FEATURE: Addition of extra columns to the steps table: Required price for TP, Required % change for TP, Required % change for BEP (Breakeven point)
- Update to steps table to remove prices when Safety orders are not based on % price change
- The code is opensource. I will not be able to sustain merges for the script, but feel free to use and develop your own version and ping me on discord to review them
and maybe include in the original script

RSI Average Swing BotThis is a modified RSI version using as a source a big length(50 candles) and an average of all types of sources for candle calculations such as ohlc4, close, high, open, hlc3 and hl2.
In this case we are going to use a 0-1 scale for an easier calculation, where 0.5 is going to be our middle point.
Above 0.5 we consider a bullish possibility.
Below 0.5 we consider a bearish possibility.
I made a small example bot using that initial logic, together with 2 exit points for long or short positions.
If there are any questions, let me know !

Premium ScalperThe strategy works with a combination of a number of different factors, including:
- Volume
- Moving averages
- Volatility
- RSI
This strategy generates long and short signals based on volume movements, moving averages and RSI. By combining other algorithms, low volatility periods can be filtered out.
The best results can be achieved by pairing the indicator with a bot through 3Commas and using a diversification strategy. This way you spread your risk over different pairs and you therefore also have a great chance of taking big moves.
The strategy results we display are results WITHOUT leverage. It is therefore also possible to only long on spot with this strategy, but for optimal results a trading bot link is required.
The settings we have used for these results are an order size of 100% with a 0.08% commission size.
Side note: This indicator does NOT use repainting!
We offer the possibility to try the indicator for free for 7 days.

MZ SRSI Strategy V1.0Strategy Introduction
This strategy starts from selection of 1st Moving Average from one of following:
SMA
EMA
DEMA
TEMA
LRC
WMA
MF
VAMA
TMA
HMA
JMA
Kijun v2
EDSMA
McGinley
Then it calculates the RSI of selected 1st Moving Average
In the end it calculates Moving Average of previously calculated RSI and for this purpose 2nd Moving Average is also selected from above list.
Cross of RSI and its Moving Average generates Strategy Alerts
Only long trades are enabled currently
Default Settings
I've set the default selection to the perfect options for 1D and 4h timeframes. You can modify both MAs selection and their length according to your selected timeframe.
Following default settings are used:
Heiken Ashi Candles are selected by default as source
1st Moving Average selection is set to LRC (Linear Regression Curve)
Length of 1st Moving Average is set to 50
RSI length is set to 2 because it is supposed to be fast
2nd Moving Average of RSI is set to TMA (Triangular Moving Average)
Length of 1st Moving Average is set to 5
Start date is set to 2011
Backtesting can also be done selecting %age of equity
Suggestions for Usage
Mostly winning trades have no prominent drawdown so losing trades can be abolished with Stoploss. Would soon add Stoploss, MTF and Takeprofit options in next version. Also if you want an alerts version of it then just comment below and would publish it later. I’ve found this strategy useful on 1D and 4h timeframes with described default settings.

Bollinger Band Breakout Positional Strategy- BN -15M This strategy consists of following criteria:
Buy:
1. Candle should have RSI is above 60 and Close above Bollinger band upper limit
2. Exit When candle is closed below 20MA
Sell:
1. Candle should have RSI is above 40 and Close below Bollinger band lower limit
2. Exit When candle is closed above 20MA
Checkout results.

RSI + MA StrategyHello, everyone!
We have just released an innovative strategy for TradingView. It allows you to facilitate the trading process when you have to use both indicators.
This strategy is:
User-friendly
Configurable
Equipped with the combination of Relative Strength Index (RSI) and Moving Average (MA) indicators
Designed with all required functions to manage positions
Features
The RSI+MA strategy can:
Identify entry points for Long and Short positions.
Depict RSI and MA values concerning each other.
Reduce visual congestion and import usability thanks to using a combo of 2 indicators.
Allow using pivot trading. The RSI+MA strategy will enter a Long position according to the Short position conditions. And vice versa.
Note! If you want to open a Long position, the RSI line should cross MA from top to bottom. If you want to open a Short position, RSI has to cross MA from bottom to top.
Parameters
We have equipped our strategy with more than 14 additional parameters. So, you can configure the EA according to your needs!
Inputs :
Use Reverse Trade — allows swapping Long and Short positions opening conditions.
Resolution — allows you to view an indicator with data on a higher or lower timeframe on the current chart.
RSI Length
RSI Source: Open, High, Low, Close, HL2, HLC3, OHLC4
Show MA — allows you to enable or disable MA displaying.
MA Length
MA Offset
Style:
RSI — RSI indicator line color and style settings.
MA — MA indicator line color and style configuration.
Upper Band — allows customizing line style, color, and RSI upper bound value.
Lower Band — allows you to customize line style, color, and RSI lower bound value.
Background — background color setting within the RSI upper and lower borders.
Precision — number of decimals for RSI values.
Note! Try RSI+MA on your demo account first before going live.

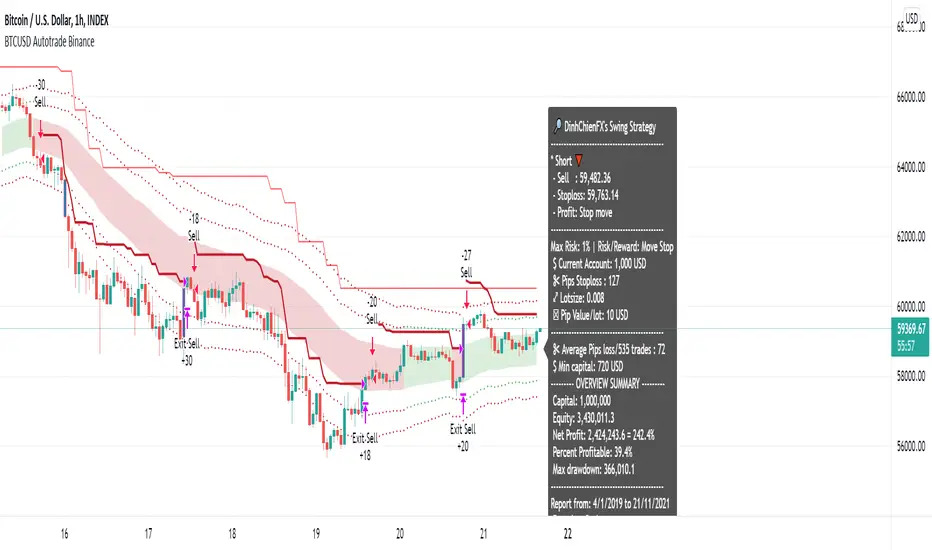
[BTCUSD] Multi Entries Autotrade BinanceCommission = 4 USD per order >>> check in the Performance Summary
Slippage = 2 ticks
- I see from Kodify (tradingview.com/pine-wizards)
Risk: 1% per trade >>> check at the "List of trades"
* Auto trade BINANCE FUTURE by Webhook + Pro, Pro+, Premium Tradingview user.
Binance future quantity setting:
- Fixed Quantity = 0 => Auto quantity (Balance, risk, pips loss)
- Fixed Quantity > 0 (0.001, 0.002, 0.01,...) => send signal with Fixed Quantity
H4 timeframe is main trend: Supertrend indicator.
- Uptrend when closes candle is below the red line
- Downtrend when closes candle is above the green line
H1 timeframe: Keltner Color count & RSI indicator:
- Keltner Color Count input:
- Length = 50
- Multi1 = 1
- Multi2 = 2
- Multi3 = 3
- Source = Close
- Lookback = 25
- RSI input: Length: 14, Source: Close
I. Entry 1: BASIS KELTNER CHANNEL
- BUY when previous OHLC4 candle crossover Basis line AND Supertrend H4 uptrend AND Keltner channels uptrend. Not repaint.
- SELL when previous OHLC4 candle crossunder Basis line AND Supertrend H4 downtrend AND Keltner channels downtrend. Not repaint.
II. Entry 2: UPPER 2/LOWER 1 KELTNER CHANNEL
- BUY when previous OHLC4 candle crossunder Upper 1 AND Supertrend H4 uptrend AND Keltner channels uptrend AND rsi uptrend. Not repaint.
- SELL when previous OHLC4 candle crossover Lower 1 AND Supertrend H4 downtrend AND Keltner channels downtrend AND rsi downtrend. Not repaint.
III. Entry 3: SELL UPPER 2/ BUY LOWER 1 KELTNER CHANNEL
- BUY when previous OHLC4 candle crossover Lower 1 AND Supertrend H4 uptrend AND Keltner channels uptrend AND rsi uptrend. Not repaint.
- SELL when previous OHLC4 candle crossunder Upper 1 AND Supertrend H4 downtrend AND Keltner channels downtrend AND rsi downtrend. Not repaint.
IV. Report all history BTCUSD (H1 timeframe)
- 01/01/2019 - 20/11/2021
- 01/01/2018 - 01/01/2021
- 01/01/2017 - 01/01/2020
- 01/01/2016 - 01/01/2019
- 01/01/2015 - 01/01/2018
- 01/01/2014 - 01/01/2017
- 01/01/2013 - 01/01/2016
- 01/01/2012 - 01/01/2015
ETHUSD Multi Entries Autotrade BinanceCommission = 4 USD per order >>> check in the Performance Summary
Slippage = 2 ticks
- I see from Kodify (tradingview.com/pine-wizards)
Risk: 1% per trade >>> check at the "List of trades"
* Auto trade BINANCE FUTURE by Webhook + Pro, Pro+, Premium Tradingview user.
Binance future quantity setting:
- Fixed Quantity = 0 => Auto quantity (Balance, risk, pips loss)
- Fixed Quantity > 0 (0.001, 0.002, 0.01,...) => send signal with Fixed Quantity
H4 timeframe is main trend: Supertrend indicator.
- Uptrend when closes candle is below the red line
- Downtrend when closes candle is above the green line
H1 timeframe: Keltner Color count (Free): 2 Entries (I. Basis line, II. Upper 1/Lower 1 line)
Keltner Color Count input
- Length = 50
- Multi1 = 1
- Multi2 = 2
- Multi3 = 3
- Source = Close
- Lookback = 25
I. Basis entry rule:
1. Keltner channels:
Long when closes candle crossover the Upper 3 Keltner.
Short when closes candle crossunder the Upper 3 Keltner.
2. Rule of Basis's correction zone before open trades.
- Buy when previous OHLC4 candle crossover the Keltner Basis (Supertrend uptrend & Keltner long). Not repaint.
- Short when previous OHLC4 candle crossunder the Keltner Basis (Supertrend downtrend & Keltner short). Not repaint.
II. 'Upper 1/Lower 1' entry rule:
1. Keltner color count: lookback = 25
2. Keltner channels:
- Long when closes candle crossover the Upper 2 Keltner and Keltner Color count Uptrend.
- Short when closes candle crossunder the Upper 2 Keltner and Keltner Color count Downtrend.
3. RSI down when crossover 70, RSI down when crossunder 30
4. Rule of 'Upper 1/Lower 1' correction zone before open trades.
- Buy when previous OHLC4 candle crossunder the Keltner Upper 1 (Supertrend uptrend & Keltner long & RSI up). Not repaint.
- Short when previous OHLC4 candle crossover the Keltner Lower 1 (Supertrend downtrend & Keltner short & RSI down). Not repaint.
III. Stoploss move: Height of Keltner * 1.3
IV. Report all history ETHUSD (h1 timeframe):
1. Keltner Basis line entries:
- 14/01/2019 - 20/11/2021
- 18/01/2021 - 01/01/2021
- 02/01/2020 - 01/01/2020
- 05/02/2016 - 01/01/2019
- 23/10/2015 - 01/01/2018
- 23/10/2015 - 01/01/2017
2. Keltner 'Upper 2/Lower 1' entries:
- 20/01/2019 - 20/11/2021
- 10/01/2018 - 01/01/2021
- 12/01/2017 - 01/01/2020
- 04/02/2016 - 01/01/2019
- 19/08/2015 - 01/01/2018
- 19/08/2015 - 01/01/2017
3. Combine 2 entries (Basis & 'Upper 1/Lower 1':
01/01/2019 - 20/11/2021
01/01/2018 - 01/01/2021
01/01/2017 - 01/01/2020
01/01/2016 - 01/01/2019
01/01/2015 - 01/01/2018
01/01/2015 - 01/01/2017

RSI StrategySimple way how to use RSI and MA indicators for trading.
What we use:
• RSI
• SMA calculated by RSI (title: SMA_RSI)
• Delta of RSI and SMA_RSI (title: delta)
• SMA calculated by delta of RSI and SMA & RSI (title: SMA_RSI2)
Logic:
Upon the fact that we use the difference between two indicators that have similar values ( RSI and SMA_RSI), we get number around zero. Next, result is smoothed by calculated the SMA . This is the blue/purple line that appears on the chart - SMA_RSI2.
The trade open when SMA_RSI2 cross over the threshold. The trade close when SMA_RSI2 cross under the threshold below.
Also, the usual EMA 200 is used as a filter, which you can switch on or switch off.

Supertrend + RSI Strategy [Alose]This strategy combines the best of both indicators (Supertrend & RSI).
As we know, Supertrend is excellent at finding changes in the market trend and thus finding the best entries, however in my opinion it has a great weakness and it is that it does not know how to find the best exit point.
For this reason I decided to combine it with the RSI that we know usually knows the highest and lowest rebound points of the price, thus managing to find the best exit point for the strategy.
The best thing about combining these 2 indicators is that our trades will obtain better profits in less time.
LONG ENTRY
When SuperTrend changes its direction and it is less than 0.
LONG EXIT
There are two ways to close the trade:
When RSI is overbought, you can choose the "Overbought Level " inside the strategy settings (Default: 72).
When SuperTrend changes its direction and it is grater than 0.
SHORT ENTRY (You can enable short entries in strategy settings)
When SuperTrend changes its direction and it is grater than 0.
LONG EXIT
There are two ways to close the trade:
When RSI is oversold, you can choose the "Oversold Level " inside the strategy settings (Default: 28).
When SuperTrend changes its direction and it is less than 0.

RSI & SMA Strategy By DenizIntroduction
It has always been a major challenge to detect the current market price in technical analysis . There are some basic but strong indicators that help us to estimate the next market action. Relative Strength Index and Simple Moving Average indicators were used in this strategy.
This strategy aims to detect the next market action with different calculations & usages of RSI and SMA indicators.
Strategy Features
As per the result of the calculation from RSI and SMA outputs the strategy will decide to go "Long" or "Short" if the directions are changed from long to short the trade will be closed and it's opening new trade as per to the new direction.
Apart from basic "take profit" and "stop" options there is an additional closing trade option named "Long/Short Bar Count". If the trade could not reach the target in a certain period, it will look for a quit with a 0 loss.
Advantages
Informative alarm messages.
High ratio of Profitable trade numbers.
Disadvantages
Less trade count.

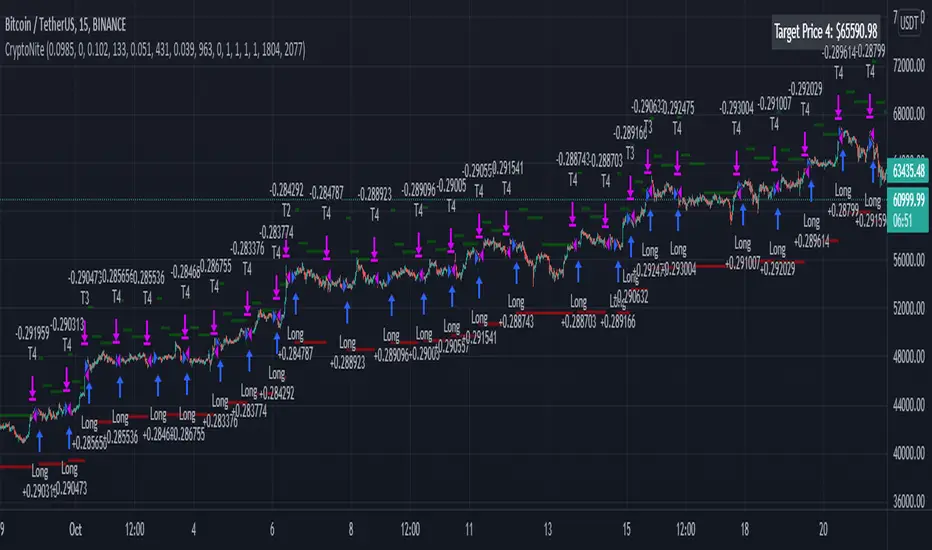
CryptoNite - Machine Learning Strategy (15Min Timeframe)Greeting Traders! I am back with another ML strategy. :D I kept my word with combining my machine learning algorithms from Python and integrating them into Tradingview. Thanks to Tradingview's new release of Pinescript v5 it is now possible. This strategy respects the Sortino Ratio and was created using 2 years of data for 50 different cryptocurrencies. That is a total of 100 years of data and 44,849 trades to create this strategy. Now let me tell you, my computer and I are exhausted. We both been at it non-stop for about two months everyday. I refine the strategy, and the computer runs 24/7 for a few days to spit out the best results into the terminal. It's been a good run so my computer will finally get some sleep tonight.
So let's talk a little about the features of the strategy. In the settings window, you'll see the Stoploss, Take Profit Parameters, and Date Range. You can change the Date Range, but I recommend to leave the SL/TP parameters how they are because the machine learning algo chose those input. If you wish to change them you are always welcome to do so but backtest results will change. For the Take Profit parameters you'll see on the left side you something labeled time duration(displayed in minutes) and on the right side you'll see take profit values. Let's talk a little bit how they work.
TP_values = {
"0": 0.102,
"133": 0.051,
"431": 0.039,
"963": 0
}
In python, the table looks like this but it is quite easy to understand in Tradingview.
From 0-133 minutes, the strategy is looking to the reach target point 1 at 10.2% profit.
From 133-431 minutes, the strategy is looking to the reach target point 2 at 5.1% profit.
From 431-963 minutes, the strategy is looking to the reach target point 3 at 3.9% profit.
From 963+ minutes, the strategy is looking to break even at 0% profit on target point 4.
Through each target point a sell trigger is active. It will look for the best time to sell even if TP has not been reached.
This helps the trade not stay open too long.
The last thing I need to mention is the textbox displayed on the right side of your chart. This textbox displays the current Take Profit value in dollar amount. So when you're in a trade you'll know what TP target has to be reached when the open trade is active. Throughout time, the target price changes depending how long the trade has been open. If you have any questions feel free to comment down below, and enjoy this strategy!
RSI StrategyThis RSI strategy is different than most in that it doesn't pick a buy signal based on the RSI rising above a specific number (usually 30). Instead, it creates a 14 day exponential moving average of the Relative Strength Index and uses the following two conditions together to trigger a buy:
Entry conditions:
Condition1: Rising of the RSI's moving average for (user defined) candles in a row
Condition 2: The RSI is < 70
The reasoning behind condition 1 is that we are trying to buy into a rising trend, the moving average helps to confirm the trend, whereas the RSI rising above a specific number (usually 30) gives us no real indication that the asset will increase and produces less wins overall. The reasoning behind condition 2 is to avoid buying at the top of a climb.
Exit conditions:
Condition 1: The RSI moving average is falling
Condition 2: Close < Trailing stop activation Level
Condition 3: We have at least (user defined) % profit
The reasoning behind sell condition 1 is a falling RSI moving average (down trend starting). The close has to be under the trailing stop activation level, if we've triggered the trailing stop, we want the trailing stop to do it's job and not exit the trade until the trailing stop takes us out. The reasoning behind condition 3 is to not exit without at least some profit (user defined).

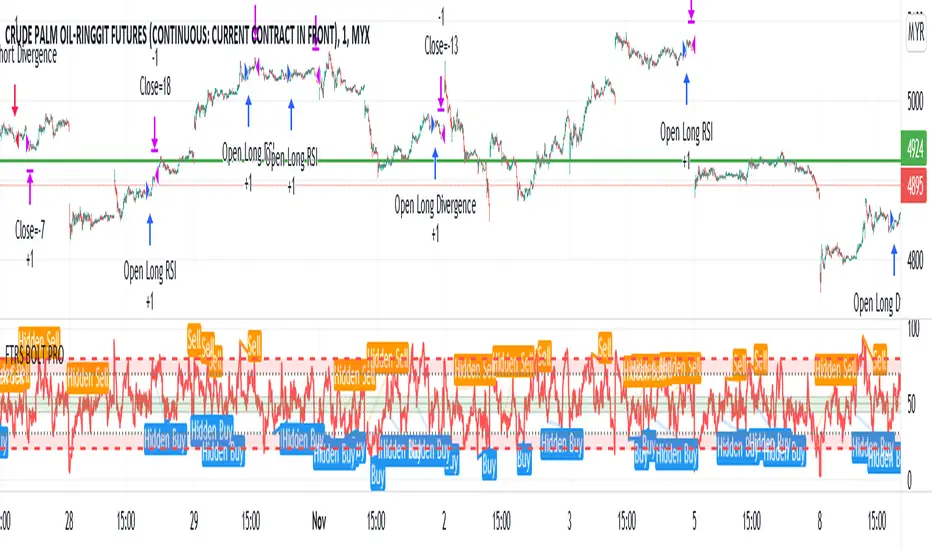
FTRS BOLT PRO
The script uses RSI as major trend identification and supported by RSI divergence for take profit, and also counter trend in certain cases.
Uses EMA 200 for major trend identification to filter false signals, Average Volume as confirmation and faster signal detection to the change of trend.
The indicator detects immediate change of trend and immediately opens position for the major trend.
User can enjoy the RSI with labels of divergence to do manual judgement.
Existing risk to reward ratio based on amount of money instead of ticks count. The currency is depending on the chart's trading currency.
This strategy mainly built for FCPO and its for 1 min settings only. User can toggle the sessions as per users preferences
The default risk to reward ratio is 1:1.5. However, there is a risk management using RSI levels to
Cumulative RSI StrategyI suppose nothing drives a point home like a 10+ year backtest! A couple of weeks ago I published a custom indicator called the Cumulative RSI. This indicator was straight out of chapter 9 of "Short Term Trading Strategies That Work." Today I am publishing a basic sample strategy in that uses the Cumulative RSI as its only entry and exit signals on a Nasdaq 100 leveraged index ETF (TQQQ). In this example, the indicator is being used as a longer term strategy with just 10% leverage over the account equity and a $25k start balance.
If I had it 10 years ago I would probably be retired! I'm sharing because I've found that it can provide an edge when determining exit/take profit points for trades. Many traders wait for a price reversal / trailing-stop to exit a trade when it starts losing. I've found that, using tools like the Cumulative RSI, you can achieve better exit points over the long term. Disclaimer: Even though this example significantly beats buy and hold, I wouldn't advise using it as a stand-alone strategy without significant additions/modifications to strategy and risk management functions.

RSI Overbought Oversold Divergence Strategy w/ Buy/Sell SignalsThis indicator is a copy of my RSI Overbought/Oversold Divergence Indicator with-Alerts
Only difference is that the alerts are disabled, instead it uses tradingviews strategy tester signals
If you want alerts just use the other indicator

Williams Fractals StrategyThis indicator made with using Williams Fractals, 20 50 100 Moving Averages and Relative Strength Index. You can easily find entry points by using Long (L), Short (S) signals.
Note : Settings are optimized for BTC:USDT Perpetual 15min TF. For use different pairs or TFs you may need to change settings.
