Combo Backtest 123 Reversal & RSIThis is combo strategies for get a cumulative signal.
First strategy
This System was created from the Book "How I Tripled My Money In The
Futures Market" by Ulf Jensen, Page 183. This is reverse type of strategies.
The strategy buys at market, if close price is higher than the previous close
during 2 days and the meaning of 9-days Stochastic Slow Oscillator is lower than 50.
The strategy sells at market, if close price is lower than the previous close price
during 2 days and the meaning of 9-days Stochastic Fast Oscillator is higher than 50.
Second strategy
The RSI is a very popular indicator that follows price activity.
It calculates an average of the positive net changes, and an average
of the negative net changes in the most recent bars, and it determines
the ratio between these averages. The result is expressed as a number
between 0 and 100. Commonly it is said that if the RSI has a low value,
for example 30 or under, the symbol is oversold. And if the RSI has a
high value, 70 for example, the symbol is overbought.
WARNING:
- For purpose educate only
- This script to change bars colors.
Индекс относительной силы (RSI)

RSI Divergence + EMA @DaviddTechVery simple strategy that will look for Divergence on the RSI.
My Strategy for this was mixed with the 55 EMA which you can activate in the settings.
WARNING:
- For purpose educate only - My mission is to debunk fake strategies with code to find THE ONE.
- Plots EMAs and other values on chart.
- This script to change bars colors.

FTRS PROThe script works differently on different time frame. Works best in 1 min time frame. The script take advantage on ichimoku cloud for trend analysis, RSI for 2nd trend identification and a custom command to identify point of entry for the market bias. This is NOT a counter trend strategy, it is purely to capture the market bias on the chart. User able to customize based on their preferences risk to reward ratio and play along with user's own risk appetite.

Crypto RSI with RVI StrategyThis is a long only strategy adapted for crypto market.
Its idea is to take the most juice out of a long trend and cut the losses as soon as possible.
For this , its components are RSI with a very big length - 100 or 200 preferably and RVI.
Rules for entry
If RVI is in the buy zone and we have a crossover from RSI with the overbought level.
Rules for exit
With change condition : If RVI is in the sell zone and we have a cross under from RSI with the oversold level.
With stop loss : we have a SL based on movement in % of the price, recommendable between 5-10%.
If you have any questions let me know !

Ichimoku + RSI Crypto trending strategyThis is a crypto trending strategy designed for big timeframes such as 3-4h+.
Its components are:
RSI
ICHIMOKU full pack
Heikin Ashi candles for logic calculation inside
Rules for entry.
For long : we have a long cross condition on ichimoku and price is above the ichimoku lines, and at the same time RSI value is > 50.
For long : we have a short cross condition on ichimoku and price is below the ichimoku lines, and at the same time RSI value is < 50.
Rules for exit
We exit whenever we receive an opposite signal of the initial entry.
SInce this strategy is using no risk management inside, I recommend to be careful with it .
If you have any questions, let me know !

BTC Sentiment analysis RSI 2xEMAThis is a CRYPTO correlation strategy, which is using BTC sentiment with BITFINEX long and short ratios.
WIth them we are making from one side 2 RSI, one for long and another for short. And from another side, we are going to make multiple EMA's, using the ratios for long and short.
Rules for entry
For this scenario I created a long only strategy.
The long entry condition is : we have a crossover of the rsi long ratio with rsi short ratio and long ratio from BITFINEX is above the long EMA and short ratio from BITFINEX is below short EMA.
We exit when we get the opposite condition, in this case we have a crossunder of the rsi long ratio with rsi short ratio and long ratio from BITFINEX is below the long EMA and short ratio from BITFINEX is above short EMA.
If you have any questions, let me know !

3 RSI 6sma/ema ribbon crypto strategyThis is a very efficient swing trading strategy designed for crypto long timeframes like 2h+.
Initially we have 3 RSI .
AFter that we use them as source for 6 SMA/EMA for each RSI, 5, 30, 50, 70, 90, 100. With those we create a ribbon that we are going to use in order to check the direction of the trend.
Rules for entry:
For long : if either all the SMA/EMA's from the 2nd RSI are telling us to go long, or all the all SMA/EMA's from the 3rd rsi are telling us to go long F
For short : if either all the SMA/EMA's from the 2nd RSI are telling us to go short, or all the all SMA/EMA's from the 3rd rsi are telling us to go short
We exit when we get an opposite condition than the entry one.
Caution: this strategy has no risk management inside, so use it with caution. If you have any questions , let me know !

Zendog Backtest-DCA-Bot-3commasHi everyone,
This is a strategy that serves as a basic Backtester for 3commas DCA bots.
You can plugin your own studies into the Backtester, play around with their parameters as well with the DCA parameters and see how they can provide best result on historical data.
Features:
- Meaningful statistics that actually group orders under the same deal.
(base order + safety orders are the same deal, but Tradingview Strategy Tester shows them as separate trades)
See how many safety orders were used for each deal.
- Deal start condition: built in RSI-7 or external indicator
(main purpose of this strategy is to connect your own studies, so using external indicator is recommended)
- Base order and safety orders configs similar to 3commas
(order size, percent deviation, safety orders, percent scale and volume scale)
- Support for Long strategy for now (plan to add Short)

Combo Backtest 123 Reversal & Stochastic RSIThis is combo strategies for get a cumulative signal.
First strategy
This System was created from the Book "How I Tripled My Money In The
Futures Market" by Ulf Jensen, Page 183. This is reverse type of strategies.
The strategy buys at market, if close price is higher than the previous close
during 2 days and the meaning of 9-days Stochastic Slow Oscillator is lower than 50.
The strategy sells at market, if close price is lower than the previous close price
during 2 days and the meaning of 9-days Stochastic Fast Oscillator is higher than 50.
Second strategy
This strategy used to calculate the Stochastic RSI
WARNING:
- For purpose educate only
- This script to change bars colors.
Delayed RSI StrategyThis strategy uses a 21 period RSI with an overbought (RSI indicator
is greater than) level of 60 (user defined) to determines long entries and an oversold
(RSI indicator is less than) level of 40 (user defined) for shorts. It introduces a bar delay that starts
counting when the RSI < Oversold or RSI > Overbought conditions are true, delaying the entry with
the amount of bars determined by the user. The trading logic can be reversed, which seems to work better.

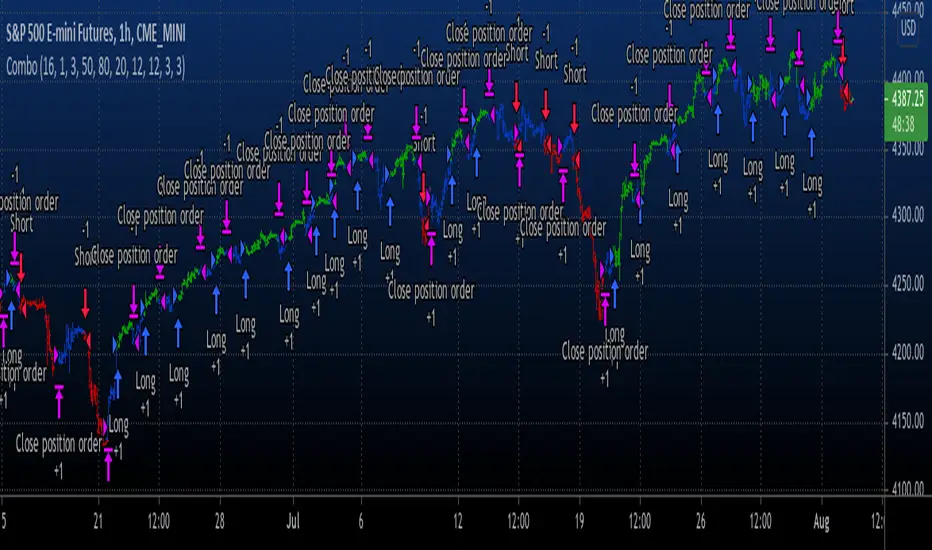
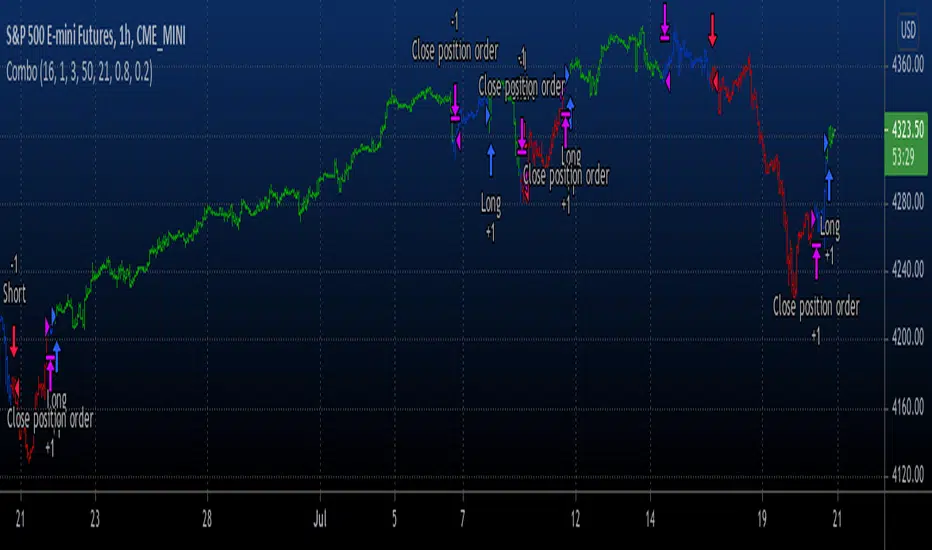
HYE Combo Market [Strategy] (Vwap Mean Reversion + Trend Hunter)In this strategy, I used a combination of trend hunter and vwap mean reversion strategies that I published before.
Trend Hunter Strategy:
Mean Reversion Vwap Strategy:
The results are quite impressive, especially for bitcoin.
While the hodl return for bitcoin was 13419%, the strategy's return in the same period was about 5 times (65000%) of this.
s3.tradingview.com
In this combo strategy, I made some changes to the original settings of the strategies used together and added some more new features.
Trend Hunter Strategy Settings: (Original / Combo)
- Slow Tenkansen Period : 9 / 9
- Slow Kijunsen Period : 26 / 13
- Fast Tenkansen Period : 5 / 3
- Fast Kijunsen Period : 13 / 7
- BB Length : 20 / 20
- BB Stdev : 2 / 2
- TSV Length : 13 / 20
- TSV Ema Length : 7 / 7
* I also added a "vidya moving average" to be used as a confirmation tool to open a long position. (Candle close must be above the vidya line.)
Vwap Mean Reversion Strategy Settings: (Original / Combo)
- Small Vwap : 2 / 8
- Big Vwap : 5 / 10
- Percent Below to Buy : 3 / 2
- RSI Period : 2 / 2
- RSI Ema Period : 5 / 5
- Maximum RSI Level for Buy : 30
* I also added a "mean vwap line" to be used for exits in this part of the strategy. In the original version, when small vwap crossovers big vwap, we close the position, but in this strategy we will wait for the close above the mean vwap.
TIPS AND WARNINGS
1-) The standard settings of this combo strategy is designed and tested with daily timeframe. For lower timeframes, you should change the strategy settings and find the best value for yourself.
2-) Only the mean vwap line is displayed on the graph. For a detailed view, you can delete the "//" marks from the plot codes in the strategy code.
3-) This is a strategy for educational and experimental purposes. It cannot be considered as investment advice. You should be careful and make your own risk assessment when opening real market trades using this strategy.
________________________________________________________
Bu stratejide, daha önce yayınladığım trend avcısı ve vwap ortalamaya geri dönüş stratejilerinin bir kombinasyonunu kullandım.
Sonuçlar özellikle bitcoin için oldukça etkileyici.
Bitcoin için hodl getirisi %13419 iken, stratejinin aynı dönemdeki getirisi bunun yaklaşık 5 katı (%65000) idi.
Bu kombo stratejide, birlikte kullanılan stratejilerin orijinal ayarlarında bazı değişiklikler yaptım ve bazı yeni özellikler ekledim.
Trend Avcısı Strateji Ayarları: (Orijinal / Combo)
- Yavaş Tenkansen Periyodu : 9 / 9
- Yavaş Kijunsen Periyodu : 26 / 13
- Hızlı Tenkansen Periyodu : 5 / 3
- Hızlı Kijunsen Periyodu : 13 / 7
- BB Uzunluğu : 20 / 20
- BB Standart Sapması : 2 / 2
- TSV Uzunluğu : 13 / 20
- TSV Ema Uzunluğu : 7 / 7
* Ayrıca long pozisyon açmak için onay aracı olarak kullanılmak üzere "vidya hareketli ortalama" ekledim. (Mum kapanışı vidya çizgisinin üzerinde olmalıdır.)
Vwap Ortalamaya Dönüş Stratejisi Ayarları: (Orijinal / Combo)
- Küçük Vwap : 2 / 8
- Büyük Vwap : 5 / 10
- Alış İçin Gerekli Fark Oranı : 3 / 2
- RSI Periyodu : 2 / 2
- RSI Ema Periyodu: 5 / 5
- Alış için gerekli maksimum RSI seviyesi : 30
* Stratejinin bu bölümünde pozisyondan çıkışlar için kullanılacak bir "ortalama vwap çizgisi" de ekledim. Orijinal versiyonda, küçük vwap, büyük vwap'ı yukarı kestiğinde pozisyonu kapatıyoruz, ancak bu stratejide, ortalama vwap'ın üzerindeki kapanışı bekleyeceğiz.
İPUÇLARI VE UYARILAR
1-) Bu birleşik stratejinin standart ayarları, günlük zaman dilimi ile tasarlanmış ve test edilmiştir. Daha düşük zaman dilimleri için strateji ayarlarını değiştirmeli ve kendiniz için en iyi değeri bulmalısınız.
2-) Grafikte sadece ortalama vwap çizgisi görüntülenir. Ayrıntılı bir görünüm için strateji kodundaki "plot" ile başlayan satırlarda grafikte görünmesini istediğiniz özelliğin önündeki "//" işaretlerini silebilirsiniz.
3-) Eğitim ve deneysel amaçlı bir stratejidir. Yatırım tavsiyesi olarak değerlendirilemez. Bu stratejiyi kullanarak gerçek piyasa işlem açarken dikkatli olmalı ve kendi risk değerlendirmenizi yapmalısınız.

7-RSI strategyHello, I've only been trying to learn PineScript for two months on my own, here I am posting a version of the strategy for a grid bot with 20 orders, order size 5%, earlier I tried to find something similar, but could not. Perhaps others, those who, like me, are just starting to learn PineScript, will find something useful. In the process of using grid bots, I noticed that the RSI indicator is sufficient, so the strategy uses 7 RSI indicators on different timeframes, but it is not necessary to use all 7, usually 3 is enough, therefore, by default, the RSI values are set to limit so that there is no effect on the settings of others. The step between bot orders is set in the settings. The code can of course be simplified, but it's better for understanding, I think.

ADX / RSI Strategy by Trade Rush (created by SirPoggy) This is one of many new strategies coming soon which were seen on Trade Rush
This one is the ADX / RSI Strategy seen here:
https:www.youtube.com/watch?v=uSkGE0ujyn4
While the strategy has been modified slightly to use the DMI instead of the ADX, the core of the strategy is essentially the same
Long signals are generated when the RSI is above 70, close is above the 200EMA, and the ADX is above 25 (added is the plus DMI over 25 and minus DMI below 20)
Stop loss is placed below /above the 21 EMA, however, there is a deviation required to ensure price is not too close to where a stop loss would be placed.
Short signals are generated when the RSI is below 30, close is below the 200EMA, and the ADX is above 25 (added is the minus DMI over 25 and plus DMI below 20)
I do not recommend using this strategy but I have provided this code for educational purposes.
Thanks!
Let me know which strategy you'd like coded next in the comments below.

RSI Hidden Divergence + Stochastic + 200 EMA @DaviddTechHey Traders,
This is my first strategy of many I hope. Inspired by a strategy I found on YouTube I wanted to see if it would work with a BOT strategy.
The idea is :
## LONG ##
* When the price is above 200 EMA take only LONG positions.
* Look for Bullish hidden divergence.
* Stochastic crossover to find our entry.
## SHORTS ##
* When the price is below 200 EMA take only SHORTpositions.
* Look for Bearish hidden divergence.
* Stochastic crossunder to find our entry.
You can used a fixed percentage, ATR, HH/LL or a FIB level to take profit.
Everything is very visual and can be connected easily to a bot.
I will be doing a video on HOW-TO setup in a couple of days.
## MUTLI LEVEL PROFITS ##
This will show you on backtest is you take profits at 3 levels however I have not tested on a BOT strategy.
NOTE : This is for educational purposes and please test on a paper account, as I said this is my first strategy.
I will be working and back testing new strategies every week.
- Made with ♥ @DaviddTech

Double Bollinger StrategyFrom "Bitcoin Trading Strategies: Algorithmic Trading Strategies For Bitcoin And Cryptocurrency That Work" by David Hanson.
*Works better with 1hr time frame and some input optimisations.
"Double Bollinger Band Scalping System
Recommended Timeframe: 1 minute or 5 minute *
Required Indicators:
// - RSI with a length of 14 (default settings)
// - Bollinger band #1 settings: Length = 50, stDev = 1 Hide the basis/middle line (basis line not needed for this strategy)
Note: This is the slower bollinger band in the directions
// - Bollinger band #2 settings: Length 20, stDev = 1 Hide the basis/middle line (basis line not needed for this strategy)
Note: This is the faster bollinger band in the directions
Enter Long/Buy Trade When:
// - RSI is above the level 50
// - A candle closes above the top of the faster bollinger band
Enter a long when a candle then closes above the top of the slower bollinger band, and price is above the top of both bands
Place a stop loss under the low of the entry candle Example of a long trade using this strategy
Exit Long Trade When: A candle closes below the top band of the fast bollinger band
Enter Short/Sell Trade When:
// - RSI is below the level 50
// - A candle closes below the bottom of the faster bollinger band
Enter a short when a candle then closes below the bottom of the slower bollinger band, and price is below both bands
Place a stop loss above the high of the entry candle Example of a short trade using this strategy
Exit Short Trade When: Price closes inside the bottom of the faster bollinger band"

Wunder VolPIN StrategyI believe it is perhaps one of the world's simplest but one of the rare indicators where backtest results are so efficient. As a strategy, we buy every time a buy signal comes, but we need to repeat this 20 times and we buy when our average rises by 0.65 percent. I know that this indicator, which I did not prepare for the sales strategy, also works very efficiently in sales transactions.
On settings part you can change the volatility and PIN percentage. I prepare for 1 minute graphs for coins. Maybe if you can arrange the settings for the stocks and different time periods.
I use this strategy in one minute periyod. 20 times buy strategy is very important. On every buy signal you must work in process. You can arrange stoploss if you want. But I am not using stoploss system.

Combo Backtest 123 Reversal & Smoothed RSIThis is combo strategies for get a cumulative signal.
First strategy
This System was created from the Book "How I Tripled My Money In The
Futures Market" by Ulf Jensen, Page 183. This is reverse type of strategies.
The strategy buys at market, if close price is higher than the previous close
during 2 days and the meaning of 9-days Stochastic Slow Oscillator is lower than 50.
The strategy sells at market, if close price is lower than the previous close price
during 2 days and the meaning of 9-days Stochastic Fast Oscillator is higher than 50.
Second strategy
This is new version of RSI oscillator indicator, developed by John Ehlers.
The main advantage of his way of enhancing the RSI indicator is smoothing
with minimum of lag penalty.
WARNING:
- For purpose educate only
- This script to change bars colors.
ADX + RSI Strat// This is a strategy that uses the 7 Period RSI to buy when the indicator is shown as oversold (OS) and sells when
// the index marks overbought (OB). It also uses the ADX to determine whether the trend is ranging or trending
// and filters out the trending trades. Seems to work better for automated trading when the logic is inversed (buying OB
// and selling the OS) wihout stop loss.

15 min Spear Wunder LONG BotThis indicator, which was developed to collect a coin in a downtrend for a long time, is based on the strategy of exiting with 1 percent profit by using the bots. This indicator is based on the data of the 15 min Spear by TrendciHoca indicator. The indicator that buys with the signal coming to the coin, which is in a downtrend, is designed so that you can set it in the settings section. Its default value is 10. This value can be adjusted to be lower or higher than 10 according to the risk you can take. The profit portion of 1 percent can also be adjusted upwards according to the level of risk you can take. I prefer to use all setting to 15min interval and for cryptos. You can change setting for any other interval.

RSI Cross [xaurr]This is simple but profitable rsi cross strategy, to find optimal values you can change rsi and ema periods.
Good Luck!

TradePro's Trading Idea Cipher Divergence EMA Pb StrategyHere I present you on of Trade Pro's Trading Idea: Cipher B+ Divergence EMA Pullback Strategy.
Optimized the crypto pairBTC/USDT in the 30 minute chart.
There is the possibility to switch between short and long positions.
You can choose between 2 different take profit/stop loss types: The Lowest Low/ Highest High Stop Loss/ Take Profit and the ATR Take Profit/ Stop Loss.
-----------------------------------------------------------------------------------
How does the strategy work?
ENTRY
Long
The price must be above the 200 EMA .
The price needs to make a pullback into the 50 EMA .
Right after that, the Cipher B indicator must give a buy signal, it must be below the zero line and the Money Flow cloud must be green.
Short
Contrary to the premise of long positions.
EXIT
Lowest Low/ Highest High Exit
The Lowest Low (long) / highest high (short) serves as the stop loss. The TP is formed on the basis of a factor.
(Long for example: *Lowest Low* multiplied by *Profitfactor* = TP).
ATR Exit
The value of ATR at the time of buying is multiplied by the value entered in "Profit factor ATR" and "Stop factor ATR". As soon as the price reaches this value, it is closed.
Important
The script must be optimized for each coin or currency pair. However, only the values for the profit factor, the stop loss and Lowest Low / Highest High are relevant.
Also, by changing the Chanel Length and the Chanel Average, you can create strong profit changes.
The results of the strategy are without commissions and leverage.
If you have any questions or feedback, please let me know in the comments.
If you need more information about the strategy and want to know exactly how to apply it, check out my profile. There I have created a tutorial for the function of the script.

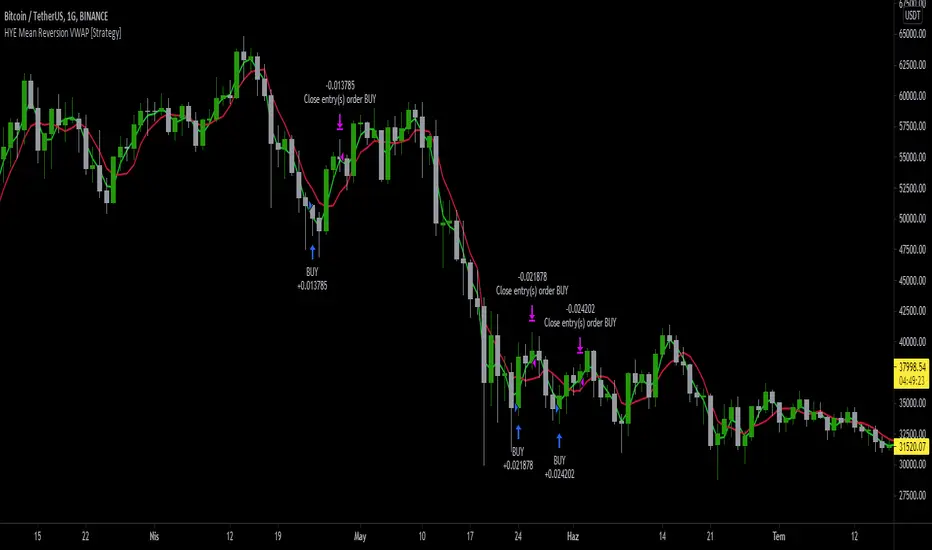
HYE Mean Reversion VWAP [Strategy]An RSI filtered version of PJ Sutherland's Jaws Mean Reversion algorithm using volume weighted average price (VWAP) instead of simple moving average (SMA).
"Long" on the close when;
1-) 2 period VWAP closes 3% or more below the 5 period VWAP ,
2-) 5 period exponential average of the 2 period RSI is below 30.
"Exit Long" on the close when;
1-) 2 period VWAP closes above the 5 period VWAP.
"Short" on the close when;
1-) 2 period VWAP closes 3% or more above the 5 period VWAP ,
2-) 5 period exponential average of the 2 period RSI is above 70.
"Exit Short" on the close when;
1-) 2 period VWAP closes below the 5 period VWAP.
*** You can change the needed percentage for long and short trades, periods of VWAPs and RSI levels.
*** You can select the trend direction: "Long Only" , "Short Only" or "Both". Default is "Long Only".
I used the "VWAP with period" indicator code of @neolao. Special thanks to @neolao.
Indicator Link:
HYE Mean Reversion SMA [Strategy]An RSI filtered version of PJ Sutherland's Jaws Mean Reversion algorithm.
"Long" on the close when;
1-) 2 period simple moving average closes 3% or more below the 5 period simple moving average,
2-) 5 period exponential average of the 2 period RSI is below 30.
"Exit Long" on the close when;
1-) 2 period simple moving average closes above the 5 period moving average.
"Short" on the close when;
1-) 2 period simple moving average closes 3% or more above the 5 period simple moving average,
2-) 5 period exponential average of the 2 period RSI is above 70.
"Exit Short" on the close when;
1-) 2 period simple moving average closes below the 5 period moving average.
*** You can change the needed percentage for long and short trades, periods of simple moving averages and RSI levels.
*** You can select the trend direction: "Long Only" , "Short Only" or "Both". Default is "Long Only".
