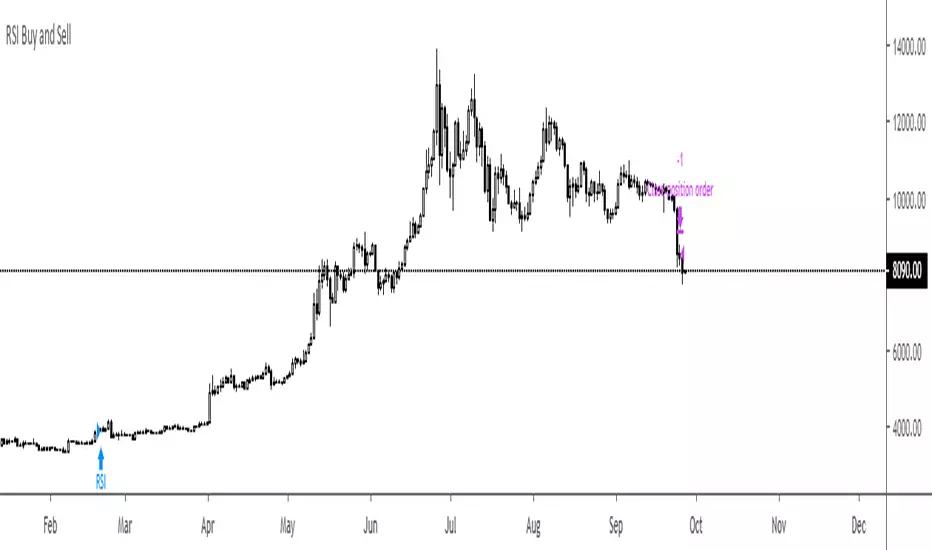
RSI Buy and SellThis is sooooooooo simple.
Buy when RSI is above 70 and don't sell til it'sunder 30.
Индекс относительной силы (RSI)
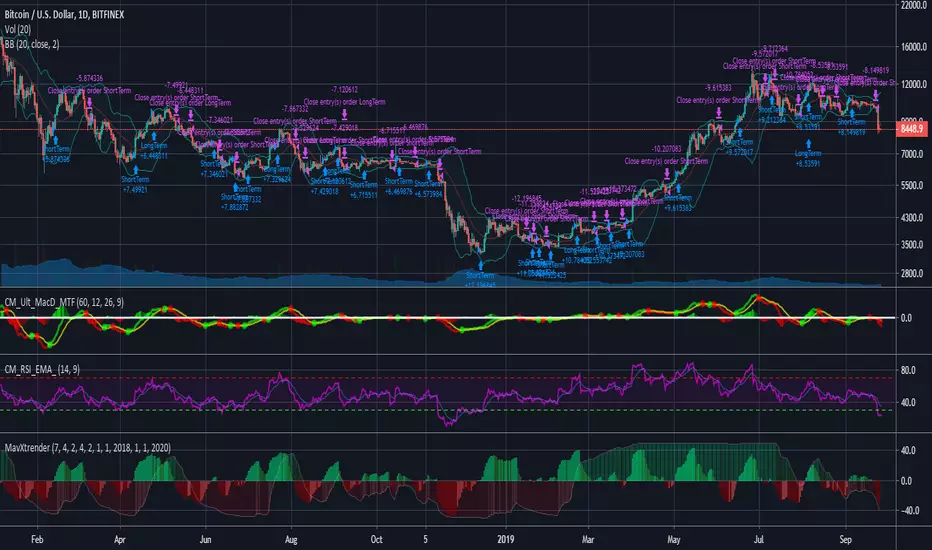
BTC Daily Strategy BFStrategy based on code by @CredibleHulk so thanks for that.
This is a strategy for the Daily Bitcoin chart which uses the MACD, RSI, Stochastic RSI and a moving average.
The conditions for long or short signals depend on the indicators above crossing user-defined thresholds.
Long signal = (Stochastic RSI k value is below Stochastic Sell Threshold) AND EITHER (MACD delta crosses above MACD Threshold OR RSI crosses above RSI Threshold)
Short signal = (MACD delta crosses below 0) AND EITHER (Close Price - an SMA of the ohlc4 values crosses below the DMA threshold OR Stochastic RSI k value is above Stochastic Sell Threshold)
INSTRUCTIONS
Green background = go long
Red background = go short
You can adjust stop loss values for long or short signals in settings as well as all parameters for the indicators.

MavXtrenderConverted the B-Xtrender script from Puppytherapy into a strategy script.
B-Xtrender was created by Bharat Jhunjhunwal and published in this IFTA Journal .
I've added the following features:
Ability to use factors instead of individual values for each parameter. This will allow you to quickly check different averages (5 vs 7 for example).
Defaults adjusted for crypto trading (7 days/week).
Switches to use either the short or long term indicator, or both.
Time window
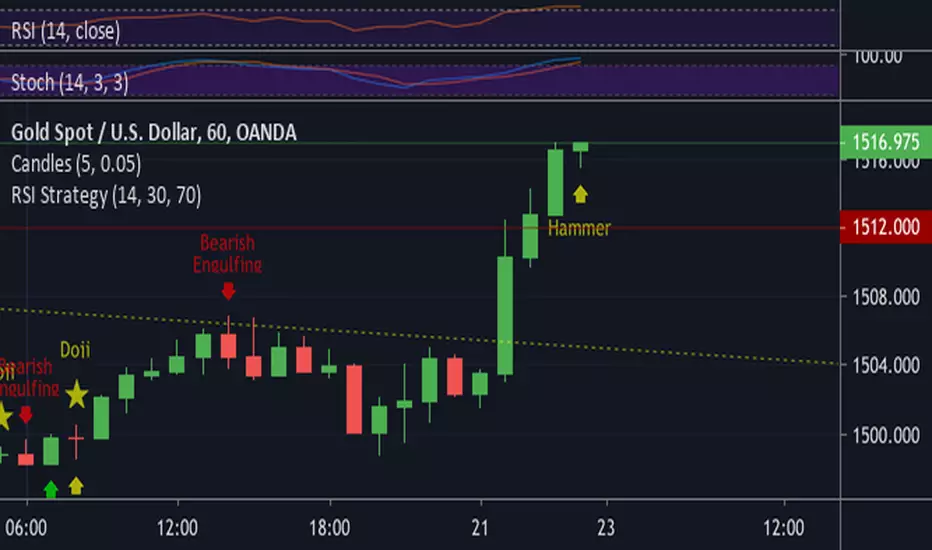
RSI StrategyNothing special in this strategy its just purely and application of RSI in 1hour chart of XAUUSD.
Buy and Sell Indicator - OnePunchOne of the Top Class Breakout, Buy and Sell Strategy for Long Term, Day Traders and Short Term Holder.
With This Script;
You Can Get Breakout Signals
You Can Get Buying Points
You Can Get Selling Points
You Can Find Out If a Stock Over Sold
You Can Find Out If a Stock Over Bought

Volatility WatchREAD ME FOR INSTRUCTIONS ==>
Signal = Green (bullish) Red (bearish)
Strength indicator = Blue line
Slow Stochastic = Black line
Low- line = Purple dashed
High- line = Red dashed
Has been tested on Stocks, Crypto, and other Currencies
Get help to find trade ideas!! => I look for Daily conditions to be oversold (Signal and Stochastic to be under low- line with Strength moving up)
DIRECTIONS ==>
PART 1 --> When SIGNAL line turns green and STRENGTH line (blue line) are both greater than or equal to the SLOW STOCHASTIC (Black line) -- This indicates Bullish Trend
PART 2 --> IF SIGNAL line, Strength line, and Slow Stochastic are Below the LOW-LINE (Marked at 20) this is an indication of "Oversold" conditions.
PART 3 --> IF SIGNAL line crosses above Slow Stochastic while they are both below the LOW-LINE (Purple dashed line) and Strength line (blue line) has already
crossed above Slow Stochastic line (black line), this indicates a potential buying opportunity and...
depending on time frame the user could use this indicator to accumulate for Long position, day trade the 2 minute chart, or swing trade.

strat_RSIOMA_trend_ha--- Calcule de Heikin Ashi
---- RSI sur HA => RSIOMA
---- Filtre EMA
---- Stoploss

PD Crypto Performer PRO (Backtest)Description:
This is the backtesting version of the PD Crypto Performer Pro (Alert) . You can choose to backtest either one of the two strategies included, a trend-identifying swing strategy and a low risk scalping strategy. Both strategies assume the same capital amount invested ($10,000) each trade. You can also see how your capital grows over time by enabling the reinvesting proceeds option. For details, please check out this tutorial .
The backtesting results could be easily improved in live trading by utilizing the “Take Profit” signals and following the recommended methods of use below.
To assist the decision-making process, the code currently references BTCUSD. As a result, it is only suitable for crypto traders. However, we are working on the stock and forex versions, and the Performer will have these compatibilities soon.
Most importantly, our signals DO NOT REPAINT !
Recommended Use:
- Time Frame: 1HR
- Asset: Large cap crypto assets.
For lower risk tolerance, we recommend using the indicator on ETHUSD. For maximizing profits, we recommend using the indicator on BCHUSD.
- Always set stop loss according to your own risk tolerance
- Take profits along the way. Check out this video tutorial for when to reenter after our take profit signals.
Recommended Use for Advanced Traders:
- Position sizing:
Larger position if the 1HR signal is in the same direction compared to the 4HR trend.
Smaller position if the 1HR signal is in the opposite direction compared to the 4HR trend.
- Better entry/exit points:
Track the 1HR signal for the asset you are trading on other exchanges along with the BTCUSD 1HR signal. Sometimes, the signals from different exchanges occur with a 1-2 hour difference. You could use these earlier signals along with a lower time frame (eg. 15min) entry confirmation from your own exchange for better entry / exit points.
- Use “Take Profit” signals for counter trend scalps. Recover at the reentering opportunities . This works best with candlestick pattern confirmations.
Never use this if you suspect a flag / inverted flag pattern is forming.
Go to www.phi-deltalytics.com and sign up for a FREE trial today!
Let us know if you have any questions or recommendations. We are here for your success!
Disclaimer:
It should not be assumed that the methods, techniques, or indicators presented will be profitable or that they will not result in losses. Past results are not necessarily indicative of future results. This is not a solicitation of any order to buy or sell.

PD Crypto Performer (Backtest)Description:
This is the backtesting version of the PD Crypto Performer (Alert) . The strategy assumes the same capital amount invested ($10,000) each trade. You can also see how your capital grows over time by enabling the reinvesting proceeds option. For details, please check out this tutorial . The backtesting results could be easily improved in live trading by following the recommended methods of use below.
To assist the decision-making process, the code currently references BTCUSD. As a result, it is only suitable for crypto traders. However, we are working on the stock and forex versions, and the Performer will have these compatibilities soon.
Most importantly, our signals DO NOT REPAINT !
Recommended Use:
- Time Frame: 1HR
- Asset: Large cap crypto assets.
For lower risk tolerance, we recommend using the indicator on ETHUSD. For maximizing profits, we recommend using the indicator on BCHUSD.
- Always set stop loss according to your own risk tolerance
- Take profits along the way.
Recommended Use for Advanced Traders:
- Position sizing:
Larger position if the 1HR signal is in the same direction compared to the 4HR trend.
Smaller position if the 1HR signal is in the opposite direction compared to the 4HR trend.
- Better entry/exit points:
Track the 1HR signal for the asset you are trading on other exchanges along with the BTCUSD 1HR signal. Sometimes, the signals from different exchanges occur with a 1-2 hour difference. You could use these earlier signals along with a lower time frame (eg. 15min) entry confirmation from your own exchange for better entry / exit points.
Go to www.phi-deltalytics.com and sign up for a FREE trial today!
Let us know if you have any questions or recommendations. We are here for your success!
Disclaimer:
It should not be assumed that the methods, techniques, or indicators presented will be profitable or that they will not result in losses. Past results are not necessarily indicative of future results. This is not a solicitation of any order to buy or sell.

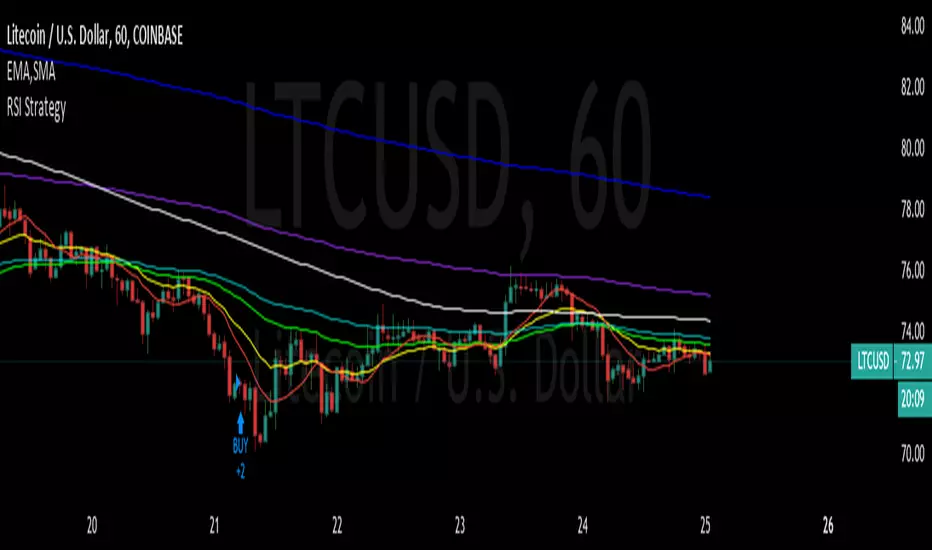
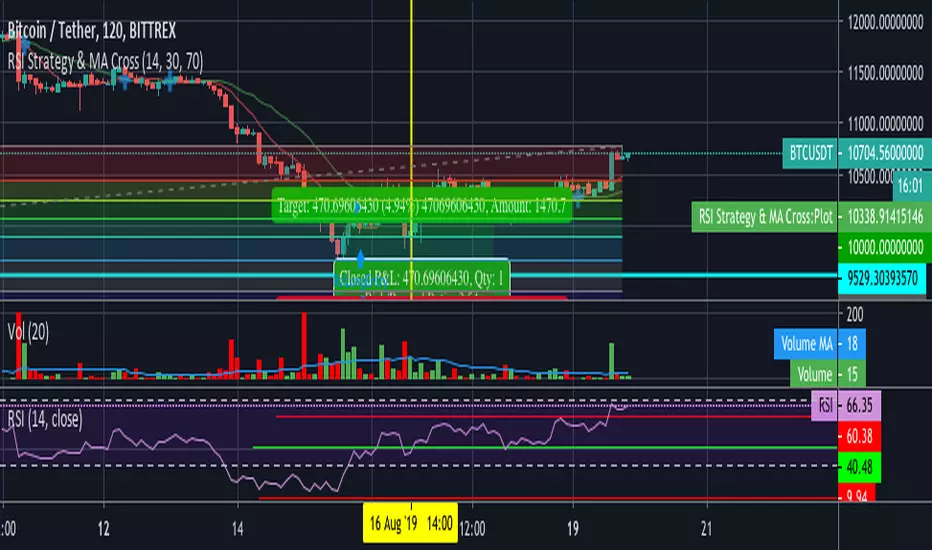
RSI Strategy & MA CrossCombination of two strategy.
MA Cross strategy is using 2 sma at 9 & 21. It can be configured through the source code.
RSI strategy to decide whether the stock/crypto is currently overbought/oversold.
Useful for quick entry and exit trade.
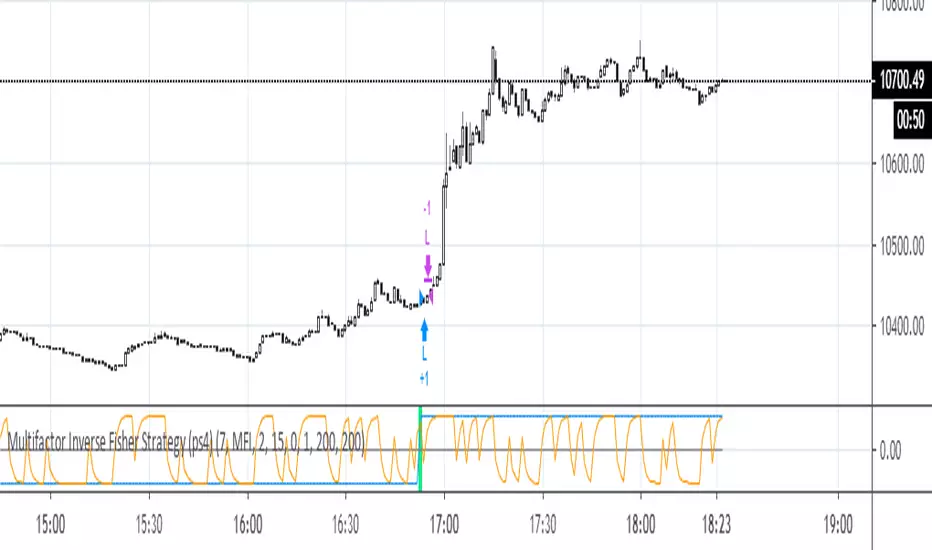
Multifactor Inverse Fisher Strategy (ps4)Best for higher time frames - 30m, 1H, 2H, 3H, 4H, D this strategy uses several factors that are pushed through an Inverse Fisher Transform (IFT). The higher the TF, the better the performance, up to 98%, but the number of deals tends to drop). Middle time frames (5m, 15m) look viable with Scaled Price (Scaled %P) and MFI factors. The factor list can be extended to include cci, stoch, rsi_stoch, emo, macd, cog, dpo, roc, accdist, cctbb, mom, awesome, tva, etc. Some of them need to be rescaled to a 0..100 interval. The IFT produces a value in the -1..1 interval (see: www.mesasoftware.com). This indicator does NOT repaint.
Double RSI Strategy(ALMA RSI + Hull RSI)We're back at it with a brand new strategy centered around an Arnaud Legoux RSI and Hull RSI. This one took a lot longer to make than usual, which is the reason there hasn't been any new posts the last week.
The first component of the strategy is the Hull RSI. The Hull RSI is shown in light blue and its upper and lower bounds are plotted as the dark pink and teal horizontal lines. Applying a Hull Moving Average to the RSI results in higher smoothness and less false signals. The lengths of the RSI and the HMA of the RSI can both be adjusted by the user.
We then used a similar process to calculate an Arnaud Legoux Moving Average(ALMA) of the RSI. The ALMA RSI is shown as the solid white line, while its upper and lower thresholds are the green and red horizontal lines. The ALMA RSI is a great tool since it is adaptable for multiple different uses - users can adjust the offset, sigma, and length values to modify the RSI's responsiveness and smoothness.
Input Options for ALMA RSI:
-Offset : Value in range {0,1} that adjusts the curve of the Gaussian Distribution. A higher value will result in higher responsiveness but lower smoothness. A lower value will mean higher smoothness but less responsiveness.
-Length : The lookback for each ALMA calculation.
-Sigma : Defines the sharpe of the curve coefficients.
The entry and exit signals generated by the Hull RSI are represented by the small green(buy) and red(sell) circles, while the green and red vertical highlights are the ALMA RSI's buy and sell signals. By default, we set the pyramiding to 3, with 50% equity used in each trade to allow the ALMA to make the longer-term swing trades and higher frequency trades made with the Hull RSI.
The strategy will be posted on our website, ProfitProgrammers.com, soon. As always, we will be offering 3 day trials for this strategy so feel free to send a quick message to start the trial period!


2-Period RSI strategy (with filter)2-period RSI strategy backtest described in several books of the trader Larry Connors . This strategy uses a 2 periods RSI , one slow arithmetic moving average and one fast arithmetic moving average.
Entry signal:
- RSI 2 value below oversold level (Larry Connors usually sets oversold to be below 5, but other authors prefer to work below 10 due to the higher number of signals).
- Closing above the slow average (200 periods).
- Entry at closing of candle or opening of next candle.
Exit signal:
- Occurs when the candlestick closes above the fast average (the most common fast average is 5 periods, but some traders also suggest the 10 period average).
Entry Filter (modification made by me):
- Applied an RSI2 arithmetic moving average to smooth out oscillations.
- Entered only when RSI2 is below oversold level and RSI2 moving average is below 30.
* NOTE: In the stocks that I evaluate daily the averages of 4 and 6 periods work very well as a filter.
Comments:
This strategy works very well in Daily charts but can be applied in other chart times as well. As this is a strategy to catch market fluctuations, it presents different results with different stocks.
I have been applying this strategy to the stocks of the Brazilian market (BOVESPA) and have enjoyed the result. Every day I evaluate the stocks that are generating entry signals and choose which one to trade based on the stocks with the highest Profit Value.
The RSI 2 averaging filter probably will reduce profit of the backtests because reduces the number of signals, but the Profit Value will usually increase. For me this was a good thing because without the filter, this strategy usually shows more signals than I have capital to allocate.
Before entering a trade I look at which fast average the paper has the highest Profit Value and then I use this average as my output signal for that trade (this change has greatly improved the result of the outputs).
This strategy does not use Stop Loss because normally Stop Loss decreases effectiveness (profit). In any case, the option to apply a percentage Stop Loss if desired is added in the script. As the strategy does not use stop, extra caution with risk management is advisable. I advise not to allocate more than 20% of the trade capital in the same operation.
I'm still studying ways to improve this strategy, but so far this is the best setup I've found. Suggestions are always welcome and we can test to see if they improve the backtest result.
Good luck and good trades.
================================================
Backtest das estratégia do IFR de 2 períodos descrita em varios livros do trader Larry Connors . Esta estratégia usa um IFR de 2 períodos, uma média movel aritmética lenta e uma média movel aritmética rápida.
Sinal de entrada:
- Valor do IFR 2 abaixo do nível de sobrevenda (Larry Connors usualmente define sobrevenda sendo abaixo de 5, mas outros autores preferem trabalhar abaixo de 10 devido ao maior número de sinais).
- Fechamento acima da média lenta (200 períodos).
- Realizado a compra no fechamento do candle ou na abertura do candle seguinte.
Sinal de saída:
- Ocorre quando o candle fecha acima da média rápida (a média rápida mais comum é a de 5 períodos, mas alguns traders sugerem também a média de 10 períodos).
Filtro para entrada (modificação feita por mim):
- Aplicado uma média móvel aritmética do IFR2 para suavisar as oscilações.
- Realizado a entrada apenas quando o IFR2 está abaixo do nível de sobrevenda e a média móvel do IFR2 está abaixo de 30.
*OBS: nos ativos que avalio diariamente as médias de 4 e 6 períodos funcionam muito bem como filtro.
Comentários:
Esta estratégia funciona muito bem no tempo gráfico Diário mas pode ser aplicada tambem em outros tempos gráficos. Como trata-se de uma estratégia para pegar oscilações do mercado, ela apresenta diferentes resultados com diferentes ativos.
Eu venho aplicando esta estratégia nos ativos do mercado brasileiro (BOVESPA) e tenho gostado do resultado. Diariamente eu avalio os papeis que estão gerando entrada e escolho qual irei realizar o trade baseado nos papeis que apresentam maior Profit Value.
O filtro da média do IFR 2 reduz o lucro nos backtests pois reduz também a quantidade de sinais, mas em compensação o Profit Value irá normalmente aumentar. Para mim isto foi algo positivo pois, sem o filtro, normalmente esta estratégia apresenta mais sinais do que possuo capital para alocar.
Antes de entrar em um trade eu olho em qual média rápida o papel apresenta maior Profit Value e então eu utilizo está média como meu sinal de saída para aquele trade (esta mudança tem melhorado bastante o resultado das saídas).
Está estratégia não utiliza Stop Loss pois normalmente o Stop Loss diminui a eficácia (lucro). De qualquer maneira, foi acrescentado no script a opção de aplicar um Stop Loss percentual caso seja desejado. Como a estratégia não utiliza stop é aconselhável um cuidado redobrado com o gerenciamento de risco. Eu aconselho não alocar mais de 20% do capital de trade em uma mesma operação.
Ainda estou estudando formas de melhorar esta estratégia, mas até o momento está é a melhor configuração que encontrei. Sugestões são sempre bem vindas e podemos testar para verificar se melhoram o resultado do backtest.
Boa sorte e bons trades.

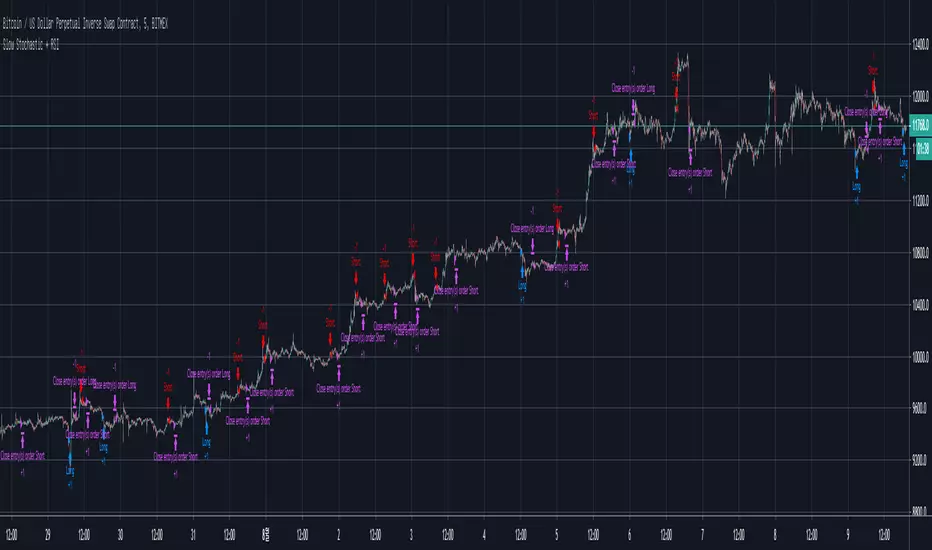
[XBTUSD 5M] Slow Stochastic + RSI Strategyhis Strategy is Low lisk, middle Return
But, The signal does not occur often.
I think a good strategy is to buy (or sell) as a split
In this way, most transactions will be profitable.
Caution! It seems good to end the deal at once.
Even if you are losing money
Do not be greedy
If it helped, please leave a comment and Like
Good Luck :)
안녕하세요.
처음으로 전략 스크립트 글을 남깁니다.
이 전략은 비트맥스 스캘핑용 전략이며,
낮은 위험성으로 중간의 수익률을 기대할 수 있습니다.
하지만 시그널이 자주 발생하지는 않습니다.
전략의 핵심은 시그널이 발생했을 때, 분할로 매수하거나 매도하며
클로즈 시그널이 나왔을 때, 한 번에 파는 것이 중요합니다.
전략은 한번에 끝내는 것이 좋습니다.
손실을 보고 있거나, 더 큰 수익률을 위해 욕심을 부리지 마세요.
만약 도움이 되었다면 좋아요와 댓글을 남겨주세요.
감사합니다.

RSI - Oversold BTC StrategyWhen BTC goes through a large swing downward, it often goes into oversold territory and quickly swings back upwards. This strategy is designed to capitalize on the swings without gettings stopped-out with the surrounding volatility. I find that this strategy works best on the 5 minute chart.
You can set the maximum loss (in dollars), trade size (in BTC ), plus your trailing stop and offset (pips).
The blue line on the graph indicates your stop loss point, which trails your buy-in point by your specified maximum loss. Remember, in this strategy, this stop-loss is only used to protect you from unexpected large swings, your trailing stop loss is used to capture profits.


Strategy JMA(7,50,RSI) crossing RSI(14,close)Hello, i would like to submit a script dealing with Jurik Moving Average Crossing RSI . Also to avoid false positive, i made a test with long/short positions and entry/closing prices but unfortunately it's not working. I may be too noob to Pine.
If you have some ideas to refactor / improve / make this section works:
// ======= DEBUGGGGGGGG ============
long_price = 0.0
short_price = 0.0
if(startTime and endTime)
if(goLong())
long_price := close
strategy.entry("Buy", strategy.long, when = goLong())
strategy.close("Buy", when = killLong() and close > long_price)
// Shorting if using
goShort() => killLong()
killShort() => goLong()
if(startTime and endTime)
if(goShort())
short_price := close
strategy.entry("Sell", strategy.short, when = goShort() and close < short_price)
strategy.close("Sell", when = killShort())
// =========================
Thanks,

Stochastic Rsi based trading strategyThis strategy checks if the stochastic rsi is oversold, then checks if %K and %D are less than 10. If all these conditions happens, we have a buy signal.
After this, we will receive a sell signal when the stochastic rsi crosses under.
