Индекс относительной силы (RSI)

RSI-RENKO Divine Strategy (Backtesting)Live, non-repainting strategy using RENKO and RSI mixed together to multiple types of long and short positions.
- Features -
Live entry direction with trade warnings and alerts
Live trade building buy and sell limits (for buy/sell limits)
Entry location icons as well as pyramid entries (to add to existing position)
Swing trades that keep you in the trade for the maximum possible profit
1 scalp target based on the RSI settings and entry location
Dynamic trailing stop for swings and scalps
Alert conditions for every update and condition change of the strategy (Provided by indicator study)
4 pre-built color themes, including candlestick coloring
This strategy is best used with the companion indicators: Renko RSI and Renko Trend Momentum using the identical RSI and Trend settings.
The linked script is identical and used solely for alerts, because Trading View still after 3 years of requesting does not provide the ability to use alert conditions inside a strategy script, only an indicator script. This strategy should be used to backtest your settings.
The approach to this strategy uses several parallel trades of different types. In order to generate multiple trade types the "pyramid trades" setting of the strategy (second tab of the settings that lets you adjust the number of pyramid contracts) should be used.
- Trade Types -
Swing: This trade is entered on the solid arrows after the RSI has become oversold or overbought. It is key that all trades wait for some degree of pullback before entering, even after the trend flips between positive and negative. This trade is held until stopped out or an opposite trade is triggered that reverses the position.
Scalp: These trades have a limit buy/sell entry and a target. The initial target is the opposing RSI overbought or oversold level and changes in real time.
Turning on/off the different trade types (strategy only) is simple done by decreasing the number of contracts used for that trade type to zero. When the quantity is set to zero, that trade is not considered.
- Session -
The session filter is used to narrow trade executions by only allowing trades that are inside the session boundaries. This can be used to isolate the London or New York session for example. The default is 24 x 7 which filters no trades (Trading View has a bug when resetting this, so simply reset the indicator to get it back to 24x7).
Please see the following 3 videos introducing the concept of this strategy.
All feature requests or bug reports are welcome either by direct messaging or comments on this page or the linked indicator page.
Please PM for access. Cheers.

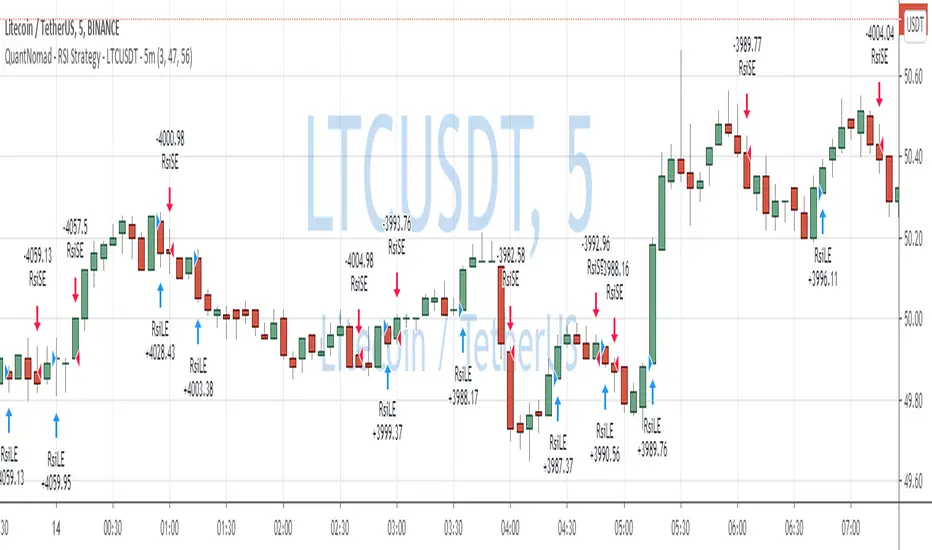
QuantNomad - RSI Strategy - LTCUSDT - 5mReally nice performance of Simple RSI Strategy for LTCUSDT ( Binance ) 5m chart.
Params: RSI Length: 3, RSI OverSold level: 47, RSI OverBought Level: 56
Performance: 391% profit, 2400 trades, 42% prof, 14.6% dd , 0.65 sharpe.
I think this strategy can be a really nice base for a pretty good strategy. We have quite a lot of trades here you can add additional filters that will improve strategy a bit.
And remember:
Past performance does not guarantee future results.
QuantNomad - RSI Strategy - NKE - 5mReally good performance of Simple RSI Strategy for Nike (NKE) 5m chart.
Params: RSI Length: 30, RSI OverSold level: 45, RSI OverBought Level: 60
Performance:57% profit, 112 trades, 73% prof, 6.7% dd, 1.36 sharpe.
And remember:
Past performance does not guarantee future results.


diamond_test_toolThis is a small test tool. The orders are close to random. The alg i used is nothing special.


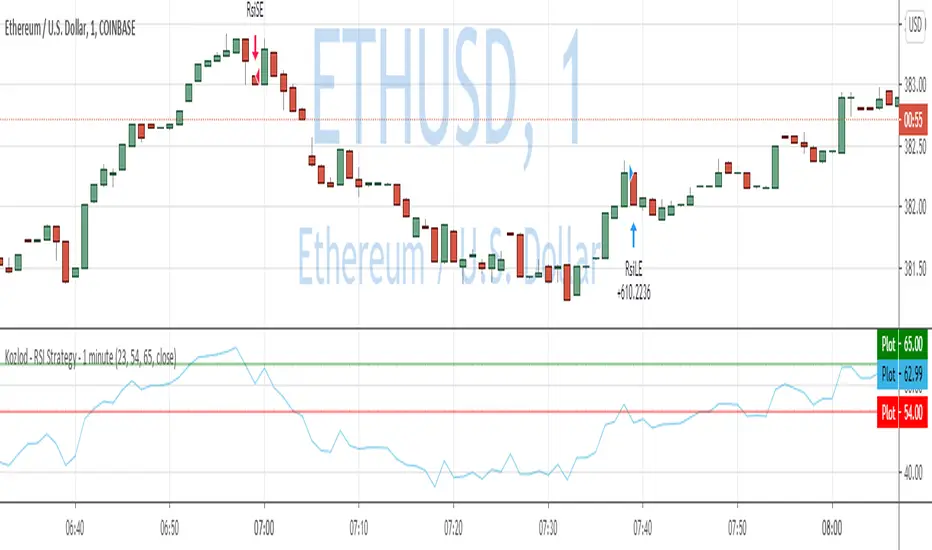
Kozlod - RSI Strategy - 1 minute - ETHUSDTrying to find simple strategies with optimal parameters which work well for certain symbols/timeframe.
Found that basic RSI strategy without any position management works pretty good for 1m chart for BTCUSDT.
It might not work very good on it's not but can give you a pretty good base for more complicated indicators.
Also, some position management as simple as static SL and PT can improve performance quite a lot.
And remember:
Past performance does not guarantee future results.
Kozlod - RSI Strategy - 1 minuteStarted to play with very simple strategies. Trying to find ones with optimal parameters which work well for certain symbols/timeframe.
Found that basic RSI strategy without any position management with high RSI length (65 in this script) works pretty good for 1m chart for few stocks.
It's also not bad for AAPL , SPY .
It might not work very good on it's not but can give you a pretty good base for more complicated indicators.
And remember:
Past performance does not guarantee future results.

STOP-LOSS-RSI with Edge-Preserving Filter Strategy V2Modified RSI strategy with entry and exit points.
I have allowed for High and Low risk for anyone interested in using it (NO GUARANTEES. DO YOUR OWN RESEARCH).
I will later consider incorporating the standard RSI for exit points. I am sure returns will increase based on current test runs :)
Returns look good based on the strategy result.

Simple Relative Strength IndexCreated this script to simply let us predict buy and sell for RSI 15 and 85 (configurable).
It is best use for ETH and monthly chart.
Good for people who can not stay for daily trade and only able to trade few times a month.
The earning is quite lucrative while ETH is on up trend. However, this will not work when ETH on side way.
This only work when ETH is excited!!!
Happy sharing..
Credit to anonymous-es that i used their codes.

BB + RSI testThis is a back-test tool for the BB + RSI indikator
- Set your gain percentage and the rest of your parameters and see how does it work on a chart.
- The pyramid buying is on by default you can turn it off in indicator settings/properties

TradersVenue RSI+OHL StrategyTradersVenue RSI+OHL strategy generates buy/sell signals basis the open=high, open=low, RSI crossover above 60 and RSI crossunder 60 logic. Back testing results are good. However since it uses HeikinAshi charts exact profit will vary. But basis my trading experience its highly profitable and can be used for intraday and positional trading. This will benefit option writers to maximum as the results are quite consistent.
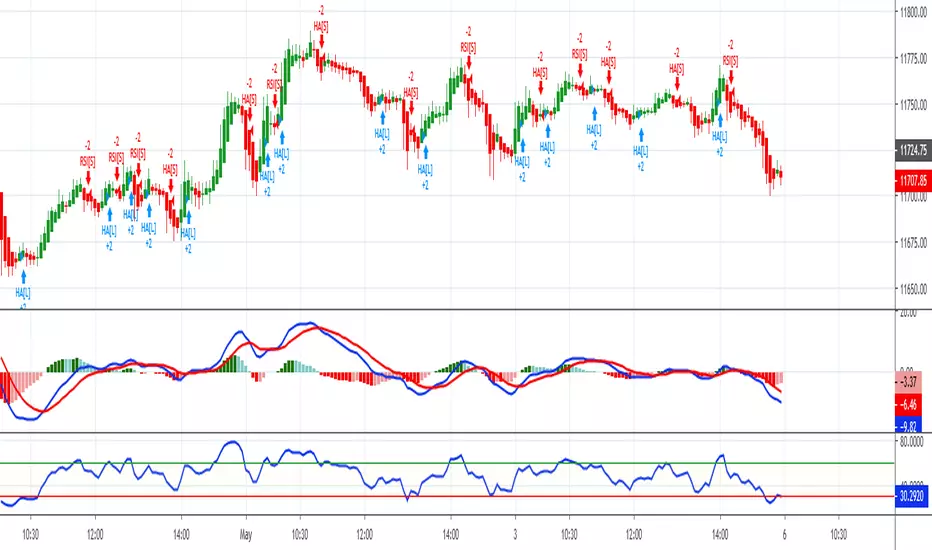
TradersVenue RSI+OHL StrategyThis is one fantastic trading strategy which works on RSI and OHL metrices. Go long when RSI crosses above 60 and go short when RSI crosses below 60. Apart from that in 15 mins candle if open = high in Heikin-Ashi charts then go short and if open = low then go long.

Carlos_Setup: IFR&BB 5 MinIndicador com entrada para compra e venda no DOL e WDO. Tempo gráfico de 5 minutos e alvo de 4 pontos.

Carlos_Setup_DOL_Compra_5minO script foi realizado para ser utilizado apenas para os papéis DOL e WDO (não fiz testes com outros ativos, embora talvez possa ser aproveitado em mais algum). Ele utiliza as Bandas de Bolinger e o IFR para realizar as entradas. As indicações são apenas para COMPRA e o alvo inicial a ser buscado é de 5 pontos. O tempo gráfico que apresentou o melhor resultado para as configuração padrão foi o de 5 minutos.

RSI_Strategy_TradersVenueGo long if RSI crosses over 30 or 60. Go Short when RSI falls below 60. Back testing gives good amount of success and can be used in 3/5/15/30/60 minutes time frame with HeikinAshi charts. Don't use normal candles to reduce noise.


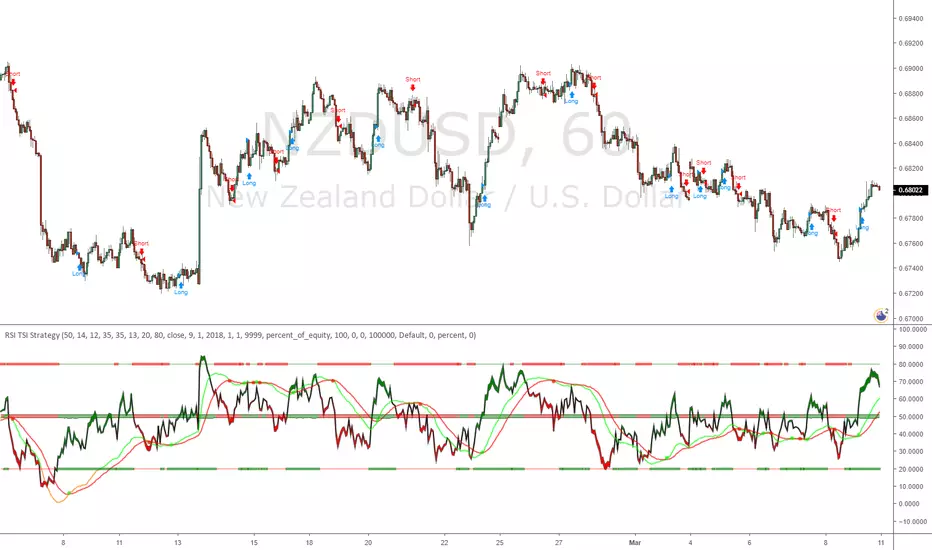
RSI TSI StrategyRSI & TSI combination, with Hull MA for a center Line.
Order entry with either RSI TSI or Hull MA
Experimental strategy for possible use as bot
Flow Trend Indicator StrategyImplemented the trend indication part of the CHOP_LRSI indicator as a strategy.

Tangram Bot 2 - SmartbotPrimeira Versão do Script Tangram Bot 2 da Smartbot para tradingview.
A intenção é agilizar e fazer um teste prévio e rápido do setup.
O resultado indicado aqui jamais corresponderá a um resultado real. É apenas uma ferramenta de estudo.
Ainda falta fazer e melhorar a parte de gestão de risco.
Caso queria fazer alguma sugestão ao cógido para melhorar a gestão de risco ou caso tenha encontrado algum erro, favor comunicar.
O tangram bot 2 combina o uso de até dez Indicadores de Análise Técnica com Gerenciamento de Risco (stop gain, stop loss, stop móvel, realização parcial, bloqueio de reversões, lucro máximo por dia e prejuízo máximo por dia) e Filtros Diversos (sentido das operações, uso do after-market, bloqueio de nova entrada após saída, hora inicial e hora final para negociação). São utilizados os indicadores Médias Móveis, HiLo Activator, MACD, ADX, Estocástico, VWAP, IFR, Bandas de Bollinger, Stop ATR e SAR Parabólico
