CDC RSI Divergence Strategy for Bitcoin ( by inwCoin )This strategy is based on CDC RSI Divergence indicator ( www.chaloke.com )
Also some code from CTC R-Breaker strategy ( ctc.in.th )
For best result, using 1 H timeframe.
I tried backtest at Bitmex ( XBTUSD ) Bitfinex ( BTCUSD ), OKex ( BTCUSD3M ) and it result is ok.
Индекс относительной силы (RSI)

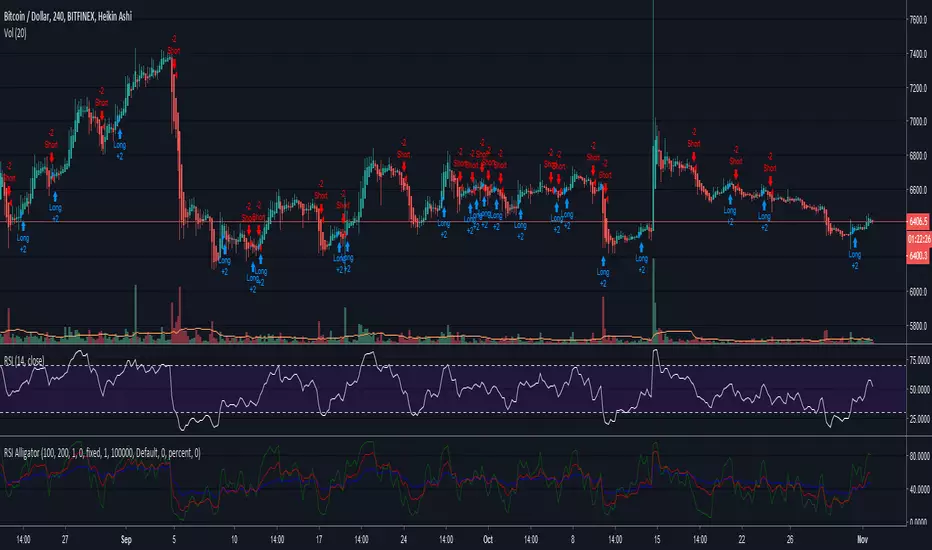
RSI Alligator StrategyHello trading family! Just wanted to give a quick write up and share the new code for the RSI Alligator Strategy. I amended it to show every crossover signal, weak and strong, so we can accurately gauge its effectiveness.
Having played with this for a couple hours now I have learned a few things
-Using Heikin Ashi seems to smooth it out a bit and provides about 20% fewer signals, leading to overall more accuracy. However, it can be misleading as the Heikin Ashi opening price doesn't always line up with the market price, especially in cases of large moves. Overall though it didn't seem too far off except for a few instances.
-Also, using the Heikin Ashi gives you a better idea of the trend, which this indicator is primarily used to detect and exploit.
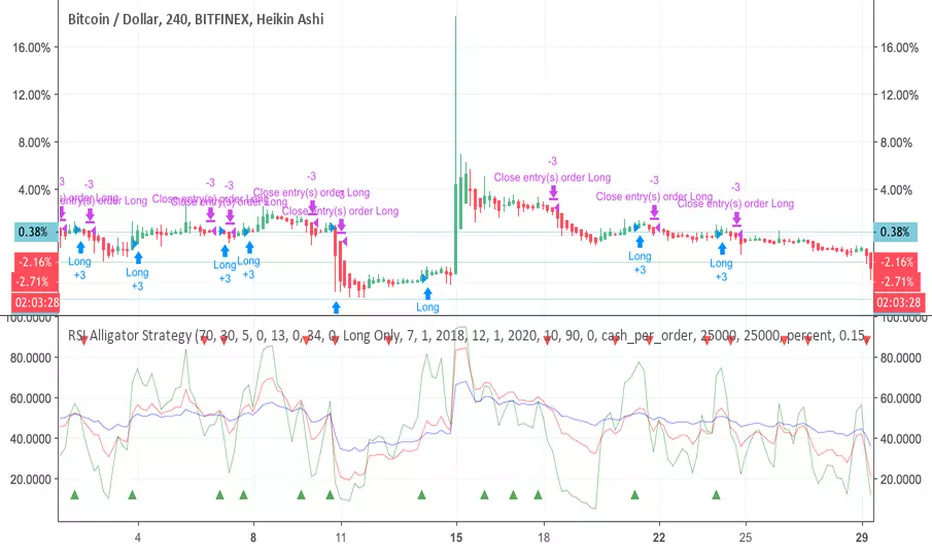
-Having tested on TF of 1H-1D, overall profitability is found to be highest between 4H-12H, with 1D giving the "safest" longer term signals, and lower TF's generating many more signals due to volatility.
-Instead of waiting for the next signal in order to close, you can often use a crossover/crossunder of the 5 and 13 to close the previous trade, especially if paired with a Heikin Ashi of opposite color (green to close a short, red to close a long)
-You will also notice several instances where the Green 5 period show divergences that aren't visible on the regular RSI, another handy little feature
So far I have still only tested this on BTCUSD. Feel free to apply it to any coin and let me know what you find.
Here is the script. If you have any ideas or suggestions please let me know!
RSI Alligator Strategy [forked from jedireza]Backtester for RSI alligator is Williams Alligator strategy using Relative Strength Index to predict entries
Original script can be found at
Altcoins StrategyBuy/Sell Altcoins strategy. Based on moving averages, divergences, price and volume

HMA + ATR CLOUD SYSTEMPlaying around with some ideas. Hull MA's have good entries and exits on their own, but together with ATR I find them to be even more solid. Only tested with crypto. Best results on daily timeframe and long only.
Stop loss, trailing and pyramiding code is functional. There is also a long only / short only option in the bottom of the settings.
Let me know what you think

NinetailsVulpix, but now only closing positions when they meet a take profit/stop loss target, and instead the middle red bars are used to reopen positions when in confluence the MA.
TDI - Traders Dynamic Index - Roshan [Mehdi]This method is based on Mr. Roshan's technique which use TDI with upper timeframe

RSI + BOLLINGER, Long-Short v1.3Custom RSI + BOLLINGER settings to capture profits. Switch to bullish or short trades.


Bitmex Bot 5m candlesThis script was made for our customers to test the strategies of our Bitmex Bot.
I'm not going to give you permission to use the Script, only if you become our client.
Telegram @rmgslash
Quantitative R-Difference Trading Strategy/SystemWorks extremely well with many stocks.
This strategy was tested on all components of the Dow since 1987. It averaged 22% a year. Slippage and commission were accounted for. 70% of the trades were profitable. The average maximum drawdown was around 15%.
This strategy has also been tested against random. The results indicate that this strategy's results are not due to random chance, but rather it has an edge in the stock market.
Does not repaint, and is not a curve fitted strategy.

Ergotic MACD Strategy [forked from HPotter]Ergotic MACD Strategy forked from HPotter
In addition to this fine script you will find some additional features:
- Backtester
- Alerts
- Filters: RSI, MFI, Price trend
- Trailing Stop Loss
- Other minor adjustments


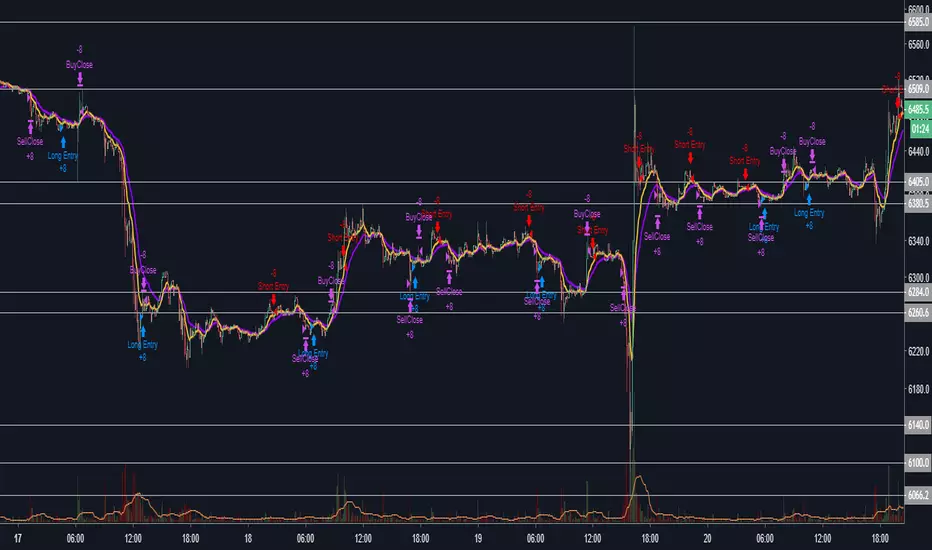
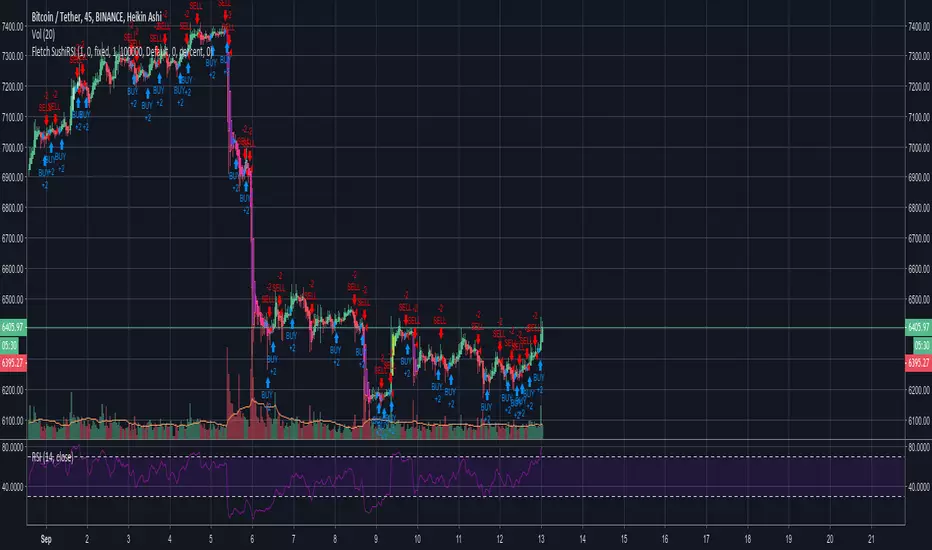
Hyper SushiRSIThis is a very frequent trading version of the Fletcher SushiRSI, targeted at BTC/USDT on the 45m timeframe using Heikin Ashi candle sticks.

BTCUSD - 4H - Cyatophilum Golden X - RSI [BACKTEST]This indicator is a custom combo of Ema crosses, RSI divergences and Support/resistance , engineered to make the most profit possible.
ABOUT THE STRATEGY
The Net Profit (Gross profit - Gross loss) is calculated with a commission of 0.05% on each order.
Each trade is made with 1 BTC : The backtest buys 1 BTC and sells 1 BTC.
If you decided to Short or Long, profits can be higher, but trade at your own risk.
To use this strategy on a ALT/BTC market (for trading altcoins), change the default Order Size from 1 Contract to 100% of Equity.
There are two kind of buy signals : Green and Blue triangles, that are two great Buy/Long entries.
There are also two kind of sell signals: Red and Orange triangles, that are two great Sell/Short entries.
The indicator comes with automatic Alerts that trigger on Green and Blue triangles for a Buy Alert, or that trigger on Red and Orange triangles for a Sell Alert.
If you are interested in purchasing the indicator and want to try it, then please leave a comment.
An alert setup indicator version is available on my profile.
-----------------------------------------------------------------------------------------
I am also available for PineScript Development and Reverse Engineering.
Join my discord:
discord.gg


TradeSpot Pro || Accompanying Strategy indicatorTradeSpot Pro
Overview
This script is an accompaniment to the existing TradeSpot Pro || All Purpose Advanced Trading Indicator
This script is for swing trading with longs, primarily on Binance / Kucoin / Coinbase and other crypto exchanes but is not limited to those markets. The details of what logic is behind the script can be found on the indicator version linked above.
Bags? This script has been tweaked and modified to completely destroy bear markets despite being focused on longs, see the BTCUSD image or PM me for any chart of your liking. I dislike indicators that show an amazing looking run in a bull market but in bear markets they fall apart - well with TradeSpot Pro that is not the case, it is completely market agnostic
Access
For details of access please join the TradeSpot community server where we can sort you out: discord.gg
Alternatively PM me if you would like to directly purchase the strategy and paired indicator.

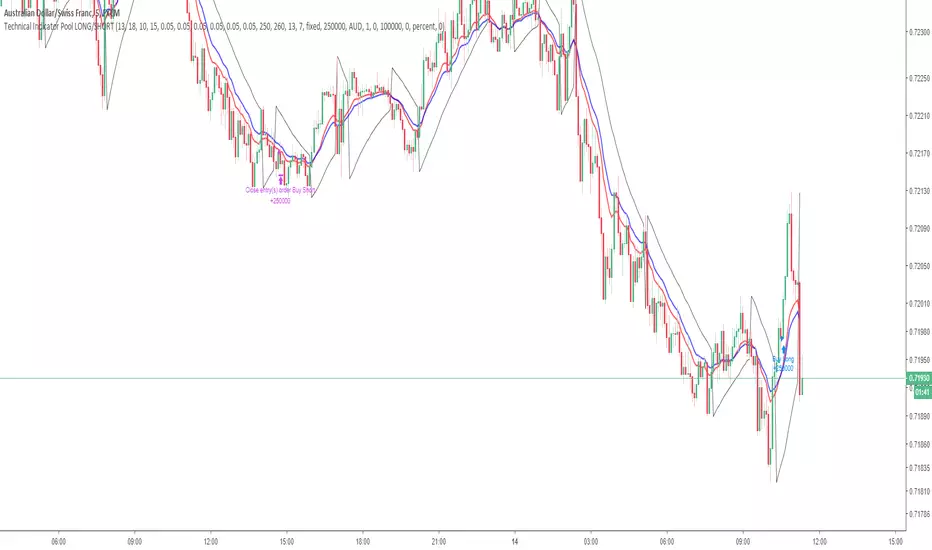
Technical Indicator PoolThis is for Bundle holders who want to use the Technical Indicator Pool for scalping binary options.
Understanding the Technical Indicator Pool
The Technical Indicator Pool is a strategy that operates on the premise that when many technical indicators project the same sentiment, they are concurrently more precise. The technical indicator pool contains five indicators
1. Small MACD Moving Average (SFMA) (10,15)
2. Large MACD Moving Average (LFMA) (13,18)
3. Parabolic Stop and Reverse (PSAR) (0.05, 0.05, 0.05)
4. Relative Strength Index (RSI) (14, 70, 30)
5. H/L Pivot (13)
When all five indicators project the same sentiment within a defined period (known as BarPeriod), an order is placed in the direction of sentiment.
Note:
Due to the nature of the indicator pool, such as the moving averages within the MACD and RSI as well as the High/Low Pivot, false positives may occur before the bar has closed within the time stamp.
This point of reference is to be used in combination with an arsenal of trading tools and should not be used as direct investment advice.
Option strategies should always include stop losses.
This strategy operates using a lot size of 2.5.