TradeSpot Pro || Accompanying Strategy indicatorTradeSpot Pro
Overview
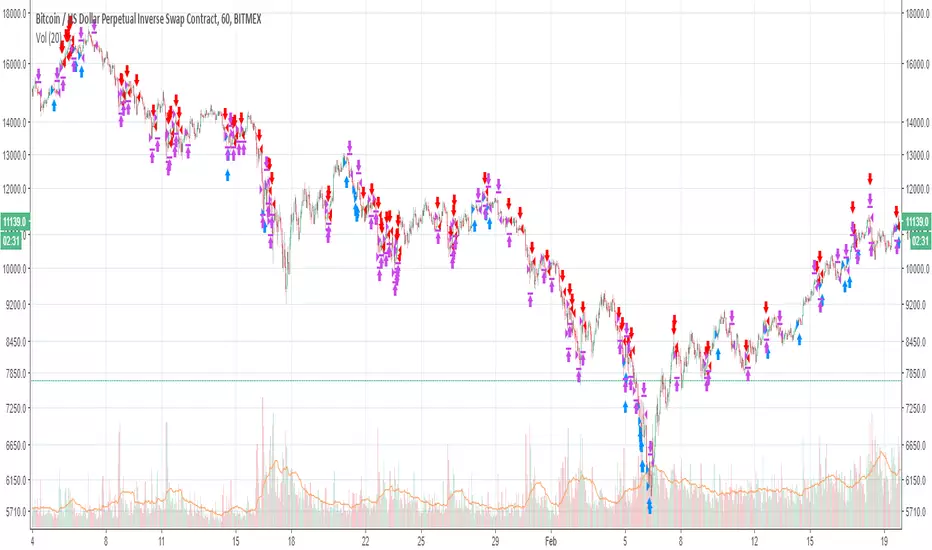
This script is an accompaniment to the existing TradeSpot Pro || All Purpose Advanced Trading Indicator
This script is for swing trading with longs, primarily on Binance / Kucoin / Coinbase and other crypto exchanes but is not limited to those markets. The details of what logic is behind the script can be found on the indicator version linked above.
Bags? This script has been tweaked and modified to completely destroy bear markets despite being focused on longs, see the BTCUSD image or PM me for any chart of your liking. I dislike indicators that show an amazing looking run in a bull market but in bear markets they fall apart - well with TradeSpot Pro that is not the case, it is completely market agnostic
Access
For details of access please join the TradeSpot community server where we can sort you out: discord.gg
Alternatively PM me if you would like to directly purchase the strategy and paired indicator.
Индекс относительной силы (RSI)

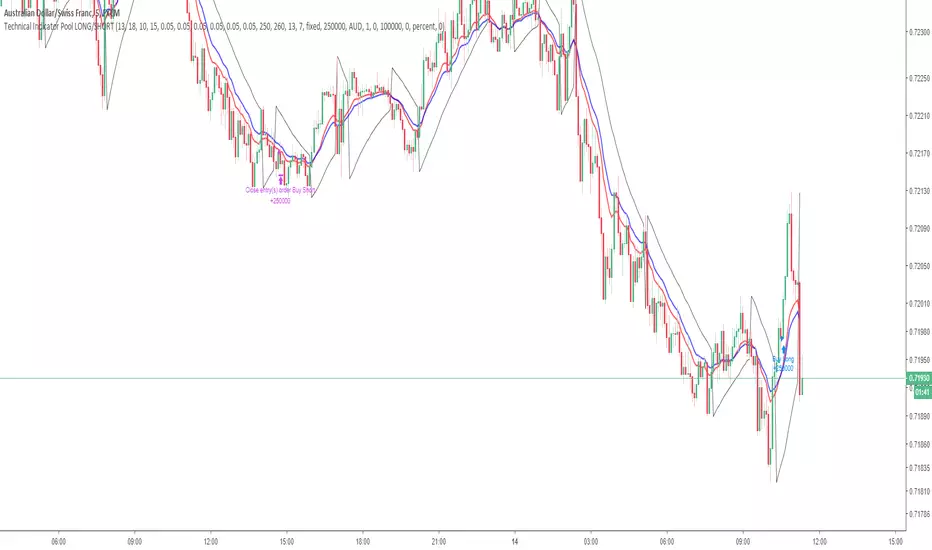
Technical Indicator PoolThis is for Bundle holders who want to use the Technical Indicator Pool for scalping binary options.
Understanding the Technical Indicator Pool
The Technical Indicator Pool is a strategy that operates on the premise that when many technical indicators project the same sentiment, they are concurrently more precise. The technical indicator pool contains five indicators
1. Small MACD Moving Average (SFMA) (10,15)
2. Large MACD Moving Average (LFMA) (13,18)
3. Parabolic Stop and Reverse (PSAR) (0.05, 0.05, 0.05)
4. Relative Strength Index (RSI) (14, 70, 30)
5. H/L Pivot (13)
When all five indicators project the same sentiment within a defined period (known as BarPeriod), an order is placed in the direction of sentiment.
Note:
Due to the nature of the indicator pool, such as the moving averages within the MACD and RSI as well as the High/Low Pivot, false positives may occur before the bar has closed within the time stamp.
This point of reference is to be used in combination with an arsenal of trading tools and should not be used as direct investment advice.
Option strategies should always include stop losses.
This strategy operates using a lot size of 2.5.
RSI vs Stochastic vs Stochastic RSITo compare each indicator's performance toggle between the various buy and sell methods while watching results in the Strategy Tester pane.
OSC = Oscillates between crossing the chosen Lo or Hi levels for either RSI or Stochastic/Stochastic RSI.
CROSS = When the Stochastic or Stochastic RSI k crosses d.
Outer gray band equals Stochastic/StochasticRSI range.
Inner gray band equals RSI range.
NOTICE: This script does not require access from me, simply open Indicators on chart and search for "RSI vs Stochastic vs Stochastic RSI". By accessing this script you acknowledge that you have read and understood that this is for research purposes only and I am not responsible for any financial losses you may incur by using this script!

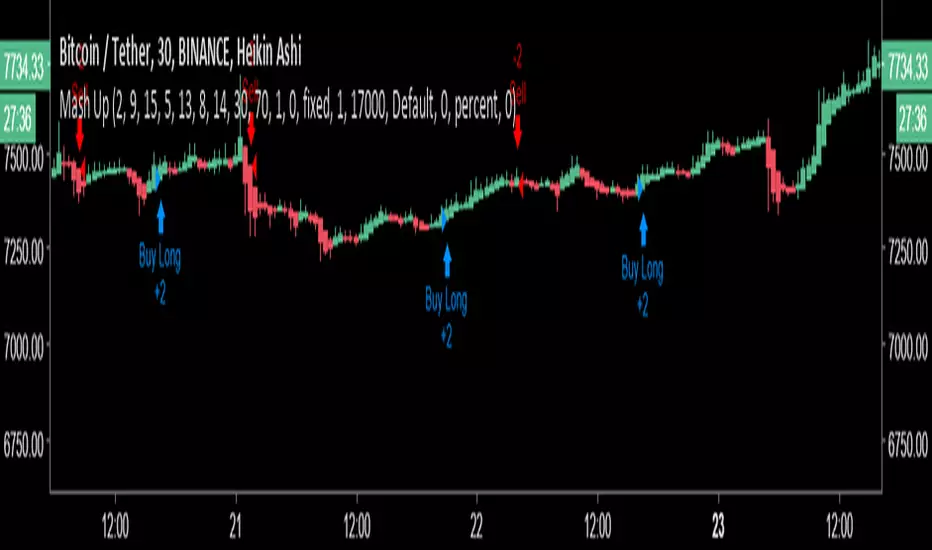
Money Flow AUD/USD 3 DayUsing money flow index combined with relative strength index to pick very close to the tops filtered with an EMA , all parameters can be adjusted to suit any time frame with some fine tuning , set up for a 3 day AUD/USD chart but will work with anything, decent win rate and profit factor, numbers used are enough initial capital to cover twice the amount of contracts, and works best with heikin Ashi chart .

Double strategy Uses a modified RSI strategy and a moving average strategy, it wont fire a buy or sell signal unless they match up best on heikin ashi or renko chart on most time frames, 1 for 1 contracts with enough initial capital to cover trades
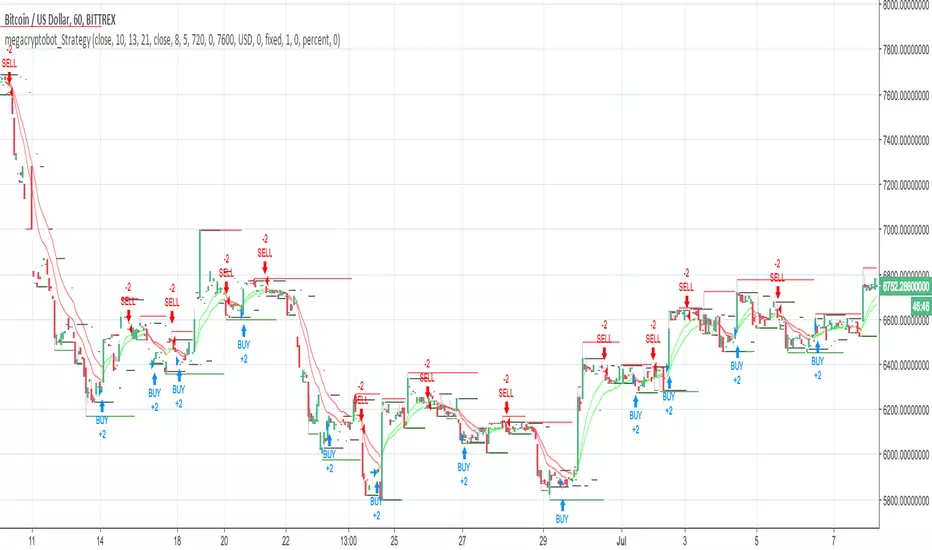
14/28 Day SMA Divergence and RSI - No RepaintIf you are interested in purchasing my algorithmic trading bot that receives Tradingview indicator alerts via email and then executes them in Bittrex, please visit my product page here: ilikestocks.com Additionally, I would love to create video/blog guides on creating Tradingview scripts or strategies. If you are a knowledgeable in finance or other related fields and would like to be featured on my page, please contact me at tanner@ilikestocks.com.
No crossovers were used in this script, and this is likely the reason for the no repaint(Correct me if wrong).
This strategy script uses a 14-day SMA signal line, a 28-day SMA and RSI. The strategy works by determining whether the (14-day SMA is above the 28-day SMA and the RSI levels are overbought(below 30)) or RSI is very overbought(below 13 or so). Once either of these conditions have been met, a long position is opened.
The initial long position must be partially closed by the take profit first and then the final close is executed if the 14-day signal SMA is below the 28-day SMA; you may also exclusively use take profit to close positions.
The green plotted spikes are the initial long position conditions. The orange plotted spikes are take profit signals once a long position is opened. The red plotted spikes are plotted when the SMA 14-day is below the 28-day SMA.
Please do leave constructive criticism or comments below because it helps me better create scripts!

Tryhard bitcoin V2 strategyNew version with better stop-loss handling.
You may configure Max Drawdown with leverage (more drawdown but more profit) or with stop-loss (less drawdown but less profit).
Backtest for 2017-2018 with x2 leverage for counter-trend strategy.
With 0.1% comission this strategy will give 400000% profit with 27% drawdown on same settings.
No repaints, no trailing stop, no security functions.
If you are intrested in source code, or in a bot with this strategy (i planning to write one), PM me.

Tryhard bitmex strategy - SMA+RSI, no repaint, no trailing stopBacktest for 2017-2018, with x1 leverage.
3MA for trend detection, fast RSI for counter-trend elements.
The strategy contains many parameters that are not optimal now, the results can be much better
Dane: RSI MACD StrategyRSI / MACD Divergence Strategy . Published for customer verification and acceptance. Unfortunately, access can only be provided to the customer.
For those interested in custom development services, please visit the backtest-rookies (.com) website for more information.
Features
RSI & Price divergence detection
Open a trade window when trade conditions are met
Enter the trade on confirmation
Stop losses / take profit custom levels based of daily pivot values

NGRN MACD-X & RSI v4 STRATEGYMACD-X, RSI & Volume Indicator Strategy - Version 4
Overview
This strategy and it's associated study were modeled after the famous Philakone described algorithms on his now defunct instructional video series.
This indicator allows for full customisation of parameters and interaction between three indicators that allow users to shape their trading methods to their desired goals. This associated strategy also allows users to backtest the study alerts script and find the best settings towards that end.
MACD + RSI + VOLUME - are of the most powerful and widely usded indicators, MACD/Histogram crosses, coupled with RSI & Volume increases/decreases will detects areas of deeply oversold / overbought and buys/sells on the reversal
Features
Full customisation - All parameters are open for customising to allow the trader to build their own strategy and adapt from market to market.
Clean/Simple UI - Facilitating ease of use.
Enable Buying OR Selling, - or have them both active at the same time.
Toggle off and on ALTERNATING Buy and Sell feature (pyramiding) - to allow for consecutive DCA style buys or SCALING out of an entry (partial sell).
Customizable Stop-Loss plot - to enable users to create a STOP-LOSS alert option or other alert(s) based on the plot location.
Toggle Auto Stop-Loss sell option - to enable users choose whether or not to automatically issue a sell signal when close crosses stop loss plot, or choose to toggle off if not profitable.
Customizable Take-Profit plot - to enable users to create a TAKE-PROFIT alert option or other alert(s) based on the plot location.
Study and associated Strategy - to use the TradingView ‘Strategy Tester’ back-testing features to find the best alert settings for specific coins in bear, bull and sideways markets.
Changes Version 4
Improved STOP-LOSS plot draw.
Added the option to automatically sell when stop-loss cross triggered or have the option disabled, in the event a better profit can be achieved.
Added new TAKE-PROFIT plot (aqua line) to visually guide users where to place the TAKE-PROFIT parameter as well as give users options to create alerts based on the TAKE-PROFIT plot.
Access
Full Access is 0.1 ETH , one time fee for LIFETIME access to the STUDY indicator, STRATEGY and future updates as well as support and SETTINGS for various markets on the Binance Exchange.
Settings
SCREENSHOT LINKS:
BUY SETTINGS: prntscr.com
SELL SETTINGS: prntscr.com

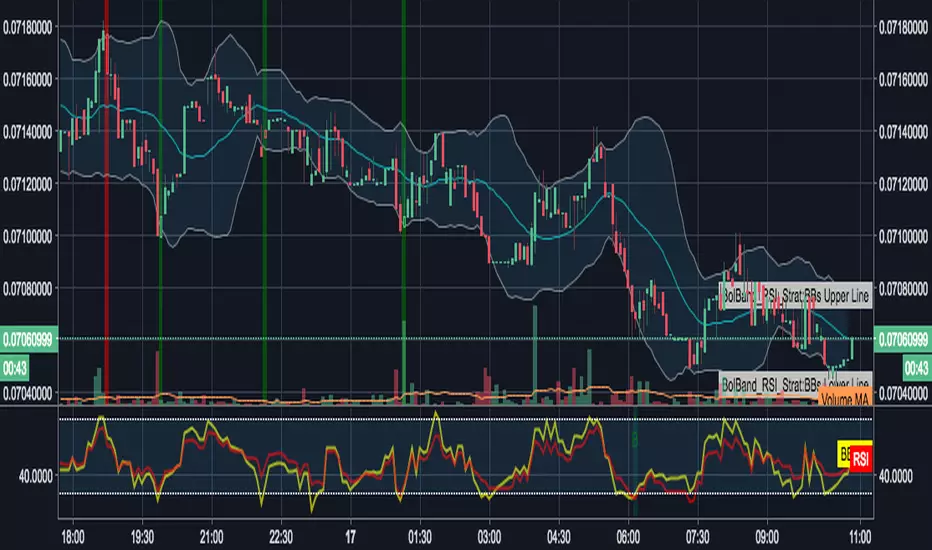
Bollinger Bands + RSI Double Strategy (by SlumdogTrader)
// SlumdogTrader's Bollinger Bands + RSI Double Strategy - Profit Trailer
//
// Version 1.0
// Script by SlumdogTrader on July Fri 13(!), 2018.
//
// This strategy uses a normalise Bollinger Bands + RSI.
//
// Bollinger Band triggers
// SELL - when the price is above the upper band.
// BUY - when the price is below the lower band.
//
// RSI triggers
// SELL - when the price is above 55.
// BUY - when the price is below 45.
//
// This simple strategy only triggers when
// both the BB and the RSI
// indicators, at the same time, are in
// a overbought or oversold condition.
//
// Visit my TradingView work at:
// www.tradingview.com
//
// Visit my website at:
// www.slumdogtrader.com
Silver Trading SignalNOTE 1: Only for S
NOTE 2: Only for timeframe : 30 Minute
Gold and Silver both trade the same way, opposite of DXY but silver fluctuations are higher and different from Gold. This script has been optimized for Silver only, not for gold.
How to trade:
Just see the signals for buy and sell on the chart.
Give your feedback after testing this strategy. :)

Script functionality test - work in progress (2RS + BB + MA)This is the first script I've written. Its sole purpose is to make me learn a bit of pine script. Its not intended to trade live.
Feel free to modify it if you wish and let me know if you do it. Also any comments are welcome!
Also i need help in two things:
1. Im unable to print the "in-strategy" rsi on chart
2. I want to ignore the first buy signal after each sell. I was looking to ad a counter to the signals but im unable to do it.
Any help will be greatly appreciated!

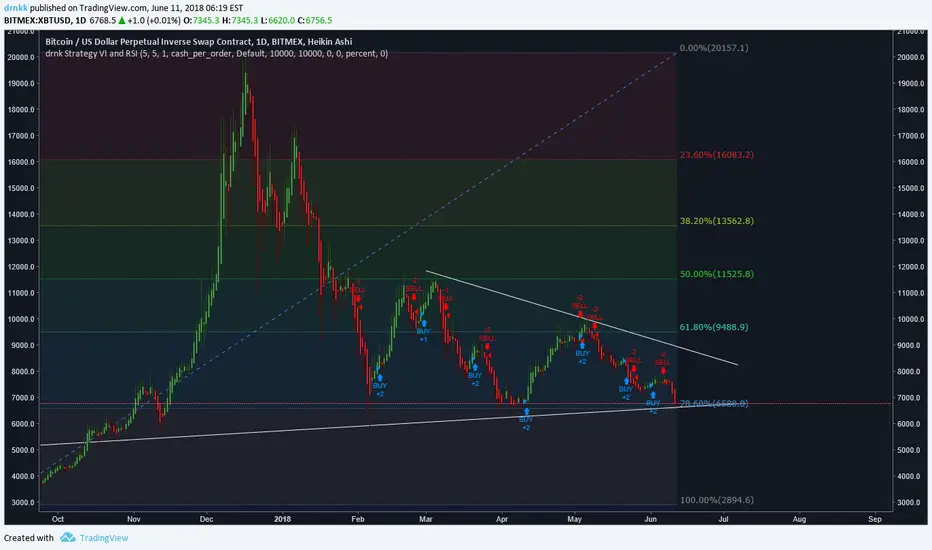
drnk Strategy VI and RSIStrategy based on a modified RSI and VI indicators. Best Results with heikin ashi representation.

drnkk StrategyStrategy based upon combination with, ROC of Vortex, modified RSI, modified Price ROC,
Bu da mı gol değil?

RSI Buy/sell signal with TP_SL_TL_15min by rajistaRSI Buy/sell signal with TakeProfit_Stop loss_Trailing_SL script -can be used on any altcoin/btc pair on the 15min chart .
This script can be used for backtesting pupose and also to give buy/sell signals based on the settings provided by you.
Benefits of the script:
1> Fully customizable script according to your trade setups.
2> The script incorporates Take-profit, Stop-loss & Trailing SL.
3> Cuts your losses significantly, in comparision to a script without TP, SL & TL strategies.
4> Based on RSI Overbought/Oversold levels, which can also be customizable.
5> Doesn't take too many trades in a day, thereby decreasing commission paid to exchanges & hence enhances the overall profit.
Here's how, you can fully customize the script, according to your strategy, once you have been provided access:
( To gain access to the script just hit the like/comment in the #tradingview published article & i'll grant access based on your tradingview userid )
You can add this script to your charts in 15min timeframe, like adding any other simple indicator.
Once you have added the script, just hit the settings button to fully customize the script according to your strategy and plan, that you have, for your trade setup.
Take profit, Stop loss, Trailing Stop loss values can be entered in satoshis from the setting panel.
RSI Overbought & Oversold values can also be entered according to your trading setup.
Like in below example , i have put the following values as default
Test date is set as 1 May 2018
Take profit=1000, stop loss=5, Trailing SL=40
RSI Overbought=70, Oversold=20
" Above mentioned values are default values and may not be profitable in every condition, you have to backtest the strategy by changing these values and then see the results of given values under the Strategy tester tab- located at bottom of your #tradingview chart. "
Lets see how the scipt is able to make these awesome gains:
Suppose your script enters a trade(buys Verge) when #Verge is at 800sats
Then the bot will close the trade(sell Verge) when either of these things happen:
a> Verge surges to 1800 sats, then the script will close trade by Taking profit
b>Verge increases to 850 only, but the RSI value in 15min chart has gone above 70 (Overbought-default value) then scipt will close trade.
c>Verge decreases to 995 sats, then script will close trade by Stop loss hit.
d>Verge surges to 840 but then again drops slightly to 835, script will again close trade by Trailing SL hit.
Initial capital is set to 10 btc
Make sure to check the performance summary tab below and overview of the script running on #XVGBTC since 1 May 2018-Till date
Profit -11.6% while running script
Where Buy and hold return for verge in the same period is:
- to get an instant notification, once i publish a script or a trading analysis/trade-setup , which will always be available for free for everyone!!!

EMAcrossover_RSI Buy/sell signal-TRXBTC_15min by rajista EMAcrossover_RSI Buy/sell signal Strategy
To be used in combination with Alerts script, both can be added to your tradingview charts (Chart time-frame should be set to 15min) like you add any other simple indicator.
Add this script to your favorites and once you have been granted access, you will be notified in your Tradingview notifications section, then you can go ahead and add these two scripts into your charts from your favorite section of Indicator menu in Tradingview.
Benefits of this strategy:
1> Fully automated buy/sell signals 24x7
2>Your trades will always be based on a certain entry and exit plan.
3>No emotions involved with these trading calls, so no chance of FOMO buying/Panic Sell
4>You can fully customize the settings with a simple click(customization details given below)
5>Its completely free of cost!!!
There are two parts of this automated trading call system:
1>Strategy script- Gives the buy/sell signals based on the settings provided.
2>Alert script- Gives Alert notifications in tradingview when a buy/sell call is made.
Principle of working is very simple to understand:
Stragey script makes:
Buy call - When the 9EMA crosses above the 21EMA or RSI level-20 is reached in 15min-Chart.
Sell call -When 9EMA crosses below the 21EMA or RSI level-70 is reached in 15min-Chart.
Above values of EMA's and RSI are default values , which can be changed easily in settings panel of Strategy script.
Alert Script allows you to add Alerts when these buy/sell calls are made.
To create a Buy call alert:
1> Click on the create alert icon in your chart (top-centre)
2>Click on Condition -drop down button and select EMAcross_rsi_Alerts
3>Below that bar you will see another bar titled "Buy"-click on its drop down menu and select "Crossing Down"
4>Below that bar right next to Value change 0 to 0.9.
5>Set expiration date for your alerts as per your wish
6>Ensure "Show Popup" and "Play sound" is checked
7>You can check option of sending the alert to your email also.
Finally click on create.
To create Sell Alert:
Repeat same process, except that, after step 2- Do this- change the "long" option to "short" by clicking on the drop down menu right next to the first bar.
Click on create, Finally both of your automated buy/sell call alerts will be configured.
I know its been 2-3 days since i tweeted about this strategy and now i am making it available, you can understand i had to put in a lot of working hours, towards creating the source code for the strategy script and then for alerts script and even more so towards finding the perfect default settings which can be used straight away by anyone, even if you are new in crypto trading, apart from the time which i dedicate to analyse charts and pass on the knowledge/info to you all.
My next post will be even more helpful to you people as i am currently testing "fully automated trading" yea you heard that right!! - This system will trade 24x7 for you guys/girls no matter wherever you are either you are sleeping or watching a movie, your trades would still be getting executed with a proper entery-exit plan on a crypto exchange.
The Falcon v2 Long only strategy Using Stop loss and take profitHello,
Here is a backtest result from the beginning of the year on BTC. The white line is the Buy & Hold return.
Comission is set to 0.05% and there is no repainting : the price variable I'm using is heikenashi(tickerid).
The indicator is built upon RSI, EMAs and some other personnal tricks so predict trends.
I coded a stop loss and take profit system : the script will simply buy and sell upon conditions.
As usual I am selling access to the script, If some are interested I will publish an alert setup version. I am also open to development or reverse engineering commissions.

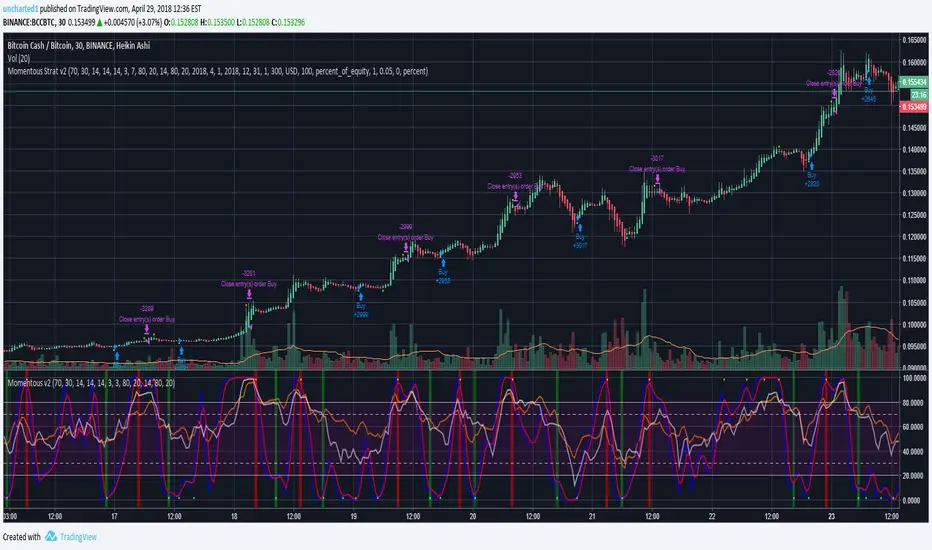
uncharted1 - Momentous Strat v2Strategy accompanying the study of the same name; uses RSI, StochRSI, and MFI indicators. Mix and match to find what you think could be the best entries and exits using these indicator combinations. All the switches are in the Inputs page so have fun with it. I created this primarily for crypto currencies and long positions. Perfect for users of AutoView. Backtest component by @pbergden included.
The Falcon - My BTC/USDT Strategy 5 min UTHello,
I made a custom indicator, I called it The Falcon because it reacts quickly and knows how to take perspective of the market.
This kind of indicator can be used for manual trading or bots.
About the indicator
In short, it will help you :
Make profit when the market is in trading range
Get in/Get out when a rally begins
Never go against the trend
I based my algorithm on several technical tools such as RSI , emas , for a total of 3 boolean conditions mixed together with AND and OR gates, resulting in those entry/exit points (arrows).
About the Strategy
I only used long entries and exits. No shorting.
It is tested on the last 18 days (the maximum TradingView allows for a 5 min range)
I set a 0.05% commission on each order.
I will grant access to people willing to make a small donation.
Here is my BTC address : 19sVQvCDmVfEACq7BiMnWSMqFPZ8qfSQ2K
If you prefer ETH : 0xc8a5d3a63a05db0c2363ea1c08b37a01cce9ebfb
Send me a Private Message with the ID of the transaction
If you want to do some forward testing first, send me a message.
This script comes with an Alert Setup.
I am also taking commissions if you want me to code something for you, or do some reverse engineering.
Also you can ask me anything in the comments.
Thanks and see you next time !

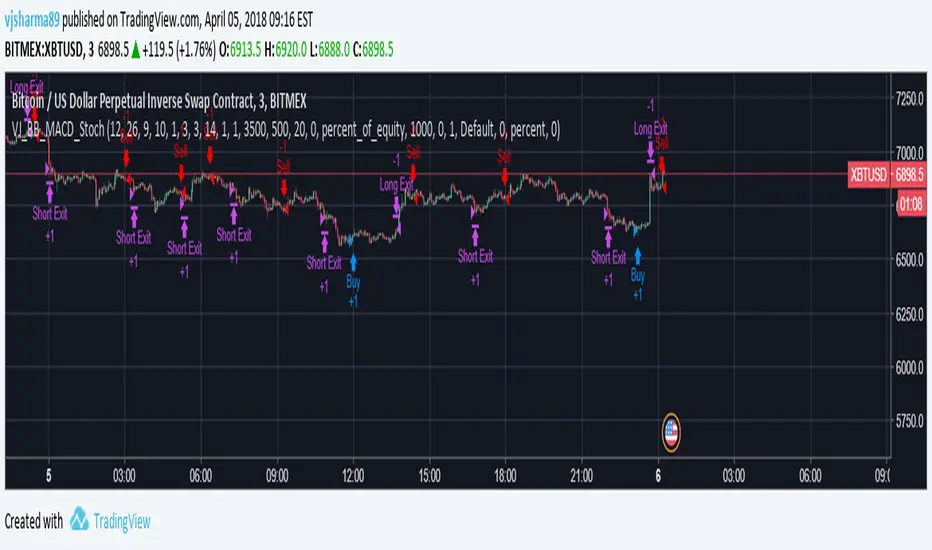
VJSHARMA_BB_MACD_Stoch_Short_Trade_Strategy_V2This script has the same working behind it except for some minor tweaks.
These tweaks enable the script to generate more signals than the previous version but with a loss of 4% accuracy.