COT Index & Positions by Novatrix CapitalThis indicator visualizes the positioning of the two main groups from the CFTC COT reports: Commercials and Retail (Non-Reportables / Small Traders). Each group is displayed in two ways:
Index (0–100) – normalized net positions to identify bullish or bearish extremes (standard cycle: 26 weeks, optionally 52 weeks).
Raw Net Positions – actual long minus short positions.
Color coding on the chart:
Commercial Index: Blue
Commercial Positions: Blue
Retail Index: Red
Retail Positions: Red
Additional features:
Reference lines for neutral, overbought, and oversold levels.
Helps traders analyze market sentiment and the positioning of major participant groups.
Important notice:
Since COT data is published only once per week and the COT Index is built on cyclical multi-week analysis, the indicator is intended to be used exclusively on the weekly timeframe.
The selected cycle length (typically 26 weeks, optionally 52 weeks) determines how net positions are compared and normalized, and can influence how quickly extreme zones appear in the index lines.
Retail

Retail Sentiment Indicator - Multi-Asset CFD & Fear/Greed IndexRetail Sentiment Indicator - Multi-Asset CFD & Fear/Greed Index
Overview
The Retail Sentiment Indicator provides real-time sentiment data for major financial instruments including stocks, forex, commodities, and cryptocurrencies. This indicator displays retail trader positioning and market sentiment using CFD data and fear/greed indices.
Methodology and Scale Calculation
This indicator operates on a **-50 to +50 scale** with zero representing perfect market equilibrium.
Scale Interpretation:
- **Zero (0)**: Market balance - exactly 50% of investors buying, 50% selling
- **Positive values**: Majority buying pressure
- Example: If 63% of investors are buying, the indicator shows +13 (63 - 50 = +13)
- **Negative values**: Majority selling pressure
- Example: If 92% of investors are selling, the indicator shows -42 (50 - 92 = -42)
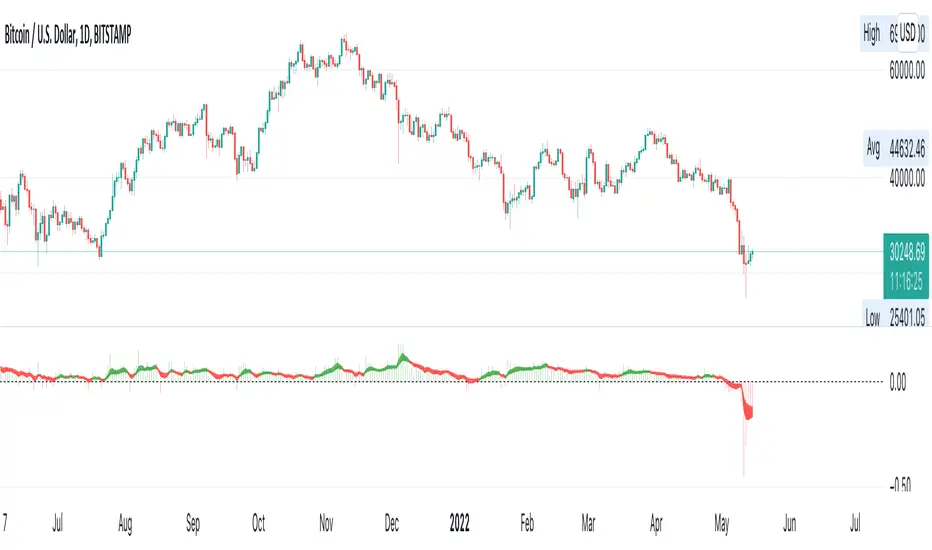
BTC Fear & Greed Index Scaling:
The original `BTC FEAR&GREED` index is natively scaled from 0-100 by its creator. In our indicator, this data has been rescaled to also fit the -50 to +50 range for consistency with other sentiment data sources.
This unified scaling approach allows for direct comparison across all instruments and data sources within the indicator.
-Important Data Source Selection-
Bitcoin (BTC) Data Sources
When viewing Bitcoin charts, the indicator offers **two different data sources**:
1. **Default Auto-Mode**: `BTCUSD Retail CFD` - Retail CFD traders sentiment data (automatically loaded).
2. **Manual Selection**: `BTC FEAR&GREED` - Fear & Greed Index from website: alternative dot me
**To access BTC Fear & Greed Index**: Input settings -> disable checkbox "Auto-load Sentiment Data" -> manually select "BTC FEAR&GREED" from the dropdown menu.
US Stock Market Data Sources
For US stocks and indices (S&P 500, NASDAQ, Dow Jones), there are **two data source options**:
1. **Default Auto-Mode**: Individual retail CFD sentiment data for each instrument
2. **Manual Selection**: `SNN FEAR&GREED` - SNN's Fear & Greed Index covering the overall US market sentiment. SNN was used as the name to avoid any potential trademark infringement.
**To access SNN Fear & Greed Index**: When viewing US market charts, disable in input settings checkbox "Auto-load Sentiment Data" and manually select "SNN FEAR&GREED" from the dropdown menu.
This distinction allows traders to choose between **instrument-specific retail sentiment** (auto-mode) or **broader market sentiment indices** (manual selection).
Features
- **Auto-Detection**: Automatically loads sentiment data based on the current chart symbol
- **Manual Selection**: Choose from 40+ supported instruments when auto-detection is unavailable
- **Multiple Data Sources**: Combines retail CFD sentiment with Fear & Greed indices
- **Visual Zones**: Clear greed/fear zones with color-coded backgrounds
- **Real-time Updates**: Live sentiment data from merged data sources
Supported Instruments
Major Indices
- S&P 500, NASDAQ, Dow Jones 30, DAX
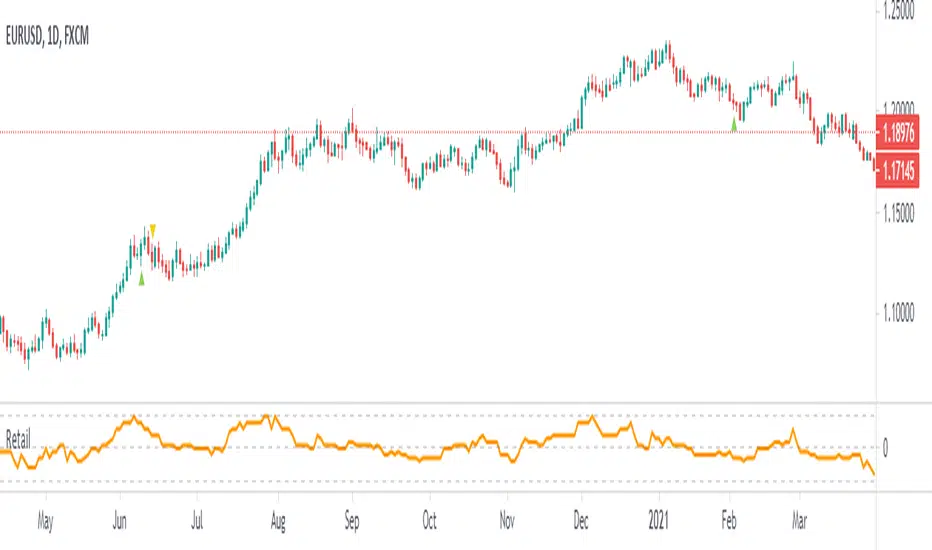
Forex Pairs
- Major pairs: EURUSD, GBPUSD, USDJPY, USDCHF, USDCAD
- Cross pairs: EURJPY, GBPJPY, AUDUSD, NZDUSD, and 20+ others
Commodities
- Precious metals: Gold (XAUUSD), Silver (XAGUSD)
- Energy: WTI Oil
- Agricultural: Wheat, Coffee
- Industrial: Copper
Cryptocurrencies
- Bitcoin (BTC) sentiment data
- BTC & SNN Fear & Greed indices
How to Use
1. **Auto Mode** (Default): Enable "Auto-load Sentiment Data" to automatically display sentiment for the current chart symbol
2. **Manual Mode**: Disable auto-load and select from the dropdown menu for specific instruments
3. **Interpretation**:
- Values above 0 (green) indicate retail greed/bullish sentiment
- Values below 0 (red) indicate retail fear/bearish sentiment
- Fear & Greed indices use 0-100 scale (50 is neutral)
Data Sources
This indicator uses curated sentiment data from retail CFD providers and established fear/greed indices. Data is updated regularly and sourced from reputable financial data providers.
Trading Strategy & Market Philosophy
Contrarian Trading Approach
The primary purpose of this indicator is based on the fundamental market principle that **the majority of retail investors are often wrong**, and markets typically move opposite to the positions held by the majority of market participants.
Key Strategy Guidelines:
- **Contrarian Signal**: When the majority of users are positioned on one side of the market, there is statistically greater market advantage in taking positions in the opposite direction
- **Trend Exhaustion Signal**: An interesting observed phenomenon occurs when, during a long-lasting trend where the majority of investors have consistently been on the wrong side, the Sentiment indicator suddenly shows that the majority has flipped and opened positions in the direction of that long-running trend. This is often a signal of fuel exhaustion for further movement in that direction
Interpretation Examples
- High greed readings (majority bullish) → Consider bearish opportunities
- High fear readings (majority bearish) → Consider bullish opportunities
- Sudden sentiment flip during established trends → Potential trend reversal signal
Technical Notes
- Built with PineScript v6
- Dynamic symbol detection with fallback options
- Optimized for performance with minimal resource usage
- Color-coded visualization with customizable zones
Data Sources & Expansion
Acknowledgments
We extend our gratitude to **TradingView** for enabling the use of custom data feeds based on GitHub repositories, making this comprehensive sentiment analysis possible.
Data Expansion Opportunities
As the operator of this indicator, I am **open to suggestions for new data sources** that could be integrated and published. If you have ideas for additional instruments or sentiment data:
How to Submit Suggestions:
1. Send a **private message** with your proposal
2. Include: **instrument/data type**, **source**, and **brief description**
3. If technically feasible, we will work to import and publish the data
Data Infrastructure Status
Current Data Upload Process:
Please note that sentiment data uploads may occasionally experience minor interruptions. However, this should not pose significant issues as sentiment data typically changes gradually rather than rapidly.
Infrastructure Development:
We are actively working on establishing permanent cloud-based infrastructure to ensure continuous, automated data collection and upload processes. This will provide more reliable and consistent data availability in the future.
Disclaimer
This indicator is for educational and informational purposes only. Sentiment data should be used as part of a comprehensive trading strategy and not as the sole basis for trading decisions. Past performance does not guarantee future results. The contrarian approach described is a market theory and may not always produce profitable results.

COT-Index-NocTradingCOT Index Indicator
The COT Index Indicator is a powerful tool designed to visualize the Commitment of Traders (COT) data and offer insights into market sentiment. The COT Index is a measurement of the relative positioning of commercial traders versus non-commercial and retail traders in the futures market. It is widely used to identify potential market reversals by observing the extremes in trader positioning.
Customizable Timeframe: The indicator allows you to choose a custom time interval (in months) to visualize the COT data, making it flexible to fit different trading styles and strategies.
How to Use:
Visualize Market Sentiment: A COT Index near extremes (close to 0 or 100) can indicate potential turning points in the market, as it reflects extreme positioning of different market participant groups.
Adjust the Time Interval: The ability to adjust the time interval (in months) gives traders the flexibility to analyze the market over different periods, which can be useful in detecting longer-term trends or short-term shifts in sentiment.
Combine with Other Indicators: To enhance your analysis, combine the COT Index with your technical analysis.
This tool can serve as an invaluable addition to your trading strategy, providing a deeper understanding of the market dynamics and the positioning of major market participants.

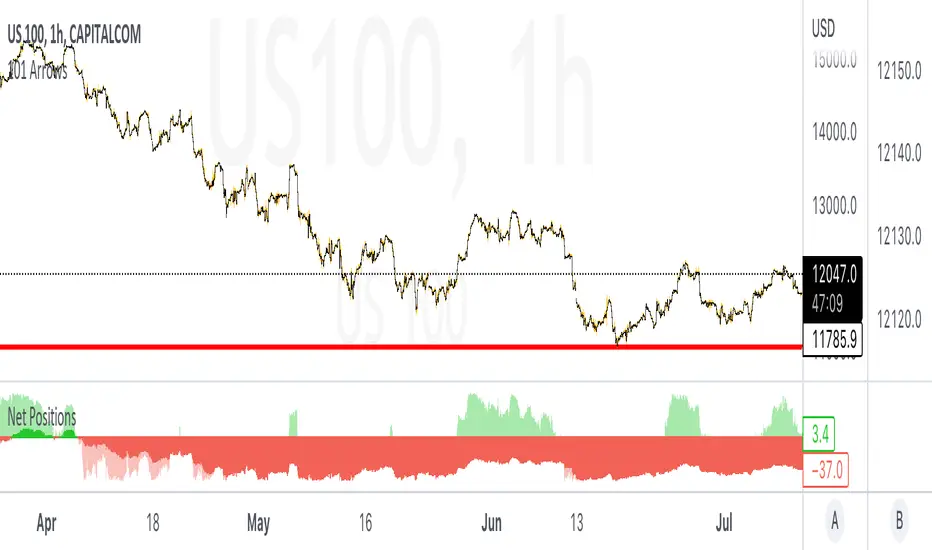
Retail & Banker Net PositionsIn any market there are two major sets of participants, Retail traders (like you & I) who command relatively small amounts of capital and typically enter and exits positions quickly, and then Institutional Traders (sometimes referred to as whales) who command large amounts of capital and dictate the overall trend of the market but enter and exit positions slowly.
In this indicator we look at the distinct volume of these two sets of traders and use the net positions of this volume to determine if they are net long (Buying) in the market or net short (Selling).
When each set of traders are on opposite sides of the market (Retail are selling & Institutions are buying for example) it usually results in a battle and choppy price action... the majority of these battles are won by the Institutions as their large sums of money dictate the overall direction markets move.
Some of the best opportunities are when both sets of traders are on the same side of the market & this is where we see real momentum enter the market with quick price moves.
Happy trading =)
BTC Coinbase Premium TrendBTC Coinbase (institutional trader) vs. Binance (retail trader) Premium
Positive values: Coinbase trading at a premium (institutions more bullish than retail)
Negative values: Coinbase trading at a discount (institutions more bearish than retail)
Retail PositioningThis script tries to estimate how inclined may retail traders be to open a position based on popular indicators RSI, Stochastic, Ichimoku, Bollinger Bands, MACD, and 200 EMA. Conditions are:
Plus values
• RSI above 70
• %K above 70 or even
• Conversion line above baseline and price above the cloud
• High above the upper band
• MACD above the signal line
Each condition gives 1 point if true or 2 points if it is also above 200 EMA
Minus values
• RSI below 30
• %K below 30 or even
• Conversion line below baseline and price below the cloud
• Low below the upper band
• MACD below the signal line
Each condition gives -1 point if true or -2 points if it is also below 200 EMA
I still consider the script as in development, so if you have some ideas on how it could be improved or traded, let me know.
BitMEX Funding Visual by Mcrypt28This is a modified script originating from user m59 that better visually represents the BitMEX funding trend over time. Green indicates the funding is positive (longs pay shorts every 8 hours to maintain their position) and red indicates the funding is negative (shorts pay longs). The darker the color means the higher the rate. The unproven theory is that the funding helps to identify what retail investors are doing at a given time. Thus, in downtrends as the negative funding is drying up, a low may be near. In uptrends, as the funding remains negative, retail is generally bearish and continues to sell as institutional investors likely are absorbing. Vice versa for when the funding is positive. In any market in general, money flows from the many to the few. That means whatever retail is doing is generally the opposite of what will be the actual outcome. One more modifier to the m59 script is that volume is factored into the calculation which will impact which threshold (opacity on the chart) it falls within.
If you'd like to chart the BitMEX funding yourself, I'd recommend checking out the source from m59's indicator as that is more likely to stay up to date if BitMEX makes any changes to the way funding is calculated. The source if this is protected for that reason.
