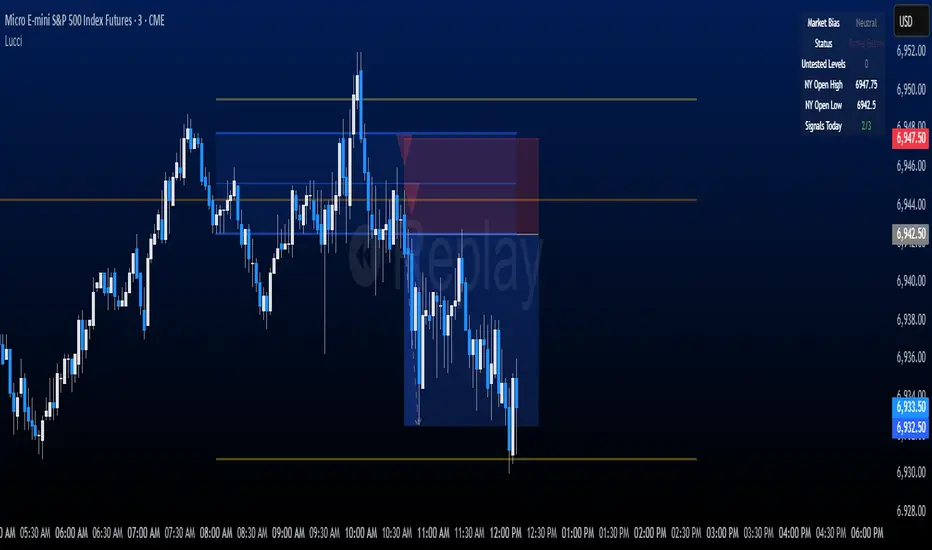
LucciThis indicator identifies trade setups based on session liquidity levels and price structure analysis during New York trading sessions.
Unlike basic support/resistance indicators, this system tracks untested session extremes and monitors their interaction with price. It combines break-and-retest mechanics with bounce detection at key liquidity zones, providing multiple entry methodologies within a single framework.
METHODOLOGY:
The system maps high/low points from each trading session (Asia: 6PM-3AM, London: 3AM-8AM, NY: 8AM-5PM EST) and monitors price behavior around these levels. It identifies two primary setup types: momentum continuation after level breaks and reversal bounces at untested extremes. Visual differentiation shows which levels remain untested (darker) versus swept levels (lighter).
SETUP IDENTIFICATION:
Break & Retest Signals:
- Detects breaks of NY Open range (15-minute candle at 8:00 AM EST)
- Waits minimum bars after break before validating retest
- Triggers when price returns to level within tolerance zone
Bounce Signals:
- Identifies approaches to untested session highs/lows
- Optional wick confirmation for reversal validation
- Signals when price rejects from liquidity zone
CONFIGURATION OPTIONS:
Entry Parameters:
- Min Bars After Break: 1-10 (delay before retest valid)
- Retest Tolerance: 0.1-10 points (precision of level test)
- Bounce Zone: 0.5-5 points (distance from level)
- Wick Confirmation: On/off reversal filter
Risk Management:
- Risk Reward Options: 1:3, 1:5, or Custom (1:1 to 1:10)
- Stop Loss: Configurable in points
- Max Daily Signals: 1-5 trade limiter
- Trading Hours: Customizable active window
Visual Elements:
- Session Levels: Orange (Asian), Yellow (London), Blue (NY)
- Signal Markers: Triangles (B&R), Diamonds (Bounce)
- TP/SL Lines: Automatic calculation and display
- Info Table: Shows bias, untested levels, daily signals
OPTIMAL USAGE:
Trading Windows:
- 9:30-11:00 AM EST: Primary trading window
- First touch of untested levels: Highest probability
- 15-minute timeframe: Recommended for futures
- Volume filter: Optional quality enhancement
Signal Prioritization:
- Untested levels provide stronger reactions
- Multiple confirmations increase probability
- Respect market structure and session context
- Combine with volume for filtering
TECHNICAL SPECIFICATIONS:
- Multi-timeframe: Uses 15-minute data for NY Open
- Session-based: Resets levels at session transitions
- Alert system: Detailed messages with levels
- Position tracking: Manages active trades visually
IMPORTANT NOTES:
This tool maps liquidity zones based on session extremes and price structure. No trading system guarantees profits. Combine with market context and proper risk management. Designed for active intraday trading on liquid instruments.
The indicator provides objective level identification while requiring trader discretion for optimal results.
Retest
Specter Trend Cloud [ChartPrime]⯁ OVERVIEW
Specter Trend Cloud is a flexible moving-average–based trend tool that builds a colored “cloud” around market direction and highlights key retest opportunities. Using two adaptive MAs (short vs. long), offset by ATR for volatility adjustment, it shades the background with a gradient cloud that switches color on trend flips. When price pulls back to retest the short MA during an active trend, the script plots diamond markers and extends dotted levels from that retest price. If price later breaks through that level, the extension is terminated—giving traders a clean visual of valid vs. invalid retests.
⯁ KEY FEATURES
Multi-MA Core Engine:
Choose from SMA, EMA, SMMA (RMA), WMA, or VWMA as the base. The indicator tracks both a short-term MA (Length) and a longer twin (2 × Length).
Volatility-Adjusted Offset:
Both MAs are shifted by ATR(200) depending on trend direction—pulling them down in uptrends, up in downtrends—so the cloud reflects realistic breathing room instead of razor-thin bands.
Gradient Trend Cloud:
Between the two shifted MAs, the script fills a shaded region:
• Aqua cloud = bullish trend
• Orange cloud = bearish trend
Gradient intensity increases toward the active edge, providing a visual sense of strength.
Trend Flip Logic:
A flip occurs whenever the short MA crosses above or below the long MA. The cloud instantly changes color and begins tracking the new regime.
Retest Detection:
During an ongoing trend (no flip), if price retests the short MA within a 5-bar “cooldown,” the tool:
• Marks the retest with diamond shapes below/above the bar.
• Draws a dotted horizontal line from the retest price, extending into the future.
Automatic Level Termination:
If price later closes through that dotted level, the line disappears—keeping only active, respected retest levels on your chart.
⯁ HOW IT WORKS (UNDER THE HOOD)
MA Calculations:
ma1 = MA(src, Length), ma2 = MA(src, 2 × Length).
Trend = ma1 > ma2 (bull) or ma1 < ma2 (bear).
ATR shift offsets both ma1 and ma2 by ±ATR depending on trend.
Cloud Fill:
Plots ma1 and ma2 (invisible for long MA). Uses fill() with semi-transparent aqua/orange gradient between the two.
Retest Logic:
• Bullish retest: ta.crossover(low, ma1) while trend = bull.
• Bearish retest: ta.crossunder(high, ma1) while trend = bear.
Only valid if at least 5 bars have passed since last retest.
When triggered, it stores bar index and price, draws diamonds, and extends a dotted line.
Level Clearing:
If current high > retest upper line (bearish case) or low < retest lower line (bullish case), that line is deleted (stops extending).
⯁ USAGE
Use the cloud color as the higher-level trend bias (aqua = long, orange = short).
Look for diamonds + dotted lines as pullback/retest zones where trend continuation may launch.
If a retest level holds and price rebounds, it strengthens confidence in the trend.
If a retest level is broken, treat it as a warning of weakening trend or possible reversal.
Experiment with MA Type (SMA vs. EMA, etc.) to align sensitivity with your asset or timeframe.
Adjust Length for faster flips on low timeframes or smoother signals on higher ones.
⯁ CONCLUSION
Specter Trend Cloud combines trend detection, volatility-adjusted shading, and retest visualization into a single tool. The gradient cloud provides instant clarity on direction, while diamonds and dotted retest levels give you tactical entry/retest zones that self-clean when invalidated. It’s a versatile trend-following and confirmation layer, adaptable across multiple assets and styles.

RSI Shift Zone [ChartPrime]OVERVIEW
RSI Shift Zone is a sentiment-shift detection tool that bridges momentum and price action. It plots dynamic channel zones directly on the price chart whenever the RSI crosses above or below critical thresholds (default: 70 for overbought, 30 for oversold). These plotted zones reveal where market sentiment likely flipped, helping traders pinpoint powerful support/resistance clusters and breakout opportunities in real time.
⯁ HOW IT WORKS
When the RSI crosses either the upper or lower level:
A new Shift Zone channel is instantly formed.
The channel’s boundaries anchor to the high and low of the candle at the moment of crossing.
A mid-line (average of high and low) is plotted for easy visual reference.
The channel remains visible on the chart for at least a user-defined minimum number of bars (default: 15) to ensure only meaningful shifts are highlighted.
The channel is color-coded to reflect bullish or bearish sentiment, adapting dynamically based on whether the RSI breached the upper or lower level. Labels with actual RSI values can also be shown inside the zone for added context.
⯁ KEY TECHNICAL DETAILS
Uses a standard RSI calculation (default length: 14).
Detects crossovers above the upper level (trend strength) and crossunders below the lower level (oversold exhaustion).
Applies the channel visually on the main chart , rather than only in the indicator pane — giving traders a precise map of where sentiment shifts have historically triggered price reactions.
Auto-clears the zone when the minimum bar length is satisfied and a new shift is detected.
⯁ USAGE
Traders can use these RSI Shift Zones as powerful tactical levels:
Treat the channel’s high/low boundaries as dynamic breakout lines — watch for candles closing beyond them to confirm fresh trend continuation.
Use the midline as an equilibrium reference for pullbacks within the zone.
Visual RSI value labels offer quick checks on whether the zone formed due to extreme overbought or oversold conditions.
CONCLUSION
RSI Shift Zone transforms a simple RSI threshold crossing into a meaningful structural tool by projecting sentiment flips directly onto the price chart. This empowers traders to see where momentum-based turning points occur and leverage those levels for breakout plays, reversals, or high-confidence support/resistance zones — all in one glance.

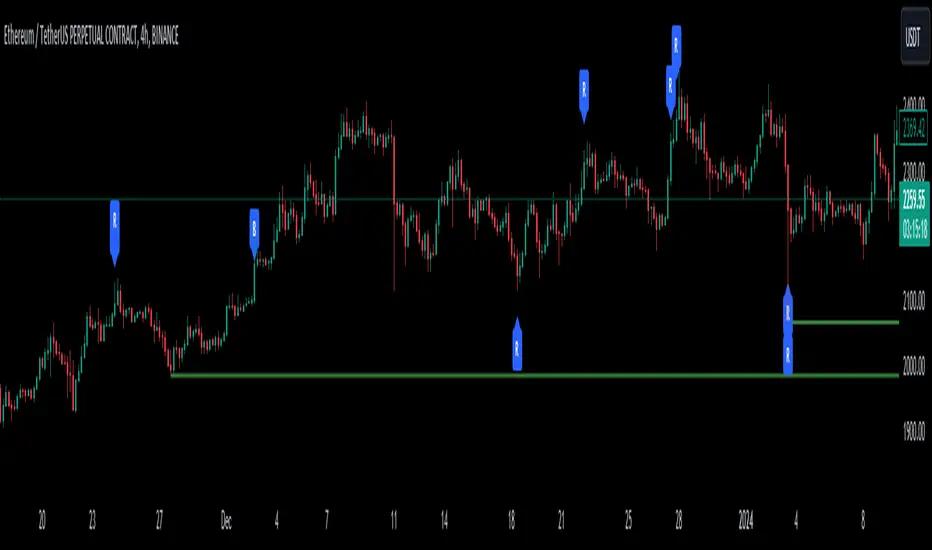
Support and Resistance Logistic Regression | Flux Charts💎 GENERAL OVERVIEW
Introducing our new Logistic Regression Support / Resistance indicator! This tool leverages advanced statistical modeling "Logistic Regressions" to identify and project key price levels where the market is likely to find support or resistance. For more information about the process, please check the "HOW DOES IT WORK ?" section.
Logistic Regression Support / Resistance Features :
Intelligent S/R Identification : The indicator uses a logistic regression model to intelligently identify and plot significant support and resistance levels.
Predictive Probability : Each identified level comes with a calculated probability, indicating how likely it is to act as a true support or resistance based on historical data.
Retest & Break Labels : The indicator clearly marks on your chart when a detected support or resistance level is retested (price touches and respects the level) or broken (price decisively crosses through the level).
Alerts : Real-time alerts for support retests, resistance retests, support breaks, and resistance breaks.
Customizable : You can change support & resistance line style, width and colors.
🚩 UNIQUENESS
What makes this indicator truly unique is its application of logistic regression to the concept of support and resistance. Instead of merely identifying historical highs and lows, our indicator uses a statistical model to predict the future efficacy of these levels. It analyzes underlying market conditions (like RSI and body size at pivot formation) to assign a probability to each potential S/R zone. This predictive insight, combined with dynamic, real-time labeling of retests and breaks, provides a more robust and adaptive understanding of market structure than traditional, purely historical methods.
📌HOW DOES IT WORK ?
The Logistic Regression Support / Resistance indicator operates in several key steps:
First, it identifies significant pivot highs and lows on the chart based on a user-defined "Pivot Length." These pivots are potential areas of support or resistance.
For each detected pivot, the indicator extracts relevant market data at that specific point, including the RSI (Relative Strength Index) and the Body Size (the absolute difference between the open and close price of the candle). These serve as input features for the model.
The core of the indicator lies in its logistic regression model. This model is continuously trained on past pivot data and their subsequent behavior (i.e., whether they were "respected" as support/resistance multiple times). It learns the relationship between the extracted features (RSI, Body Size) and the likelihood of a pivot becoming a significant S/R level.
When a new pivot is identified, the model uses its learned insights to calculate a prediction value—a probability (from 0 to 1) that this specific pivot will act as a strong support or resistance.
If the calculated probability exceeds a user-defined "Probability Threshold," the pivot is designated a "Regression Pivot" and drawn on the chart as a support or resistance line. The indicator then actively tracks how price interacts with these levels, displaying "R" labels for retests when the price bounces off the level and "B" labels for breaks when the price closes beyond it.
⚙️ SETTINGS
1. General Configuration
Pivot Length: This setting defines the number of bars used to determine a significant high or low for pivot detection.
Target Respects: This input specifies how many times a level must be "respected" by price action for it to be considered a strong support or resistance level by the underlying model.
Probability Threshold: This is the minimum probability output from the logistic regression model for a detected pivot to be considered a valid support or resistance level and be plotted on the chart.
2. Style
Show Prediction Labels: Enable or disable labels that display the calculated probability of a newly identified regression S/R level.
Show Retests: Toggle the visibility of "R" labels on the chart, which mark instances where price has retested a support or resistance level.
Show Breaks: Toggle the visibility of "B" labels on the chart, which mark instances where price has broken through a support or resistance level.

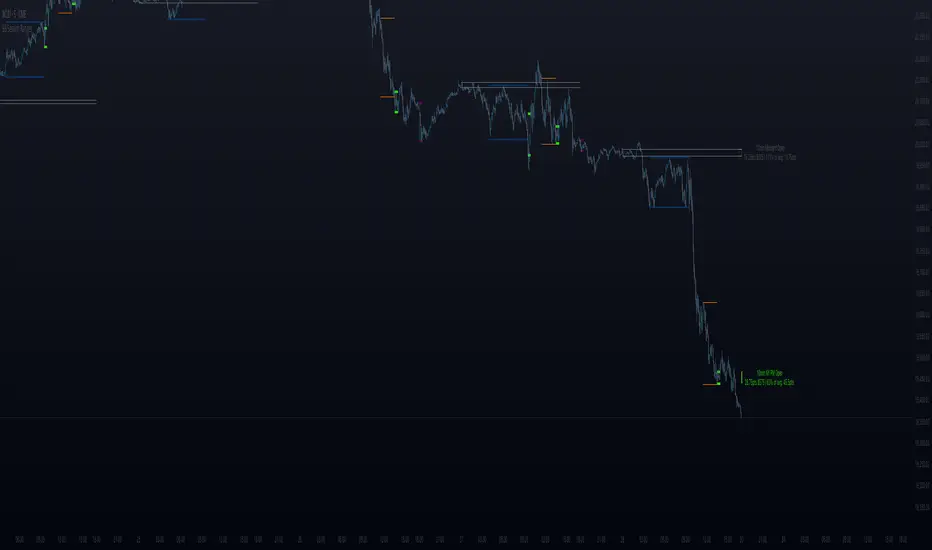
BB Session RangesBB Session Ranges Indicator
Overview
The Bender Bot Session Ranges indicator is a powerful tool for traders who want to visualize and analyze important market sessions throughout the trading day. This indicator identifies and tracks price ranges during specific time periods, helping you spot potential trading opportunities based on session breakouts, retests, and range comparisons.
Key Features
• Multiple Session Tracking: Monitor up to 6 different time-based ranges simultaneously (pre-configured for NY AM Open, NY PM Open, Lunch, Premarket, Midnight Open, and a custom session).
• Range Visualization: Clearly displays high and low boundaries for each session with customizable colors and line styles.
• Historical Comparison: Tracks and displays the average size of ranges over time, helping you identify when current ranges are larger or smaller than typical.
• Flexible Time Settings: Easily configure exact session times based on your trading schedule and preferred markets.
• Range Extension Options: Extend range boundaries by bars, days, or weeks to track the longer-term influence of session ranges.
• Sidecar Information Display: Optional labels show range details, including size, percentage of average, and dollar value.
How It Works
The indicator identifies specific time-based sessions (for example, the first 5 minutes of the NY market open) and tracks the high and low prices established during these periods. Once a session is complete, the range boundaries are plotted on your chart and can be extended for further analysis. The indicator calculates the current range size and compares it to historical averages, giving you context for the day’s market behavior.
Sidecar Functionality
The sidecar feature is a key aspect of this indicator that helps keep your charts clean and organized. Instead of cluttering your price action with labels and annotations directly on the ranges, the sidecar system:
• Creates a dedicated information panel offset from the price action.
• Connects to ranges with discreet connecting lines.
• Displays key statistics like range size, dollar value, and percentage of average.
• Can be positioned at custom distances from the main chart (measured in bars).
• Allows you to see important data without interfering with your price analysis.
• Can be completely disabled when you prefer minimal chart elements.
• Helps maintain visual clarity even when tracking multiple sessions simultaneously.
This design philosophy puts trader experience first by separating information display from price action analysis, giving you the best of both worlds: clean charts and detailed information.
Setup Guide
1. Choose Your Sessions: Enable or disable each of the six available ranges by setting the Max Ranges to Plot parameter (use 0 to disable a range).
2. Configure Session Times: Set exact times for each range using standard 24-hour format (for example, 0930-0935 for 9:30-9:35 AM).
3. Customize Display: Select colors, line widths, and information display options for each range.
4. Set Extension Parameters: Choose how far to extend range lines (by a number of bars, days, or weeks, or select Always for continuous extension).
5. Configure Sidecar Labels: Set the offset for the information displays (use 0 to disable sidecar labels entirely).
Trading Applications
• Identify potential support and resistance levels based on session highs and lows.
• Compare current session ranges to historical averages to gauge volatility.
• Look for breakouts from established session ranges.
• Use range extensions to anticipate potential price targets.
• Monitor multiple session ranges to identify pattern correlations.
Advanced Usage
The indicator includes fields that help you assess range size relative to past performance, including dollar value calculations. This can be particularly useful for position sizing and risk management when trading breakouts from these ranges.
Future Development
We’re actively working on expanding this indicator to include robust strategy and alert functionality. This will allow traders to:
• Backtest trading strategies based on session range breakouts and retests.
• Customize entry, exit, and risk management parameters.
• Receive real-time alerts when price interacts with significant range levels.
• Set conditional alerts based on range size compared to historical averages.
• Automate trading decisions based on your specific session-based criteria.
If these strategy and alert features would be valuable for your trading, please let us know in the comments. Your feedback directly influences our development priorities and helps us create tools that best serve the trading community.
Notes
• All times are based on the America/New_York timezone.
• The indicator dynamically adjusts to different timeframes, providing consistent results whether you’re viewing 1-minute or daily charts.
• Range calculations are based on the highs and lows established during the defined sessions.
Breakout and Retest Signals [AlgoAlpha]OVERVIEW
This script detects breakout and retest signals by identifying key pivot points in price action and analyzing their relationship with historical swing highs and lows. It highlights breakout structures using ATR-based tolerance levels and volume analysis to confirm potential trend continuations or reversals. The script marks significant price levels with dynamic boxes and dashed lines to help traders visualize breakout and retest areas effectively.
CONCEPTS
The script relies on pivot point analysis, a technique used to identify significant price levels where the market has previously reversed. It dynamically tracks a set number of recent swing highs and lows, allowing traders to see if the price is revisiting a previously significant level. The concept of breakouts and retests is widely used in technical analysis to determine potential entry points. A breakout occurs when the price moves beyond a resistance or support level, and a retest happens when the price returns to test that level before continuing in the breakout direction. This script enhances that analysis by incorporating ATR-based tolerance levels, ensuring that price zones are not too large.
FEATURES
Breakout and Retest Markings : Highlights breakout and retest areas with shaded boxes, allowing traders to visualize where price action is confirming key levels.
Volume Delta and Ratio : Analyzes volume at breakout levels to gauge the strength of the move, displaying volume delta information for additional context. The script also displays the ratio of selling to buying at the retest along traders to make better judgement on their entries.
Multi-Timeframe Adaptability : Dynamically adjusts volume analysis to align with the appropriate lower timeframe, ensuring reliable volume comparisons.
Alerts for Breakout and Retest Events : Traders can receive real-time notifications when bullish or bearish breakout retests are detected.
USAGE
This script is best suited for traders looking to identify strong breakout and retest setups across different timeframes. Users can customize the pivot detection period and swing point memory to adjust sensitivity based on their trading style. The ATR length and multiplier allow further refinement of breakout tolerance, reducing noise in volatile markets. The breakout zones are displayed as shaded boxes, where traders can assess whether a price retest is occurring under favorable conditions. Alerts can be set to notify traders of potential trade opportunities.

Breaks and Retests - Free990Strategy Description: "Breaks and Retests - Free990"
The "Breaks and Retests - Free990" strategy is based on identifying breakout and retest opportunities for potential entries in both long and short trades. The idea is to detect price breakouts above resistance levels or below support levels, and subsequently identify retests that confirm the breakout levels. The strategy offers an automated approach to enter trades after a breakout followed by a retest, which serves as a confirmation of trend continuation.
Key Components:
Support and Resistance Detection:
The strategy calculates pivot levels based on historical price movements to define support and resistance areas. A lookback range is used to determine these key levels.
Breakouts and Retests:
The system identifies when a breakout occurs above a resistance level or below a support level.
It then waits for a retest of the previously broken level as confirmation, which is often a better entry opportunity.
Trade Direction Selection:
Users can choose between "Long Only," "Short Only," or "Both" directions for trading based on their market view.
Stop Loss and Trailing Stop:
An initial stop loss is placed at a defined percentage away from the entry.
The trailing stop loss is activated after the position gains a specified percentage in profit.
Long Entry:
A long entry is triggered if the price breaks above a resistance level and subsequently retests that level successfully.
The entry condition checks if the breakout was confirmed and if a retest was valid.
The long entry is only executed if the user-selected direction is either "Long Only" or "Both."
Short Entry:
A short entry is triggered if the price breaks below a support level and subsequently retests that level.
The short entry is only executed if the user-selected direction is either "Short Only" or "Both."
sell_condition checks whether the support has been broken and whether the retest condition is valid.
An initial stop loss is placed when the trade is opened to limit the risk if the trade moves against the position.
The stop loss is calculated based on a user-defined percentage (stop_loss_percent) of the entry price.
pinescript
Copy code
stop_loss_price := strategy.position_avg_price * (1 - stop_loss_percent / 100)
For long positions, the stop loss is placed below the entry price.
For short positions, the stop loss is placed above the entry price.
Trailing Stop:
When a position achieves a certain profit threshold (profit_threshold_percent), the trailing stop mechanism is activated.
For long positions, the trailing stop follows the highest price reached, ensuring that some profit is locked in if the price reverses.
For short positions, the trailing stop follows the lowest price reached.
Code Logic for Trailing Stop:
Exit Execution:
The strategy exits the position when the price hits the calculated stop loss level.
This includes both the initial stop loss and the trailing stop that adjusts as the trade progresses.
Code Logic for Exit:
Summary:
Breaks and Retests - Free990 uses support and resistance levels to identify breakouts, followed by retests for confirmation.
Entry Points: Triggered when a breakout is confirmed and a retest occurs, for both long and short trades.
Exit Points:
Initial Stop Loss: Limits risk for both long and short trades.
Trailing Stop Loss: Locks in profits as the price moves in favor of the position.
This strategy aims to capture the momentum after breakouts and minimize losses through effective use of stop loss and trailing stops. It gives the flexibility of selecting trade direction and ensures trades are taken with confirmation through the retest, which helps to reduce false breakouts.
Original Code by @HoanGhetti

Moving Average Pullback Signals [UAlgo]The "Moving Average Pullback Signals " indicator is designed to identify potential trend continuation or reversal points based on moving average (MA) pullback patterns. This tool combines multiple types of moving averages, customized trend validation parameters, and candlestick wick patterns to provide reliable buy and sell signals. By leveraging several advanced MA methods (such as TEMA, DEMA, ZLSMA, and McGinley-D), this script can adapt to different market conditions, providing traders with flexibility and more precise trend-based entries and exits. The addition of a gradient color-coded moving average line and wick validation logic enables traders to visualize market sentiment and trend strength dynamically.
🔶 Key Features
Multiple Moving Average (MA) Calculation Methods: This indicator offers various MA calculation types, including SMA, EMA, DEMA, TEMA, ZLSMA, and McGinley-D, allowing traders to select the MA that best fits their strategy.
Trend Validation and Pattern Recognition: The indicator includes a customizable trend validation length, ensuring that the trend is consistent before buy/sell signals are generated. The "Trend Pattern Mode" setting provides flexibility between "No Trend in Progress," "Trend Continuation," and "Both," tailoring signals to the trader’s preferred style.
Wick Validation Logic: To enhance the accuracy of entries, this indicator identifies specific wick patterns for bullish or bearish pullbacks, which signal potential trend continuation or reversal. Wick length and validation factor are adjustable to suit various market conditions and timeframes.
Gradient Color-coded MA Line: This feature provides a quick visual cue for trend strength, with color changes reflecting relative highs and lows of the MA, enhancing market sentiment interpretation.
Alerts for Buy and Sell Signals: Alerts are triggered when either a bullish or bearish pullback is detected, allowing traders to receive instant notifications without continuously monitoring the chart.
Visual Labels for Reversal Points: The indicator plots labels ("R") at potential reversal points, with color-coded labels for bullish (green) and bearish (red) pullbacks, highlighting pullback opportunities that align with the trend or reversal potential.
🔶 Disclaimer
Use with Caution: This indicator is provided for educational and informational purposes only and should not be considered as financial advice. Users should exercise caution and perform their own analysis before making trading decisions based on the indicator's signals.
Not Financial Advice: The information provided by this indicator does not constitute financial advice, and the creator (UAlgo) shall not be held responsible for any trading losses incurred as a result of using this indicator.
Backtesting Recommended: Traders are encouraged to backtest the indicator thoroughly on historical data before using it in live trading to assess its performance and suitability for their trading strategies.
Risk Management: Trading involves inherent risks, and users should implement proper risk management strategies, including but not limited to stop-loss orders and position sizing, to mitigate potential losses.
No Guarantees: The accuracy and reliability of the indicator's signals cannot be guaranteed, as they are based on historical price data and past performance may not be indicative of future results.

DTFX Algo Zones [LuxAlgo]DTFX Algo Zones are auto-generated Fibonacci Retracements based on market structure shifts.
These retracement levels are intended to be used as support and resistance levels to look for price to bounce off of to confirm direction.
🔶 USAGE
Due to the retracement levels only being generated from identified market structure shifts, the retracements are confined to only draw from areas considered more important due to the technical Break of Structure (BOS) or Change of Character (CHoCH).
The simple action that causes a market structure shift occurs is price breaking above or below a specific swing point. When a market structure shift happens, a retracement is drawn from the point of break to the highest or lowest point since that point. Due to the price action necessary for a market structure shift, these retracements will not always be immediately actionable.
These retracement levels are intended to be used as points to watch for price to retrace to and bounce from, confirming the current direction of price.
In the example below, after the retracement is initiated, by bouncing off of the retracement levels formed from the previous market structure shift it would further confirm the bias of the market structure shift. A break going through these levels would display a weakness from the current market structure shift, implying that it could simply be noise.
🔶 DETAILS
The script uses standard SMC Market structure identification to determine Break of Structures (BOS) and Change of Characters (CHoCH). The specific swing points can be identified by the shapes placed above or below the specific swing high/low candle.
By unchecking the "Display All Zones" setting, users are able to specify the exact number of retracement zones to display using the "Show Last" parameter. This is handy for cleaning up the chart to stay focused on the most recent retracements.
Additionally, when displaying multiple zones, the "Clean-Up Level Overlap" setting may be helpful for decluttering as well. This option optimizes the display of retracement levels to minimize their overlap on other adjacent zones.
The script allows for up to 5 Fib levels to be displayed from each zone, with options for display, value, line style, and color for each of the 5.
The calculation for Fib Levels changes depending on the direction of market structure shifts. When an upwards (Bullish) zone is generated, the retracement is drawn with the bottom of the zone being 0 and the top of the zone being 1. This is reversed for downwards (Bearish) zones.
🔶 SETTINGS
Structure Length: Sets the SMC structure length to use for finding MMS.
Show Last: Displays this number of retracement zones. (Display All Zones Must be Unchecked)
Display All Zones: Ignores "Show Last" number and displays all historical MMS Retracement Zones.
Zone Display: Choose which zones to display, only bearish, only bullish, or both.
Clean-Up Level Overlap: Minimizes overlap between adjacent zones and levels.
Fib Levels: Settings to display and customize up to 5 Fib levels for each zone.

Inversion Fair Value Gaps [TradingFinder] IFVG ICT Signal| Alert🔵 Introduction
🟣 Inversion Fair Value Gap (IFVG)
An ICT Inversion Fair Value Gap, or reverse FVG, occurs when a fair value gap fails to hold its price, resulting in the price moving beyond and breaking the gap. This situation marks the initial change in price momentum.
Generally, prices respect fair value gaps and continue in their trend direction. However, when a fair value gap is breached, it transforms into an inversion fair value gap, signaling a potential short-term reversal or a subsequent change in direction.
🔵 How to Use
🟣 Identifying an Inversion Fair Value Gap
To spot an IFVG, you must first identify a fair value gap.
Inversion fair value gaps can be categorized into two types :
🟣 Bullish Inversion Fair Value Gap
A bullish IFVG occurs when a bearish fair value gap is invalidated by the price closing above it.
Steps to identify it :
Identify a bearish fair value gap.
When the price closes above this gap, it becomes a bullish inversion fair value gap.
This gap acts as a support level, pushing the price upwards and indicating a shift in momentum from sellers to buyers.
🟣 Bearish Inversion Fair Value Gap
A bearish IFVG happens when a bullish fair value gap fails, with the price closing below it.
Steps to identify it :
Identify a bullish fair value gap.
When the price closes below this gap, it becomes a bearish inversion fair value gap.
This gap acts as a resistance level, pushing the price downwards and indicating a shift in momentum from buyers to sellers.
🔵 Settings
🟣 Global Settings
Show All Inversion FVG: If disabled, only the most recent FVG will be displayed.
IFVG Validity Period (Bar): Determines the maximum duration (in number of candles) that the FVG and IFVG remain valid.Switching Colors Theme Mode: Includes three modes: "Off", "Light", and "Dark". "Light" mode adjusts colors for light mode use, "Dark" mode adjusts colors for dark mode use, and "Off" disables color adjustments.
🟣 Logic Settings
FVG Filter : This refines the number of identified FVG areas based on a specified algorithm to focus on higher quality signals and reduce noise.
Types of FVG filters :
Very Aggressive Filter : Adds a condition where, for an upward FVG, the last candle's highest price must exceed the middle candle's highest price, and for a downward FVG, the last candle's lowest price must be lower than the middle candle's lowest price. This minimally filters out FVGs.
Aggressive Filte r: Builds on the Very Aggressive mode by ensuring the middle candle is not too small, filtering out more FVGs.
Defensive Filter : Adds criteria regarding the size and structure of the middle candle, requiring it to have a substantial body and specific polarity conditions, filtering out a significant number of FVGs.
Very Defensive Filter : Further refines filtering by ensuring the first and third candles are not small-bodied doji candles, retaining only the highest quality signals.
Mitigation Level FVG and IFVG : Options include "Proximal", "Distal", or "50 % OB" modes, which you can choose based on your needs. The "50 % OB" line is the midpoint between distal and proximal.
🟣 Display Settings
Show Bullish IFVG : Toggles the display of demand-related boxes.
Show Bearish IFVG : Toggles the display of supply-related boxes.
🟣 Alert Settings
Alert Inversion FVG Mitigation : Enables alerts for Inversion FVG mitigation.
Message Frequency : Determines the frequency of alerts. Options include 'All' (every function call), 'Once Per Bar' (first call within the bar), and 'Once Per Bar Close' (final script execution of the real-time bar). Default is 'Once per Bar'.
Show Alert Time by Time Zone : Configures the time zone for alert messages. Default is 'UTC'.
Display More Info : Provides additional details in alert messages, including price range, date, hour, and minute. Set to 'Off' to exclude this information.

Support and Resistance (High Volume Boxes) [ChartPrime]Support and Resistance (High Volume Boxes)
◆ Overview:
The "Support and Resistance" indicator identifies key support and resistance levels using pivot points and volume analysis. It visually represents these levels with dynamically colored boxes, indicating the strength of the volume. This helps traders recognize potential price reversals and key zones for buy and sell opportunities.
◆ Key Features:
Dynamic Support and Resistance Boxes:
The indicator plots support and resistance boxes based on pivot points and volume above threshold for positive volume boxes and below lower threshold for negative volume boxes.
Box colors change from transparent to more intense based on volume, reflecting the strength of support or resistance.
Boxes expands until a new box of the same type appears.
Volume-Based Color Coding:
Boxes are color-coded based on the amount of volume:
Green boxes indicate support levels with positive volume.
Red boxes indicate resistance levels with negative volume.
Hold Signals:
Green diamonds (◆) indicate when support holds, signaling potential buy opportunities.
Red diamonds (◆) indicate when resistance holds, signaling potential sell opportunities.
Breakout Labels:
If the price falls below a support level, that level will become resistance. If the price rises above a resistance level, it will often become support. As the price moves past a level of support or resistance, it is thought that supply and demand has shifted, causing the breached level to reverse its role.
Labels "Break Sup" and "Break Res" are displayed when support or resistance levels are broken, indicating significant market movements.
◆ Break Resistance:
◆Break Support:
◆ Usage Notes:
This indicator helps traders identify strong support and resistance levels, offering visual cues for potential price reversals.
By analyzing volume at these levels, traders can gauge the strength of these zones and make more informed trading decisions.
◆ Settings:
Lookback Period: The number of bars to look back for pivot points.
Delta Volume Filter Length: The length of the volume filter for more accurate volume analysis. (Higher input, will filter low volume boxes)
Adjust Box Width: Adjusts the width of the support and resistance boxes.
This indicator is designed to enhance your trading by providing clear visual cues for support and resistance levels based on volume, making it easier to spot potential price reversals and key trading opportunities.

Breakouts with Tests & Retests [LuxAlgo]The Breakouts Tests & Retests indicator highlights tests and retests of levels constructed from detected swing points. A swing area of interest switches colors when a breakout occurs.
Users can control the sensitivity of the swing point detection and the width of the swing areas.
🔶 USAGE
When a Swing point is detected, an area of interest is drawn, colored green for a bullish swing and red when bearish.
A test is confirmed when the opening price is situated in the area of interest, and the closing price is above or below the area, depending on whether it is a bullish or bearish swing. Tests are highlighted with a solid-colored triangle.
A breakout is confirmed when the price closes in the opposite position, below or above the area, in which case the area will switch colors.
If the opening price is located within the area and the closing price closes outside the area, in the same direction as the breakout, this is considered a retest . Retests are highlighted with a hollow-colored triangle.
Note that tests/retests do not act on wicks. The main factor is that the opening price is in the area of interest, while the closing price is outside.
🔹 Area Of Interest Width
The user can adjust the width of the swing areas. Changing the " Width " is a fast and easy way to find different areas of interest.
A higher "Multiple" setting would return a wider area, allowing price to develop within it for a longer period of time and potentially provide later test signals.
When a swing area is broken, a higher "Width" setting can make it more complicated for the price to break it again, allowing a swing area to remain valid for a longer period of time thus potentially providing more retest signals.
🔶 DETAILS
Generally, only one bullish/bearish pattern can be active at a time. This means that no more than 1 bullish or bearish area will be active.
The " Display " settings, however, can help control how areas of different types are displayed.
Bullish AND Bearish: Both, bullish and bearish patterns can be drawn at the same time
Bullish OR Bearish: Only 1 bullish or 1 bearish pattern is drawn at a time
Bullish: Only bullish patterns
Bearish: Only bearish patterns
🔹 Test/Retest Labels
The user can adjust the settings so only the latest test/retest label is shown or set a minimum number of bars until the next test/retest can be drawn.
🔹 Maximum Bars
Users can set a limit of bars for when there is no test/retest in that period; the area of interest won't be updated anymore and will be available and ready for the next Swing.
An option for pulling the area back to the last retest is included.
🔶 SETTINGS
Display: Determines which swing areas are displayed by the indicator. See the "DETAILS" section for more information
Multiple: Adjusts the width of the areas of interest
Maximum Bars: Limit of bars for when there is no test/retest
Display Test/Retest Labels: Show all labels or just the last test/retest label associated with a swing area
Minimum Bars: Minimum bars required for a subsequent test/retest label are allowed to be displayed
Set Back To Last Retest: When after "Maximum Bars" no test/retest is found, place the right side of the area at the last test/retest
🔹 Swings
Left: x amount of wicks on the left of a potential Swing need to be higher/lower for a Swing to be confirmed.
Right: The number of wicks on the right of a potential swing needs to be higher/lower for a Swing to be confirmed.
🔹 Style
Bullish: color for test period (before a breakout) / retest period (after a breakout)
Bearish: color for test period (before a breakout) / retest period (after a breakout)
Label Size

Range Average Retest Model [LuxAlgo]The Range Average Retest Model tool highlights setups from the range average retest entry model, a model using the retest of the average between two opposite swing points as an entry.
This tool uses long-term volatility coupled with user-defined multipliers to filter out swing areas and set take profit and stop loss levels for all trades.
Key features include:
Draw up to 165 swing areas and their associated trades
Filter out swing areas using Pivot Length , Selection Mode and Threshold parameters
Filter out trades with Maximum Distance and Minimum Distance parameters
Enable or disable swing areas and select default colors
Enable or disable overlapping trades and change the default colors for Take Profit and Stop Loss zones
🔶 USAGE
The "Range Average Retest Model" is an entry model that enters a position when the price retests the average made between two swing points. Users can determine the period of the detected swing points from the "Pivot Length" setting.
The conditions for long or short trades, regardless of whether the swing area is bullish or bearish, are as follows:
Long positions: the current bar close is below the swing area average and the last bar close was above it.
Short positions: the current bar close is above the swing area average price and the last bar close was below it.
Each trade is displayed on the chart with a line connecting it to its swing area highlighting the range average, a green area for the take profit, and a red area for the stop loss.
Both the Take Profit and Stop Loss levels are calculated by applying your own multiplier in the settings panel to the long-term volatility measure, in this case, the average true range over the last 200 bars.
Trades will remain open until they reach either the Stop Loss or Take Profit price levels.
🔹 Filtering Swing Areas
The daily chart of the Nasdaq-100 futures (NQ) with pivot length 2 and bullish selection mode: it only detects bullish swing areas, but they are smaller and more numerous.
Traders can manipulate the behavior of the swing areas from the settings panel.
The Selection mode will filter areas by bias: it will detect bullish areas, bearish areas, or both.
The Threshold parameter is applied to the long-term volatility to filter out areas where the average prices are too close together; the higher the value, the greater the difference between the average prices must be.
🔹 Trades
3-minute chart of the Nasdaq-100 futures (NQ) with pivot length 5, bearish selection mode maximum distance 4, and stop loss 2: many trades detected with very asymmetric risk/reward.
The behavior of the trades is also manipulated from the settings panel.
The maximum and minimum distance parameters specify the number of bars a trade must be away from a swing area.
The Take Profit and Stop Loss parameters are applied to the long-term volatility to obtain their respective price levels.
🔹 Overlapping Trades
Same chart as before, but with overlapping trades: messy, right?
By default the tool does not show overlapping trades, this allows for a cleaner chart.
In the settings panel traders can enable overlapping mode, in which case the tool will show all available trades.
Traders must be aware that the chart can be very crowded.
🔶 SETTINGS
🔹 Swings
Pivot Length: How many bars are used to confirm a swing point. The larger this parameter is, the larger and fewer swing areas will be detected.
Selection Mode: Swing area detection mode, detect only bullish swings, only bearish swings, or both.
Threshold: Swing area comparator. This threshold is multiplied by a measure of volatility (average true range over the last 200 bars), for a new swing area to be detected it must have an average level that is sufficiently distant from the average level of any untouched swing area, this parameter controls that distance.
🔹 Trades
Maximum distance: Maximum distance allowed between a swing area and a trade.
Minimum distance: Minimum distance allowed between a swing area and a trade.
Take profit: The size of the take profit - this threshold is multiplied by a measure of volatility (the average true range over the last 200 bars).
Stop loss: The size of the stop-loss: this threshold is multiplied by a measure of volatility (the average true range over the last 200 bars).

Inversion Fair Value Gaps (IFVG) [LuxAlgo]The Inversion Fair Value Gaps (IFVG) indicator is based on the inversion FVG concept by ICT and provides support and resistance zones based on mitigated Fair Value Gaps (FVGs).
🔶 USAGE
Once mitigation of an FVG occurs, we detect the zone as an "Inverted FVG". This would now be looked upon for potential support or resistance.
Mitigation occurs when the price closes above or below the FVG area in the opposite direction of its bias.
Inverted Bullish FVGs Turn into Potential Zones of Resistance.
Inverted Bearish FVGs Turn into Potential Zones of Support.
After the FVG has been mitigated, returning an inversion FVG, a signal is displayed each time the price retests an IFVG zone and breaks below or above (depending on the direction of the FVG).
Keep in mind how IFVGs are calculated and displayed. Once price mitigates an IFVG, all associated graphical elements such as areas, lines, and signals will be deleted.
This indicator is not meant to be just a 'signal indicator'. Backtesting historical signals is incorrect as it does not consider the mitigation of IFVGs, which is a standard method for trading IFVGs & various concepts by ICT.
The signals displayed are meant for real-time analysis of current bars for discretionary analysis. Current confirmed retests of unmitigated IFVGs are still displayed to show which IFVGS have had significant reactions.
🔶 SETTINGS
Show Last: Specifies the number of most recent FVG Inversions to display in Bullish/Bearish pairs, starting at the current and looking back. Max 100 Pairs.
Signal Preference: Allows the user to choose to send signals based on the (Wicks) or (Close) Prices. This can be changed based on user preference.
ATR Multiplier: Filters FVGs based on ATR Width, The script will only detect Inversions that are greater than the ATR * ATR Width.
🔶 ALERTS
This script includes alert options for all signals.
🔹 Bearish Signal
A bearish signal occurs when the price returns to a bearish inversion zone and rejects to the downside.
🔹 Bullish Signal
A bullish signal occurs when the price returns to a bullish inversion zone and bounces out of the top.

Support and Resistance with Signals [UAlgo]🔶 Description:
"Support and Resistance with Signals ", is designed to identify key support and resistance levels on a trading chart while also signaling potential retests (denoted as "R") and breakouts (denoted as "B"). The indicator dynamically plots support and resistance lines based on pivot points and adjusts them according to price action and sensitivity settings. It aims to assist traders in identifying significant price levels and potential reversal or breakout opportunities.
🔶 Key Features:
Pivot Points: The indicator calculates pivot highs and pivot lows based on a specified period length (Checks Left and Right bars). Adjust the length of the pivot period to control the sensitivity of support and resistance levels according to the your preferences.
Support and Resistance Lines: It plots support and resistance lines at the pivot high and pivot low points, respectively.
Retest and Breakout Signals: Signals are generated based on the sensitivity setting, which adds/subtracts a portion (half) of the Average True Range (ATR) to the pivot points. A retest signal ("R") is generated when the price approaches the support or resistance level within the sensitivity range. A breakout signal ("B") is generated when the price surpasses the support or resistance level.
Sensitivity (ATR Length): Modify the retest-breakout sensitivity length to fine-tune the generation of signals based on price volatility.
Maximum Lines : Limit the number of support and resistance lines displayed on the chart for clarity.
Line Colors and Width: Customize the colors and width of support and resistance lines for better visualization.
More Examples:
Before Retest Signal:
When the price enters the retest range at the specified sensitivity:
Disclaimer:
This indicator is provided for informational purposes only and should not be considered as financial advice. Trading involves risk, and users should conduct their own research and analysis before making any investment decisions. The retest and breakout signals generated by this indicator are based on historical price data and may not guarantee future results. Users should exercise caution and use additional confirmation methods before entering any trades based on the signals provided by this indicator.
Happy Trading !
TouchedLibrary "Touched"
Breakout(zone, lookback)
Tells if the zone has been broken on the current bar.
Parameters:
zone (Zone) : The definitiin of the zone.
lookback (int) : How many bars to look back.
Returns: a Touch object that tells if the zone has been broken up or down.
FalseBreakout(zone, lookback)
Tells if the zone has a false breakout on the current bar.
Parameters:
zone (Zone) : The definitiin of the zone.
lookback (int) : How many bars to look back.
Returns: a Touch object that tells if the zone has had a false breakout up or down.
Retest(zone, lookback)
Tells if the zone has been retested on the current bar.
Parameters:
zone (Zone) : The definitiin of the zone.
lookback (int) : How many bars to look back.
Returns: a Touch object that tells if the zone has been retested up or down.
Zone
Fields:
High (series__float)
Low (series__float)
BaseTime (series__integer)
Touch
Fields:
Up (series__bool)
Down (series__bool)

Retest Support Resistance Signals [ChartPrime]The Retest Support Resistance Signals Indicator is a powerful tool designed to assist traders in identifying key support and resistance levels within the market. Most importantly and uniquely it identifies retests of these structures and displays them on the trader's chart. By utilizing a combination of pivot points and price action analysis, this indicator offers valuable insights for both signal-based and support/resistance trading strategies.
Key Features & settings:
Retest Confirmation: The indicator waits for a break above a support or resistance level and observes subsequent price action. If price retraces and forms a wick below the level, followed by a bounce, the indicator identifies it as a retest and labels it as "R" to indicate potential support or resistance confirmation.
This indicator combines the benefits of signal-based trading and support/resistance analysis, providing users with a versatile trading tool suitable for various strategies.
Retest Weaker Toggle: Users have the option to enable or disable the retest weaker feature. When enabled, the indicator considers a support or resistance level weaker if it experiences a test. When disabled, the indicator assumes that a bounce may occur from the level.
Pivot Detection Customization: Users can adjust the pivot detection method based on either wicks or bodies. This flexibility allows traders to adapt the indicator to different market conditions and preferences. The trader can also customize the number of bars used for pivot detection on both the left and right sides. This feature enables traders to fine-tune the indicator's sensitivity and responsiveness.
Users also have control over how support or resistance levels are managed on the chart. They can choose to either stop updating the levels (freeze) or completely remove them (delete) from the chart.
Breakout Threshold Setting: Traders can adjust the breakout threshold until deletion setting. This setting determines the number of successful breakouts through a support or resistance level required to remove it from the chart. This feature helps filter out weaker levels and focus on more significant ones.
Shown above we see the retest labels in action denoted with an R label
This indicator can be a useful addition to an SR trader's toolkit. Identifying when a level in the market is retested can reveal interesting information about the underlying strength of a trend. This indicator has been designed with the two major schools of thought; a level gets weaker the more it's tested vs stronger the more it's tested. We have designed this therefore to be versatile and adapt to both thought procceses. The R labels should be taken and considered as a larger part of an analysis process and not followed blindly.

Support & Resistance With Breakout & RetestIntro
The Breakout Retest Indicator is a valuable tool utilized to confirm the occurrence of a proper breakout so you know when to enter on a retest. It analyses the price movement of an asset and identifies a breakout when the price level surpasses the inputted support and resistance values.
Conditions
The indicator operates based on simple yet reliable conditions. Once a candle closes above or below the specified line, the next candle's closure above or below without touching the high or low levels confirms the breakout. The indicator subsequently changes its color, signaling a long or short position. Upon retesting, it reverts to its original color.
Need Your Help
I am sharing this indicator to solicit your input in improving it. As a committed developer, I have ambitious plans for enhancing the indicator's functionality. To that end, I welcome your suggestions and ideas to build indicators that can contribute to the success of people's strategies.
Future Ideas
Some of the potential improvements that I plan to incorporate include the implementation of zones. Users will be able to define zones that require breaking above or below for a confirmed breakout. Additionally, a volume check will provide additional confirmation by evaluating the volume level relative to the breakout. Lastly, close above or below feature will ensure that a certain number of ticks, percentage, or price level has been breached to confirm the breakout.
Regression Channel, Candles and Candlestick Patterns by MontyRegression Candles by ugurvu
Regression Channel by Tradingview
All Candlestick Patterns By Tradingview
This script was combined for a friend of mine who needed this.
This Script has regression candles by ugurvu, Regression channel and Candlestick patterns by tradingview.
The intention was to fuse these together so more information can be processed on the cost of a single indicator.

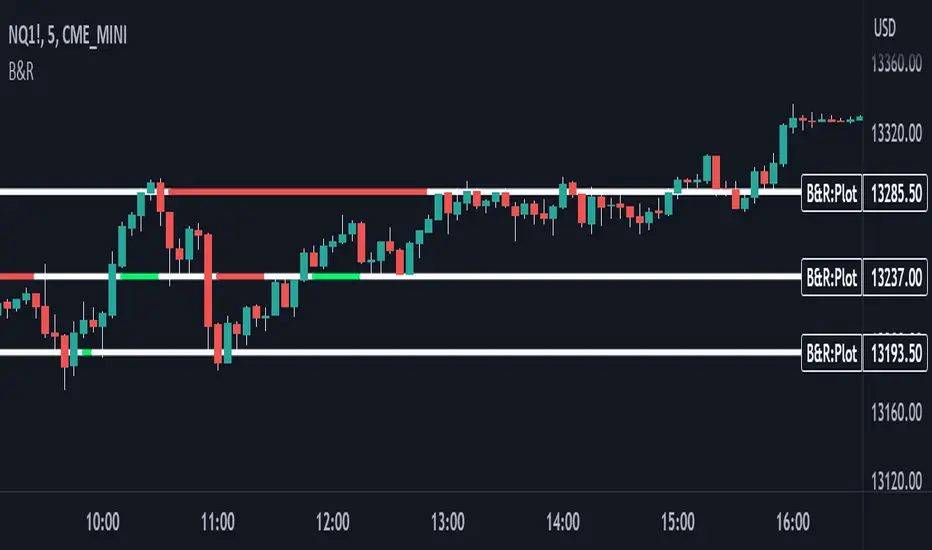
Fractal Level Zones - Break / Test / RaidFractal Level Zones - Break / Test / Raid
An experimental script that marks out the last two unbroken fractal high and low zones. The aim of the script is to focus on the type of candles that form and close in a zone. They can either tap into the zone or break them.
There are a number of outcomes:
- Break
- Break and retest
- Reversal
- Raid
When a zone is broken, the next untested fractal zone is printed.
How to use:
The indicator is to be used on higher time frames (M,W,D/4H). Monitor the type of candles that in form a zone (Daily TF recommended)
Default icon colours
Orange - Test of Zone
Purple - Break of fractal (can also be a raid)
Alert function included
Indicator in Use
Bollinger Band+ Multi EMA, SMAHello Everyone.
I make Bollinger band , 3 ema and 3 sma combined.
I think this indicator can use all timeframe.
--------------------------------------------------------------
Indicator will show you
1. Trend follow
2. Pullback catch
2. Market bounce.
1. Trend Follow
- Trend Follow for I used 3 terms. They are short, Mid and Long Trend.
2. Pullback Catch
- EMA for Save, take care, alert Zones.
- Mid Term Trend can be catch also.
3. Market Bounce
- Bollinger Band will show you market re-bounce point.
Final Notes
Indicator will show Trend, Pullback, Market bounce and some support and resistant level.

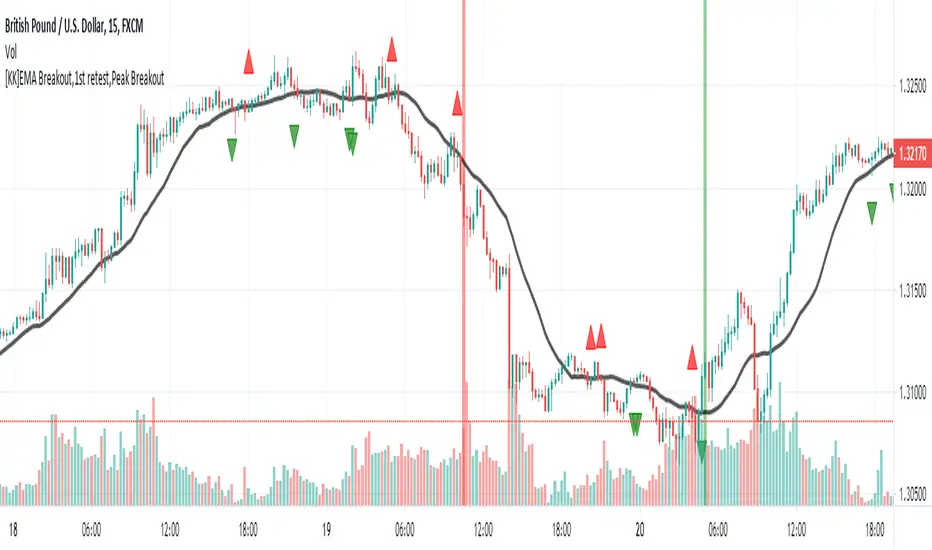
[KK]EMA Breakout,1st retest,Peak BreakoutThis script gives Signal based on 3 parameters
(1) Exponential Moving average breakout
(2)Retest after Breakout
(3) Peak Breakout after retest for conformation
Recommended Settings:
(1) EMA Length = 20 period
(2)Left Bars= Right Bars = 4
(3)15min chart resolution
Note: Default setting is what recommended.
Interpretation:
(1)Green Background = Higher Peak Breakout candle after conformed retest
(2)Red Background = Lower Peak Breakout candle after conformed retest
(3) Green circle = 1st Upward Breakout candle after conformed retest ( if previous breakout is Downward)
(4)Red circle = 1st Downward Breakout candle after conformed retest ( if previous breakout is Upward)
Note: you can additionally add backgrounds for EMA breakout and conformed Retest from code.
Signals:
(1)Long = When Green circle
(2)Short = When Red circle
This script works with any ticker id. Best Use for Equity and Forex Markets. Also, added alert condition for green and red circle.
P.S.: Thanks to @RagingRocketBull for source code for breakout candles
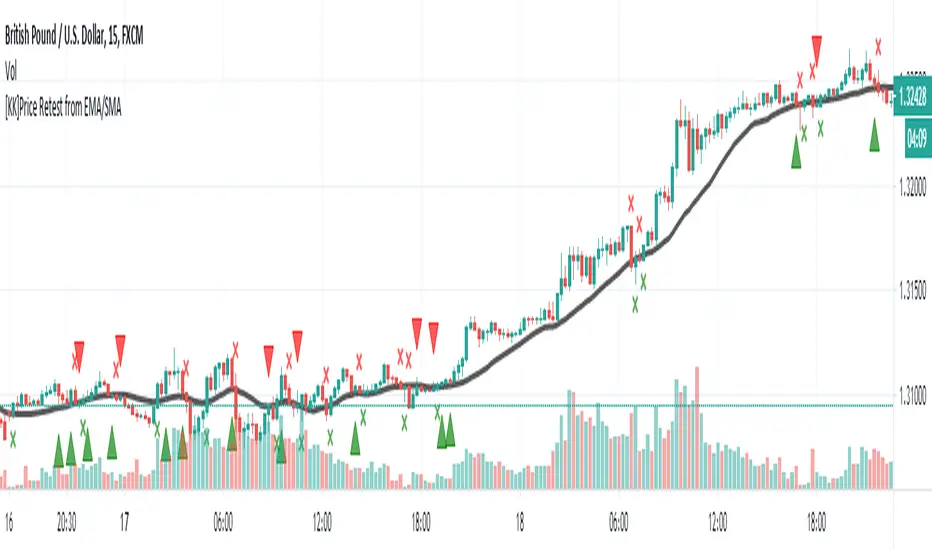
[KK]Price Retest from EMAScript show fractals on chart when price retest after breaking Exponential Moving Average.